| Multiple Linear Regression - Estimated Regression Equation |
| unempl[t] = + 10.7362119129704 -0.0863544648682223proman[t] + 1.76734118577122M1[t] + 1.24855473732718M2[t] + 1.53542273993681M3[t] + 0.676228520664832M4[t] + 0.867552719598188M5[t] + 1.66329276027544M6[t] -1.30436019033809M7[t] + 1.46561409647386M8[t] + 1.71438036762800M9[t] + 2.02024635250865M10[t] + 1.71717488698802M11[t] + e[t] |
| Multiple Linear Regression - Ordinary Least Squares | |||||
| Variable | Parameter | S.D. | T-STAT H0: parameter = 0 | 2-tail p-value | 1-tail p-value |
| (Intercept) | 10.7362119129704 | 0.906545 | 11.843 | 0 | 0 |
| proman | -0.0863544648682223 | 0.009075 | -9.5155 | 0 | 0 |
| M1 | 1.76734118577122 | 0.3785 | 4.6693 | 2.5e-05 | 1.3e-05 |
| M2 | 1.24855473732718 | 0.37041 | 3.3707 | 0.001507 | 0.000753 |
| M3 | 1.53542273993681 | 0.381345 | 4.0263 | 0.000205 | 0.000103 |
| M4 | 0.676228520664832 | 0.364134 | 1.8571 | 0.069572 | 0.034786 |
| M5 | 0.867552719598188 | 0.370851 | 2.3394 | 0.023618 | 0.011809 |
| M6 | 1.66329276027544 | 0.395358 | 4.2071 | 0.000115 | 5.8e-05 |
| M7 | -1.30436019033809 | 0.405322 | -3.2181 | 0.00234 | 0.00117 |
| M8 | 1.46561409647386 | 0.378446 | 3.8727 | 0.000332 | 0.000166 |
| M9 | 1.71438036762800 | 0.396692 | 4.3217 | 8e-05 | 4e-05 |
| M10 | 2.02024635250865 | 0.416075 | 4.8555 | 1.4e-05 | 7e-06 |
| M11 | 1.71717488698802 | 0.406893 | 4.2202 | 0.000111 | 5.5e-05 |
| Multiple Linear Regression - Regression Statistics | |
| Multiple R | 0.823911288067274 |
| R-squared | 0.678829810604674 |
| Adjusted R-squared | 0.596828911184591 |
| F-TEST (value) | 8.27832152336635 |
| F-TEST (DF numerator) | 12 |
| F-TEST (DF denominator) | 47 |
| p-value | 4.40602229145881e-08 |
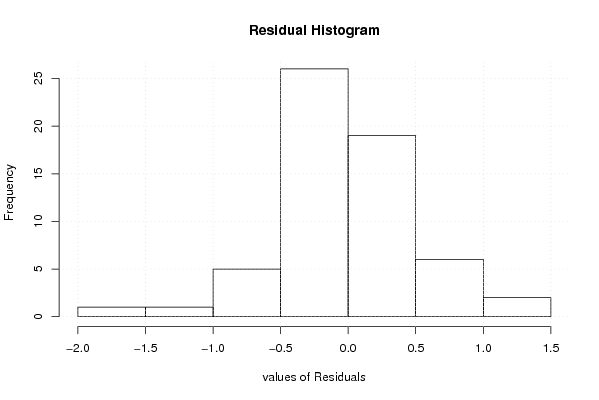
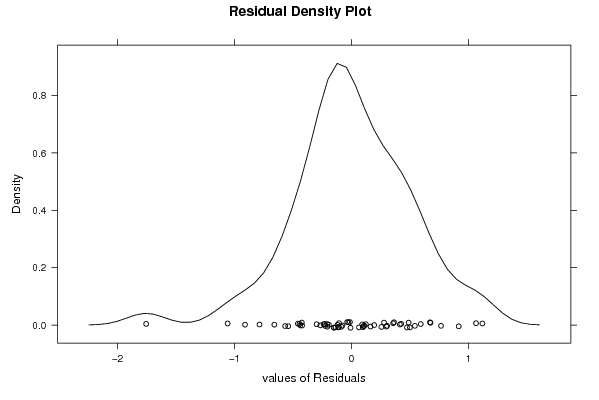
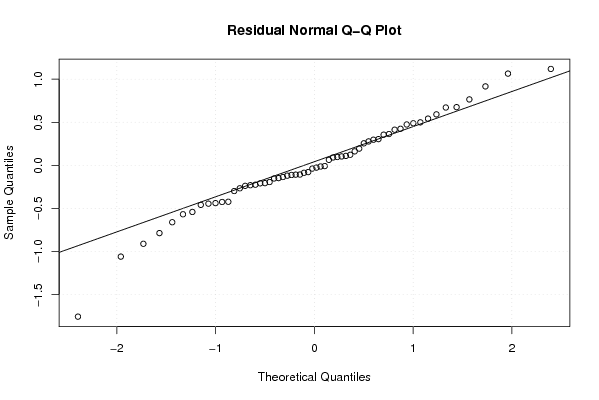
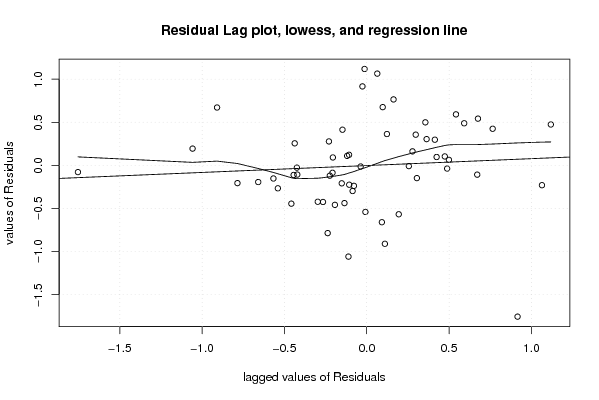
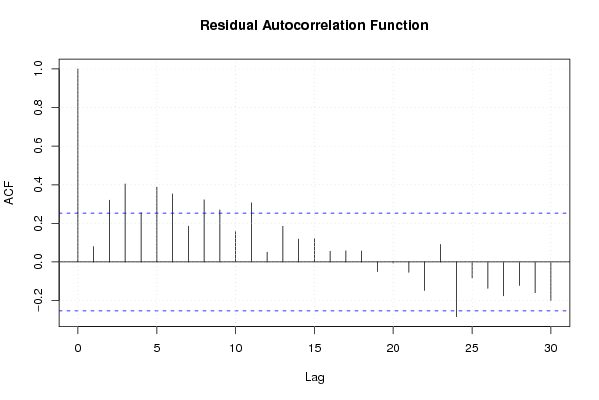
| Multiple Linear Regression - Residual Statistics | |
| Residual Standard Deviation | 0.571577374027925 |
| Sum Squared Residuals | 15.3549326415309 |
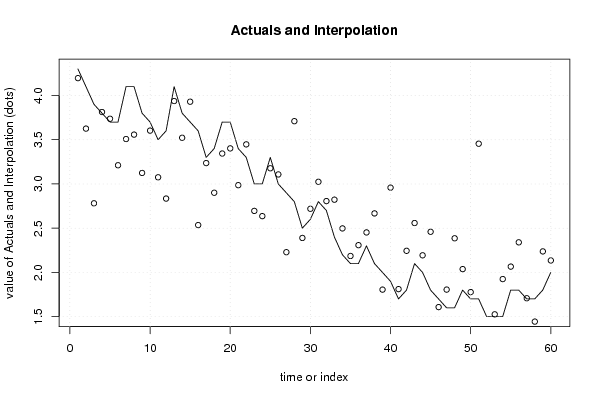
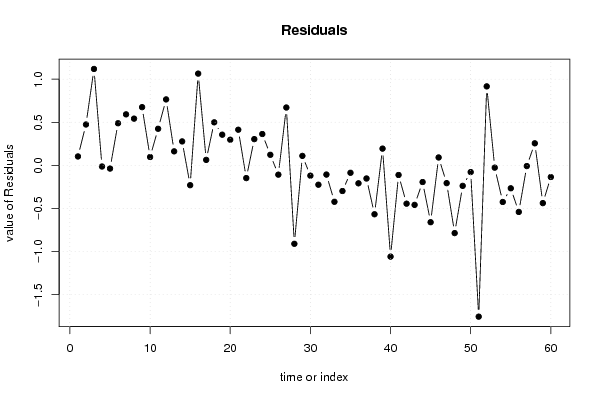
| Multiple Linear Regression - Actuals, Interpolation, and Residuals | |||
| Time or Index | Actuals | Interpolation Forecast | Residuals Prediction Error |
| 1 | 4.3 | 4.1962535784187 | 0.103746421581302 |
| 2 | 4.1 | 3.62565445105368 | 0.474345548946316 |
| 3 | 3.9 | 2.78127896388961 | 1.11872103611039 |
| 4 | 3.8 | 3.81324752523170 | -0.0132475252316958 |
| 5 | 3.7 | 3.73687288307356 | -0.0368728830735613 |
| 6 | 3.7 | 3.21138961126701 | 0.488610388732986 |
| 7 | 4.1 | 3.50793543267229 | 0.592064567327714 |
| 8 | 4.1 | 3.55774407613524 | 0.542255923864763 |
| 9 | 3.8 | 3.12431007483042 | 0.675689925169582 |
| 10 | 3.7 | 3.60288498944751 | 0.0971150105524916 |
| 11 | 3.5 | 3.0752919152695 | 0.424708084730501 |
| 12 | 3.6 | 2.83477837752808 | 0.765221622471915 |
| 13 | 4.1 | 3.93719018381399 | 0.162809816186008 |
| 14 | 3.8 | 3.52202909321182 | 0.277970906788181 |
| 15 | 3.7 | 3.92979334663697 | -0.229793346636966 |
| 16 | 3.6 | 2.53520144518200 | 1.06479855481800 |
| 17 | 3.3 | 3.23601698683787 | 0.0639830131621285 |
| 18 | 3.4 | 2.90051353774141 | 0.499486462258587 |
| 19 | 3.7 | 3.34386194942266 | 0.356138050577338 |
| 20 | 3.7 | 3.40230603937244 | 0.297693960627565 |
| 21 | 3.4 | 2.98614293104126 | 0.413857068958737 |
| 22 | 3.3 | 3.44744695268471 | -0.147446952684708 |
| 23 | 3 | 2.69533226984932 | 0.30466773015068 |
| 24 | 3 | 2.63616310833117 | 0.363836891668826 |
| 25 | 3.3 | 3.17727089297364 | 0.122729107026363 |
| 26 | 3 | 3.10752766184435 | -0.107527661844352 |
| 27 | 2.9 | 2.22861038873299 | 0.671389611267013 |
| 28 | 2.8 | 3.70962216738983 | -0.909622167389827 |
| 29 | 2.5 | 2.38974323112929 | 0.110256768870707 |
| 30 | 2.6 | 2.71916916151815 | -0.119169161518147 |
| 31 | 2.8 | 3.02435042941024 | -0.224350429410240 |
| 32 | 2.7 | 2.8064602317817 | -0.106460231781703 |
| 33 | 2.4 | 2.82206944779164 | -0.42206944779164 |
| 34 | 2.2 | 2.49754783913426 | -0.297547839134261 |
| 35 | 2.1 | 2.18584092712681 | -0.0858409271268084 |
| 36 | 2.1 | 2.30801614183193 | -0.208016141831930 |
| 37 | 2.3 | 2.45189338808057 | -0.151893388080570 |
| 38 | 2.1 | 2.66711989101642 | -0.567119891016417 |
| 39 | 2 | 1.80547351087870 | 0.194526489121303 |
| 40 | 1.9 | 2.95833832303629 | -1.05833832303629 |
| 41 | 1.7 | 1.81116831651220 | -0.111168316512204 |
| 42 | 1.8 | 2.24421960474292 | -0.444219604742924 |
| 43 | 2.1 | 2.55803631912184 | -0.45803631912184 |
| 44 | 2 | 2.19334353121732 | -0.193343531217323 |
| 45 | 1.8 | 2.45938069534511 | -0.659380695345107 |
| 46 | 1.7 | 1.60809685099157 | 0.091903149008428 |
| 47 | 1.6 | 1.80588128170663 | -0.20588128170663 |
| 48 | 1.6 | 2.38573516021333 | -0.785735160213329 |
| 49 | 1.8 | 2.03739195671310 | -0.237391956713103 |
| 50 | 1.7 | 1.77766890287373 | -0.077668902873728 |
| 51 | 1.7 | 3.45484378986174 | -1.75484378986174 |
| 52 | 1.5 | 0.58359053916018 | 0.91640946083982 |
| 53 | 1.5 | 1.52619858244707 | -0.0261985824470702 |
| 54 | 1.5 | 1.9247080847305 | -0.424708084730502 |
| 55 | 1.8 | 2.06581586937297 | -0.265815869372972 |
| 56 | 1.8 | 2.3401461214933 | -0.540146121493301 |
| 57 | 1.7 | 1.70809685099157 | -0.0080968509915719 |
| 58 | 1.7 | 1.44402336774195 | 0.255976632258050 |
| 59 | 1.8 | 2.23765360604774 | -0.437653606047742 |
| 60 | 2 | 2.13530721209548 | -0.135307212095485 |
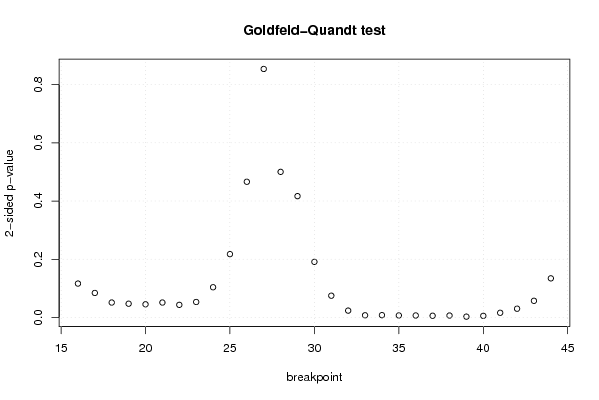
| Goldfeld-Quandt test for Heteroskedasticity | |||
| p-values | Alternative Hypothesis | ||
| breakpoint index | greater | 2-sided | less |
| 16 | 0.0582863136775296 | 0.116572627355059 | 0.94171368632247 |
| 17 | 0.0421536801067582 | 0.0843073602135165 | 0.957846319893242 |
| 18 | 0.0257098329130918 | 0.0514196658261836 | 0.974290167086908 |
| 19 | 0.0236956741249314 | 0.0473913482498628 | 0.976304325875069 |
| 20 | 0.0226911532318448 | 0.0453823064636895 | 0.977308846768155 |
| 21 | 0.0256932593873758 | 0.0513865187747517 | 0.974306740612624 |
| 22 | 0.0217445071547057 | 0.0434890143094113 | 0.978255492845294 |
| 23 | 0.0266546371420014 | 0.0533092742840027 | 0.973345362857999 |
| 24 | 0.0519606546763428 | 0.103921309352686 | 0.948039345323657 |
| 25 | 0.108844498128987 | 0.217688996257975 | 0.891155501871012 |
| 26 | 0.233068005095795 | 0.466136010191589 | 0.766931994904205 |
| 27 | 0.426767598545104 | 0.853535197090208 | 0.573232401454896 |
| 28 | 0.749899479244073 | 0.500201041511854 | 0.250100520755927 |
| 29 | 0.79162160299797 | 0.416756794004059 | 0.208378397002030 |
| 30 | 0.90441847076856 | 0.191163058462879 | 0.0955815292314396 |
| 31 | 0.962549376406415 | 0.0749012471871693 | 0.0374506235935846 |
| 32 | 0.988149866749536 | 0.0237002665009275 | 0.0118501332504638 |
| 33 | 0.996196241718742 | 0.00760751656251572 | 0.00380375828125786 |
| 34 | 0.995960042415628 | 0.00807991516874396 | 0.00403995758437198 |
| 35 | 0.996428461654079 | 0.00714307669184253 | 0.00357153834592126 |
| 36 | 0.996490716951788 | 0.007018566096423 | 0.0035092830482115 |
| 37 | 0.996969935624565 | 0.00606012875086924 | 0.00303006437543462 |
| 38 | 0.996632470527194 | 0.00673505894561256 | 0.00336752947280628 |
| 39 | 0.99851661940334 | 0.00296676119332109 | 0.00148338059666055 |
| 40 | 0.997132052279432 | 0.00573589544113611 | 0.00286794772056805 |
| 41 | 0.991887431358986 | 0.0162251372820272 | 0.0081125686410136 |
| 42 | 0.984875120781473 | 0.0302497584370533 | 0.0151248792185266 |
| 43 | 0.971319598702153 | 0.0573608025956931 | 0.0286804012978466 |
| 44 | 0.932759078023476 | 0.134481843953048 | 0.067240921976524 |
| Meta Analysis of Goldfeld-Quandt test for Heteroskedasticity | |||
| Description | # significant tests | % significant tests | OK/NOK |
| 1% type I error level | 8 | 0.275862068965517 | NOK |
| 5% type I error level | 14 | 0.482758620689655 | NOK |
| 10% type I error level | 20 | 0.689655172413793 | NOK |