| Multiple Linear Regression - Estimated Regression Equation |
| unempl[t] = + 11.788943645127 -0.0216975031746144proman[t] -0.0215687859575112`Y(t-1)`[t] -0.0199890687288202`Y(t-2)`[t] -0.0135066127680023`Y(t-3)`[t] -0.00627148987336246`Y(t-4)`[t] -0.104253154848955M1[t] + 0.117848899752461M2[t] -0.204196193128170M3[t] -0.162831247286175M4[t] -0.175727991703866M5[t] + 0.157906470768276M6[t] + 0.425400895722570M7[t] + 0.384400491946936M8[t] + 0.573141529469105M9[t] + 0.232224239562924M10[t] + 0.172740476997167M11[t] -0.0167897060162920t + e[t] |
| Multiple Linear Regression - Ordinary Least Squares | |||||
| Variable | Parameter | S.D. | T-STAT H0: parameter = 0 | 2-tail p-value | 1-tail p-value |
| (Intercept) | 11.788943645127 | 2.859838 | 4.1222 | 0.000196 | 9.8e-05 |
| proman | -0.0216975031746144 | 0.007946 | -2.7306 | 0.009531 | 0.004766 |
| `Y(t-1)` | -0.0215687859575112 | 0.009729 | -2.217 | 0.032679 | 0.01634 |
| `Y(t-2)` | -0.0199890687288202 | 0.009947 | -2.0096 | 0.051609 | 0.025805 |
| `Y(t-3)` | -0.0135066127680023 | 0.009366 | -1.4421 | 0.157472 | 0.078736 |
| `Y(t-4)` | -0.00627148987336246 | 0.007982 | -0.7857 | 0.436897 | 0.218449 |
| M1 | -0.104253154848955 | 0.20647 | -0.5049 | 0.616523 | 0.308261 |
| M2 | 0.117848899752461 | 0.203158 | 0.5801 | 0.565281 | 0.282641 |
| M3 | -0.204196193128170 | 0.270803 | -0.754 | 0.455472 | 0.227736 |
| M4 | -0.162831247286175 | 0.320756 | -0.5076 | 0.614634 | 0.307317 |
| M5 | -0.175727991703866 | 0.321887 | -0.5459 | 0.588305 | 0.294152 |
| M6 | 0.157906470768276 | 0.3462 | 0.4561 | 0.650904 | 0.325452 |
| M7 | 0.425400895722570 | 0.29807 | 1.4272 | 0.161694 | 0.080847 |
| M8 | 0.384400491946936 | 0.259912 | 1.479 | 0.147392 | 0.073696 |
| M9 | 0.573141529469105 | 0.284491 | 2.0146 | 0.051061 | 0.02553 |
| M10 | 0.232224239562924 | 0.255656 | 0.9083 | 0.369419 | 0.18471 |
| M11 | 0.172740476997167 | 0.237766 | 0.7265 | 0.471975 | 0.235987 |
| t | -0.0167897060162920 | 0.012274 | -1.3679 | 0.179365 | 0.089682 |
| Multiple Linear Regression - Regression Statistics | |
| Multiple R | 0.971181360953543 |
| R-squared | 0.943193235863577 |
| Adjusted R-squared | 0.917779683486755 |
| F-TEST (value) | 37.1137895984914 |
| F-TEST (DF numerator) | 17 |
| F-TEST (DF denominator) | 38 |
| p-value | 0 |
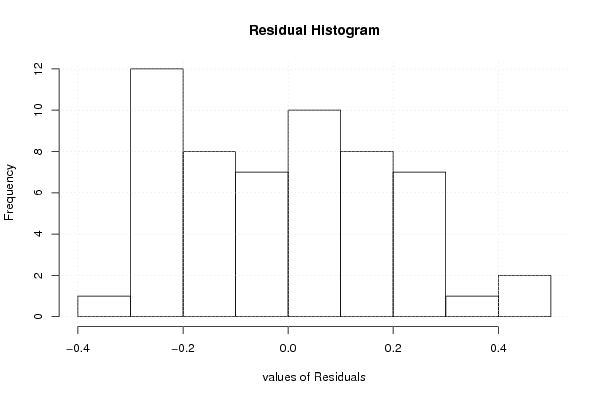
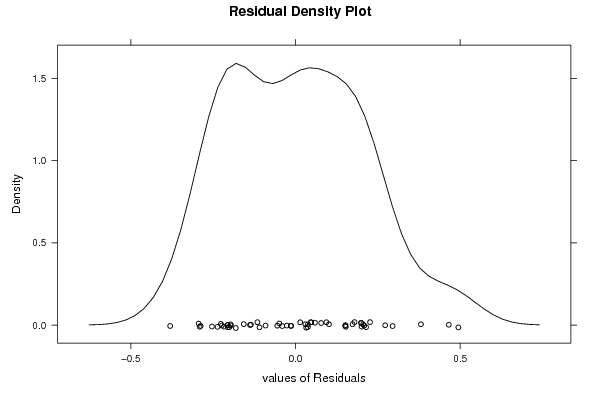
| Multiple Linear Regression - Residual Statistics | |
| Residual Standard Deviation | 0.245413358624484 |
| Sum Squared Residuals | 2.28865323047128 |
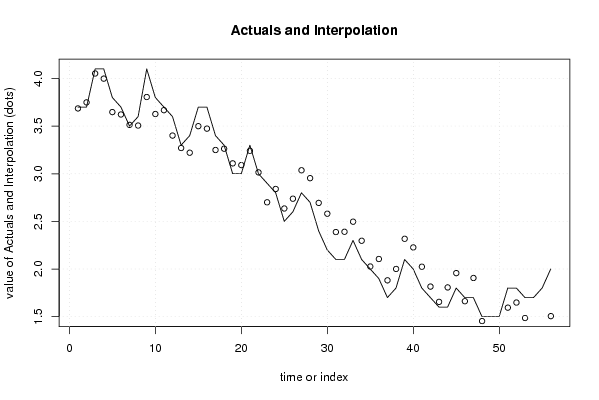
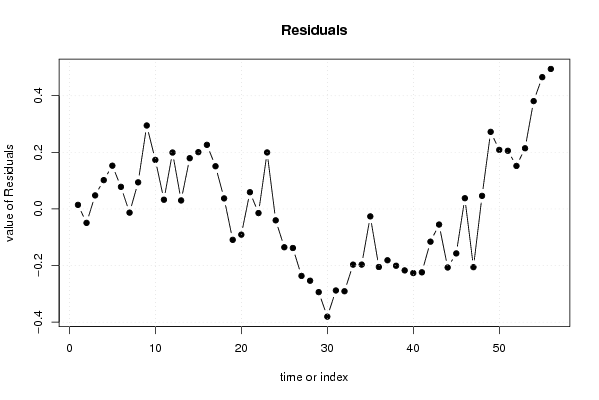
| Multiple Linear Regression - Actuals, Interpolation, and Residuals | |||
| Time or Index | Actuals | Interpolation Forecast | Residuals Prediction Error |
| 1 | 3.7 | 3.68564898573593 | 0.0143510142640743 |
| 2 | 3.7 | 3.74918738325750 | -0.0491873832575032 |
| 3 | 4.1 | 4.05218796842994 | 0.0478120315700565 |
| 4 | 4.1 | 3.9982343445441 | 0.101765655455901 |
| 5 | 3.8 | 3.6472148653606 | 0.152785134639397 |
| 6 | 3.7 | 3.62200172171155 | 0.0779982782884519 |
| 7 | 3.5 | 3.51312087637392 | -0.0131208763739243 |
| 8 | 3.6 | 3.50600319295788 | 0.0939968070421203 |
| 9 | 4.1 | 3.80520686673418 | 0.294793133265823 |
| 10 | 3.8 | 3.62669608456115 | 0.173303915438851 |
| 11 | 3.7 | 3.66742303902276 | 0.0325769609772449 |
| 12 | 3.6 | 3.40079307766267 | 0.199206922337333 |
| 13 | 3.3 | 3.26994117210814 | 0.0300588278918644 |
| 14 | 3.4 | 3.22077488585968 | 0.179225114140319 |
| 15 | 3.7 | 3.49941495847776 | 0.200585041522239 |
| 16 | 3.7 | 3.47360462171109 | 0.226395378288912 |
| 17 | 3.4 | 3.24922089554712 | 0.150779104452875 |
| 18 | 3.3 | 3.26273943475453 | 0.0372605652454654 |
| 19 | 3 | 3.10914133177869 | -0.109141331778691 |
| 20 | 3 | 3.09084021933498 | -0.0908402193349808 |
| 21 | 3.3 | 3.2408859697132 | 0.0591140302868022 |
| 22 | 3 | 3.01457364467385 | -0.0145736446738475 |
| 23 | 2.9 | 2.70041201206848 | 0.199587987931524 |
| 24 | 2.8 | 2.84026741631346 | -0.0402674163134567 |
| 25 | 2.5 | 2.63535915169381 | -0.135359151693805 |
| 26 | 2.6 | 2.73802746640404 | -0.138027466404044 |
| 27 | 2.8 | 3.03661198362256 | -0.236611983622564 |
| 28 | 2.7 | 2.95356128238874 | -0.253561282388737 |
| 29 | 2.4 | 2.69391050234463 | -0.293910502344634 |
| 30 | 2.2 | 2.58054056411447 | -0.380540564114472 |
| 31 | 2.1 | 2.38801357410492 | -0.288013574104923 |
| 32 | 2.1 | 2.3908417975242 | -0.290841797524198 |
| 33 | 2.3 | 2.49676500750494 | -0.196765007504937 |
| 34 | 2.1 | 2.296628239137 | -0.196628239136998 |
| 35 | 2 | 2.02638186984072 | -0.0263818698407166 |
| 36 | 1.9 | 2.10510415602002 | -0.205104156020022 |
| 37 | 1.7 | 1.88135029357376 | -0.181350293573761 |
| 38 | 1.8 | 2.00063196197474 | -0.20063196197474 |
| 39 | 2.1 | 2.31717607957364 | -0.217176079573639 |
| 40 | 2 | 2.22656494803053 | -0.22656494803053 |
| 41 | 1.8 | 2.02391981300625 | -0.223919813006249 |
| 42 | 1.7 | 1.81563961697356 | -0.115639616973563 |
| 43 | 1.6 | 1.65519250794873 | -0.0551925079487312 |
| 44 | 1.6 | 1.80684766033947 | -0.206847660339466 |
| 45 | 1.8 | 1.95714215604769 | -0.157142156047688 |
| 46 | 1.7 | 1.66210203162801 | 0.0378979683719942 |
| 47 | 1.7 | 1.90578307906805 | -0.205783079068052 |
| 48 | 1.5 | 1.45383535000385 | 0.0461646499961458 |
| 49 | 1.5 | 1.22770039688837 | 0.272299603111628 |
| 50 | 1.5 | 1.29137830250403 | 0.208621697495968 |
| 51 | 1.8 | 1.59460900989609 | 0.205390990103907 |
| 52 | 1.8 | 1.64803480332555 | 0.151965196674454 |
| 53 | 1.7 | 1.48573392374139 | 0.214266076258611 |
| 54 | 1.7 | 1.31907866244588 | 0.380921337554117 |
| 55 | 1.8 | 1.33453170979373 | 0.46546829020627 |
| 56 | 2 | 1.50546712984347 | 0.494532870156525 |
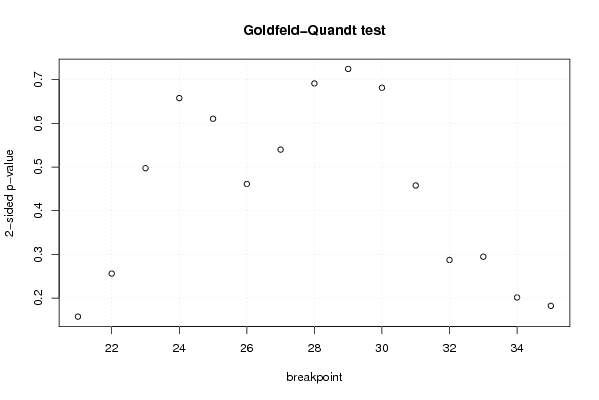
| Goldfeld-Quandt test for Heteroskedasticity | |||
| p-values | Alternative Hypothesis | ||
| breakpoint index | greater | 2-sided | less |
| 21 | 0.078695102605272 | 0.157390205210544 | 0.921304897394728 |
| 22 | 0.128019546563223 | 0.256039093126446 | 0.871980453436777 |
| 23 | 0.248644513675192 | 0.497289027350384 | 0.751355486324808 |
| 24 | 0.328870739328796 | 0.657741478657593 | 0.671129260671204 |
| 25 | 0.305273999480638 | 0.610547998961276 | 0.694726000519362 |
| 26 | 0.230622052063212 | 0.461244104126424 | 0.769377947936788 |
| 27 | 0.269930729890083 | 0.539861459780166 | 0.730069270109917 |
| 28 | 0.345651711422728 | 0.691303422845456 | 0.654348288577272 |
| 29 | 0.362275012132952 | 0.724550024265904 | 0.637724987867048 |
| 30 | 0.340769326470546 | 0.681538652941092 | 0.659230673529454 |
| 31 | 0.22885043625766 | 0.45770087251532 | 0.77114956374234 |
| 32 | 0.143605773282727 | 0.287211546565454 | 0.856394226717273 |
| 33 | 0.147357394365420 | 0.294714788730840 | 0.85264260563458 |
| 34 | 0.100677901838679 | 0.201355803677359 | 0.89932209816132 |
| 35 | 0.908923040947025 | 0.182153918105951 | 0.0910769590529753 |
| Meta Analysis of Goldfeld-Quandt test for Heteroskedasticity | |||
| Description | # significant tests | % significant tests | OK/NOK |
| 1% type I error level | 0 | 0 | OK |
| 5% type I error level | 0 | 0 | OK |
| 10% type I error level | 0 | 0 | OK |