| Multiple Linear Regression - Estimated Regression Equation |
| unempl[t] = + 6.95863385692966 -0.0172255661383461proman[t] -0.0105823825619524`Y(t-1)`[t] -0.0995119353824613M1[t] -0.120160349506485M2[t] -0.301406028532639M3[t] -0.459125195627519M4[t] -0.168063033871873M5[t] -0.390920463878512M6[t] -0.232041804640464M7[t] + 0.00860172150904735M8[t] + 0.0882542609004675M9[t] + 0.020269351968893M10[t] -0.257871356949066M11[t] -0.038796093240543t + e[t] |
| Multiple Linear Regression - Ordinary Least Squares | |||||
| Variable | Parameter | S.D. | T-STAT H0: parameter = 0 | 2-tail p-value | 1-tail p-value |
| (Intercept) | 6.95863385692966 | 1.085142 | 6.4126 | 0 | 0 |
| proman | -0.0172255661383461 | 0.006944 | -2.4806 | 0.017015 | 0.008507 |
| `Y(t-1)` | -0.0105823825619524 | 0.007009 | -1.5098 | 0.138236 | 0.069118 |
| M1 | -0.0995119353824613 | 0.189178 | -0.526 | 0.601515 | 0.300757 |
| M2 | -0.120160349506485 | 0.179817 | -0.6682 | 0.507474 | 0.253737 |
| M3 | -0.301406028532639 | 0.190444 | -1.5826 | 0.120664 | 0.060332 |
| M4 | -0.459125195627519 | 0.16797 | -2.7334 | 0.008995 | 0.004497 |
| M5 | -0.168063033871873 | 0.181497 | -0.926 | 0.359507 | 0.179753 |
| M6 | -0.390920463878512 | 0.277812 | -1.4071 | 0.166411 | 0.083206 |
| M7 | -0.232041804640464 | 0.219876 | -1.0553 | 0.297035 | 0.148517 |
| M8 | 0.00860172150904735 | 0.186889 | 0.046 | 0.963498 | 0.481749 |
| M9 | 0.0882542609004675 | 0.219093 | 0.4028 | 0.689034 | 0.344517 |
| M10 | 0.020269351968893 | 0.232632 | 0.0871 | 0.930963 | 0.465482 |
| M11 | -0.257871356949066 | 0.213585 | -1.2073 | 0.233748 | 0.116874 |
| t | -0.038796093240543 | 0.004869 | -7.9681 | 0 | 0 |
| Multiple Linear Regression - Regression Statistics | |
| Multiple R | 0.97138574167357 |
| R-squared | 0.94359025912671 |
| Adjusted R-squared | 0.925641705212483 |
| F-TEST (value) | 52.5719377525283 |
| F-TEST (DF numerator) | 14 |
| F-TEST (DF denominator) | 44 |
| p-value | 0 |
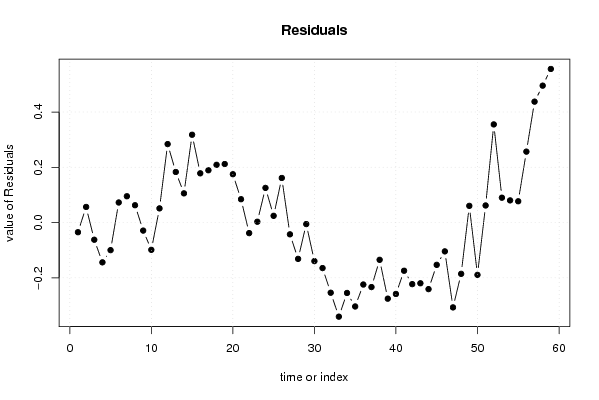
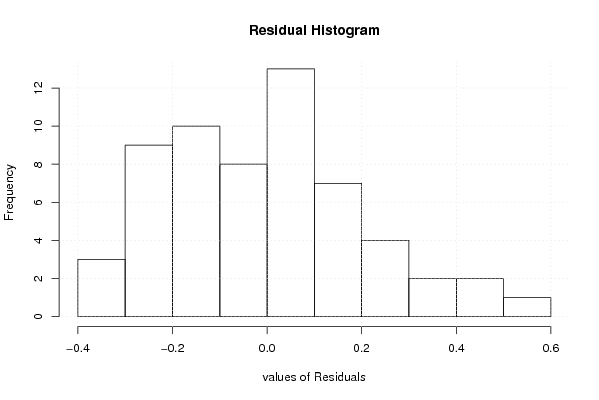
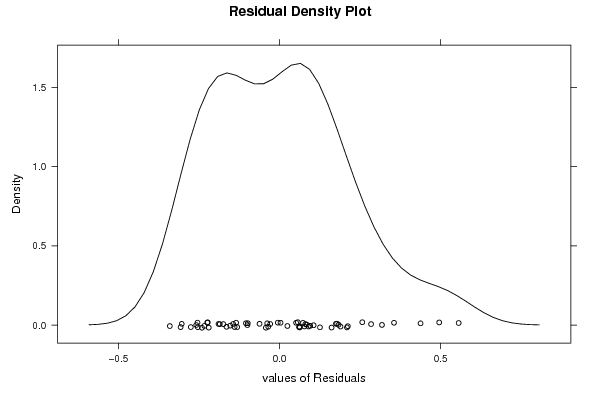
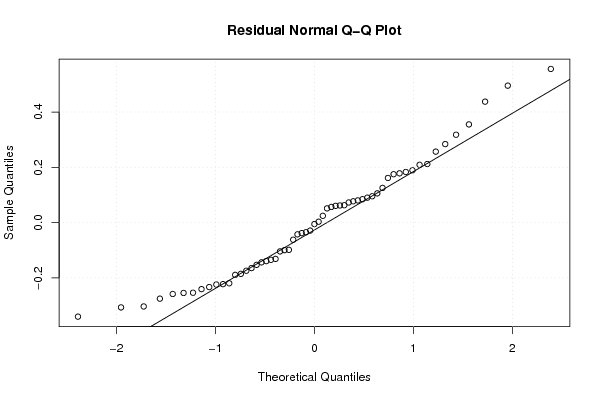
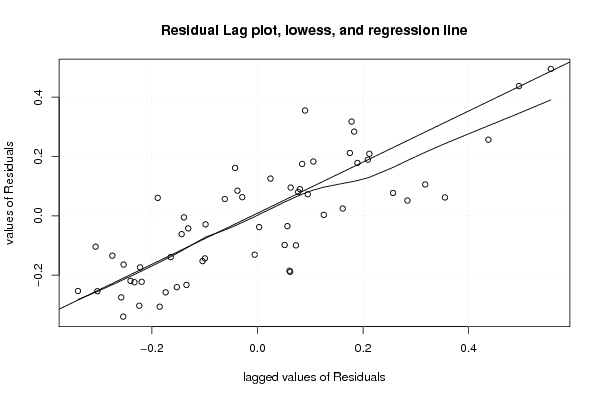
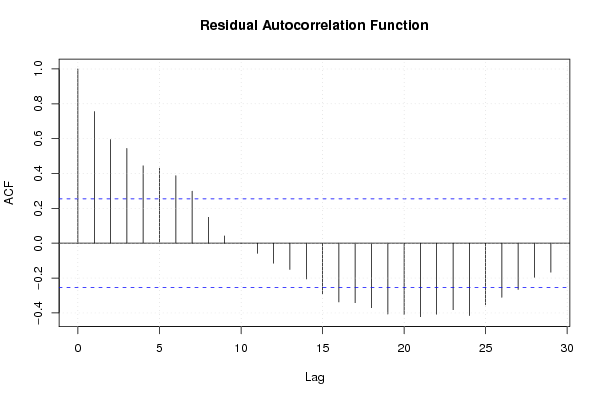
| Multiple Linear Regression - Residual Statistics | |
| Residual Standard Deviation | 0.240855151191974 |
| Sum Squared Residuals | 2.55249296965118 |
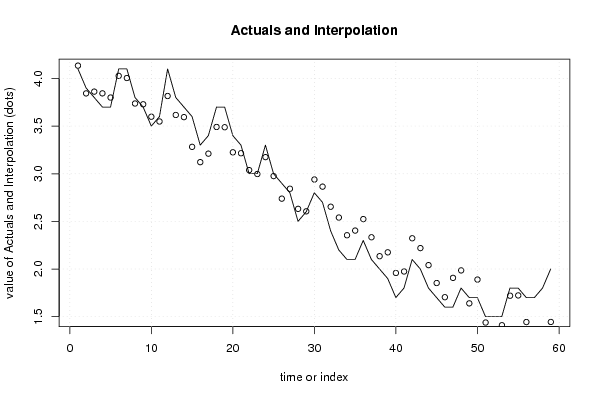
| Multiple Linear Regression - Actuals, Interpolation, and Residuals | |||
| Time or Index | Actuals | Interpolation Forecast | Residuals Prediction Error |
| 1 | 4.1 | 4.13486582365492 | -0.0348658236549180 |
| 2 | 3.9 | 3.84341697034086 | 0.0565830296591427 |
| 3 | 3.8 | 3.86198588494237 | -0.0619858849423663 |
| 4 | 3.7 | 3.84382554768483 | -0.143825547684825 |
| 5 | 3.7 | 3.79973506834118 | -0.0997350683411813 |
| 6 | 4.1 | 4.02729749192561 | 0.0727025080743886 |
| 7 | 4.1 | 4.00478878540701 | 0.0952112145929868 |
| 8 | 3.8 | 3.73720919512155 | 0.0627908048784517 |
| 9 | 3.7 | 3.72891595130969 | -0.0289159513096931 |
| 10 | 3.5 | 3.59851324230178 | -0.0985132423017812 |
| 11 | 3.6 | 3.54861942644792 | 0.0513805735520787 |
| 12 | 4.1 | 3.81601657270057 | 0.283983427299435 |
| 13 | 3.8 | 3.61689487771654 | 0.183105122283458 |
| 14 | 3.7 | 3.59426502202 | 0.105734977979997 |
| 15 | 3.6 | 3.28224007528229 | 0.317759924717706 |
| 16 | 3.3 | 3.12174488327901 | 0.178255116720993 |
| 17 | 3.4 | 3.21079209249730 | 0.189207907502704 |
| 18 | 3.7 | 3.49091922015321 | 0.209080779846791 |
| 19 | 3.7 | 3.48812312060376 | 0.211876879396236 |
| 20 | 3.4 | 3.22504688180216 | 0.174953118197836 |
| 21 | 3.3 | 3.21542500127503 | 0.0845749987249688 |
| 22 | 3 | 3.03811934379503 | -0.038119343795028 |
| 23 | 3 | 2.99688502217062 | 0.00311497782938105 |
| 24 | 3.3 | 3.17453899190411 | 0.125461008095887 |
| 25 | 3 | 2.97553407482078 | 0.0244659251792153 |
| 26 | 2.9 | 2.7385728139107 | 0.161427186089302 |
| 27 | 2.8 | 2.84248171940682 | -0.0424817194068233 |
| 28 | 2.5 | 2.63130161907925 | -0.131301619079252 |
| 29 | 2.6 | 2.60535793561312 | -0.00535793561312037 |
| 30 | 2.8 | 2.93940850317471 | -0.139408503174713 |
| 31 | 2.7 | 2.86455877988344 | -0.164558779883437 |
| 32 | 2.4 | 2.65374674757532 | -0.253746747575319 |
| 33 | 2.2 | 2.540284127999 | -0.340284127998998 |
| 34 | 2.1 | 2.35452917651079 | -0.254529176510794 |
| 35 | 2.1 | 2.40343869484287 | -0.303438694842869 |
| 36 | 2.3 | 2.52407806372007 | -0.224078063720071 |
| 37 | 2.1 | 2.33323855510830 | -0.233238555108303 |
| 38 | 2 | 2.13464426988033 | -0.134644269880329 |
| 39 | 1.9 | 2.17521250056313 | -0.275212500563130 |
| 40 | 1.7 | 1.95827047877683 | -0.258270478776832 |
| 41 | 1.8 | 1.97416223980062 | -0.174162239800621 |
| 42 | 2.1 | 2.32263422305039 | -0.22263422305039 |
| 43 | 2 | 2.21955927558012 | -0.219559275580121 |
| 44 | 1.8 | 2.04071133471789 | -0.240711334717888 |
| 45 | 1.7 | 1.85286167112732 | -0.152861671127318 |
| 46 | 1.6 | 1.70418502622745 | -0.104185026227446 |
| 47 | 1.6 | 1.90682610220827 | -0.306826102208274 |
| 48 | 1.8 | 1.98536637167525 | -0.185366371675251 |
| 49 | 1.7 | 1.63946666869945 | 0.0605333313005481 |
| 50 | 1.7 | 1.88910092384811 | -0.189100923848114 |
| 51 | 1.5 | 1.43807981980539 | 0.0619201801946135 |
| 52 | 1.5 | 1.14485747118008 | 0.355142528819916 |
| 53 | 1.5 | 1.40995266374778 | 0.0900473362522189 |
| 54 | 1.8 | 1.71974056169608 | 0.0802594383039226 |
| 55 | 1.8 | 1.72297003852566 | 0.0770299614743352 |
| 56 | 1.7 | 1.44328584078308 | 0.256714159216920 |
| 57 | 1.7 | 1.26251324828896 | 0.437486751711041 |
| 58 | 1.8 | 1.30465321116495 | 0.495346788835049 |
| 59 | 2 | 1.44423075433032 | 0.555769245669683 |
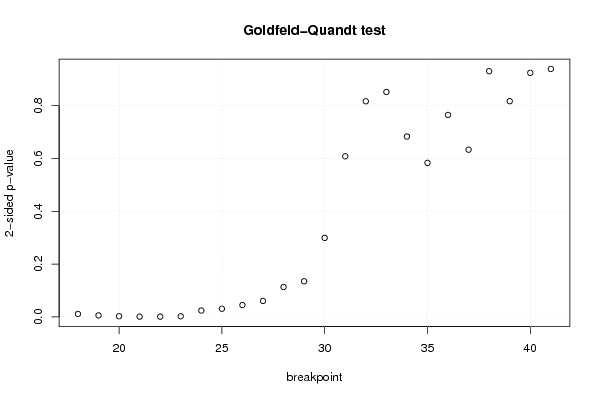
| Goldfeld-Quandt test for Heteroskedasticity | |||
| p-values | Alternative Hypothesis | ||
| breakpoint index | greater | 2-sided | less |
| 18 | 0.00551462655045917 | 0.0110292531009183 | 0.99448537344954 |
| 19 | 0.00290674892083762 | 0.00581349784167524 | 0.997093251079162 |
| 20 | 0.00122979081787151 | 0.00245958163574302 | 0.998770209182128 |
| 21 | 0.000435157711113495 | 0.00087031542222699 | 0.999564842288887 |
| 22 | 0.00045748068209976 | 0.00091496136419952 | 0.9995425193179 |
| 23 | 0.00109620120737725 | 0.00219240241475449 | 0.998903798792623 |
| 24 | 0.0119834232474734 | 0.0239668464949468 | 0.988016576752527 |
| 25 | 0.0153828749397672 | 0.0307657498795345 | 0.984617125060233 |
| 26 | 0.022435268723649 | 0.044870537447298 | 0.977564731276351 |
| 27 | 0.03018263007978 | 0.06036526015956 | 0.96981736992022 |
| 28 | 0.0566120746105059 | 0.113224149221012 | 0.943387925389494 |
| 29 | 0.0673630801090563 | 0.134726160218113 | 0.932636919890944 |
| 30 | 0.149617234575709 | 0.299234469151419 | 0.85038276542429 |
| 31 | 0.304091419584134 | 0.608182839168269 | 0.695908580415866 |
| 32 | 0.408336165112742 | 0.816672330225484 | 0.591663834887258 |
| 33 | 0.42602367896535 | 0.8520473579307 | 0.57397632103465 |
| 34 | 0.341566754947391 | 0.683133509894781 | 0.65843324505261 |
| 35 | 0.291748975538301 | 0.583497951076603 | 0.708251024461699 |
| 36 | 0.382481419687431 | 0.764962839374862 | 0.617518580312569 |
| 37 | 0.31667238181094 | 0.63334476362188 | 0.68332761818906 |
| 38 | 0.534634006119714 | 0.930731987760572 | 0.465365993880286 |
| 39 | 0.408522543835811 | 0.817045087671623 | 0.591477456164189 |
| 40 | 0.537781996160622 | 0.924436007678756 | 0.462218003839378 |
| 41 | 0.469571710004563 | 0.939143420009126 | 0.530428289995437 |
| Meta Analysis of Goldfeld-Quandt test for Heteroskedasticity | |||
| Description | # significant tests | % significant tests | OK/NOK |
| 1% type I error level | 5 | 0.208333333333333 | NOK |
| 5% type I error level | 9 | 0.375 | NOK |
| 10% type I error level | 10 | 0.416666666666667 | NOK |