| Multiple Linear Regression - Estimated Regression Equation |
| Werkl[t] = + 143.751260601764 -0.385392472173445Infl[t] + e[t] |
| Multiple Linear Regression - Ordinary Least Squares | |||||
| Variable | Parameter | S.D. | T-STAT H0: parameter = 0 | 2-tail p-value | 1-tail p-value |
| (Intercept) | 143.751260601764 | 2.15361 | 66.749 | 0 | 0 |
| Infl | -0.385392472173445 | 0.021134 | -18.2352 | 0 | 0 |
| Multiple Linear Regression - Regression Statistics | |
| Multiple R | 0.923941333344126 |
| R-squared | 0.853667587461722 |
| Adjusted R-squared | 0.851100352154033 |
| F-TEST (value) | 332.524091151642 |
| F-TEST (DF numerator) | 1 |
| F-TEST (DF denominator) | 57 |
| p-value | 0 |
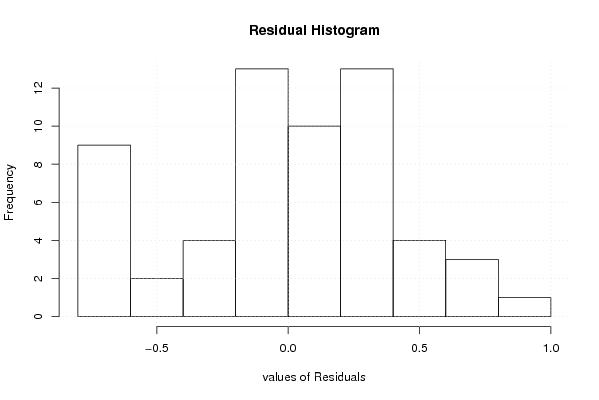
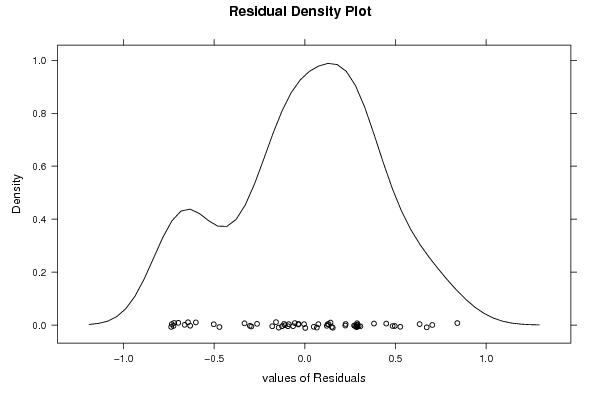
| Multiple Linear Regression - Residual Statistics | |
| Residual Standard Deviation | 0.406752304805825 |
| Sum Squared Residuals | 9.43050393549652 |
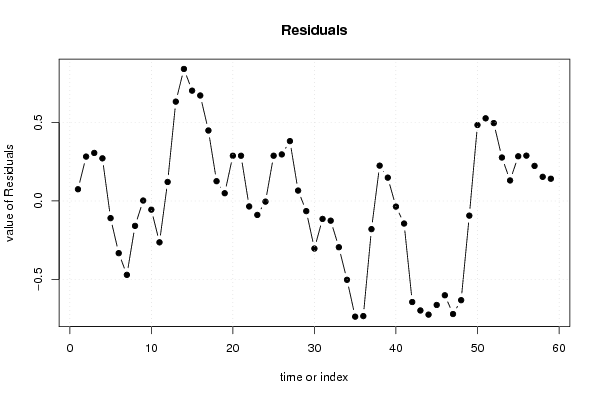
| Multiple Linear Regression - Actuals, Interpolation, and Residuals | |||
| Time or Index | Actuals | Interpolation Forecast | Residuals Prediction Error |
| 1 | 106.1 | 106.025191500705 | 0.0748084992951664 |
| 2 | 106 | 105.716877522966 | 0.283122477033612 |
| 3 | 105.9 | 105.593551931871 | 0.306448068129123 |
| 4 | 105.8 | 105.528035211601 | 0.271964788398600 |
| 5 | 105.7 | 105.809371716288 | -0.109371716288011 |
| 6 | 105.6 | 105.932697307384 | -0.332697307383524 |
| 7 | 105.4 | 105.871034511836 | -0.471034511835758 |
| 8 | 105.4 | 105.558866609375 | -0.158866609375272 |
| 9 | 105.5 | 105.497203813828 | 0.00279618617247816 |
| 10 | 105.6 | 105.655214727419 | -0.0552147274186441 |
| 11 | 105.7 | 105.963528705157 | -0.263528705157391 |
| 12 | 105.9 | 105.778540318514 | 0.121459681485867 |
| 13 | 106.1 | 105.466372416054 | 0.633627583946348 |
| 14 | 106 | 105.158058438315 | 0.841941561685108 |
| 15 | 105.8 | 105.096395642767 | 0.703604357232855 |
| 16 | 105.8 | 105.127227040541 | 0.67277295945898 |
| 17 | 105.7 | 105.250552631637 | 0.449447368363486 |
| 18 | 105.5 | 105.373878222732 | 0.126121777267978 |
| 19 | 105.3 | 105.250552631637 | 0.0494473683634804 |
| 20 | 105.2 | 104.911407256124 | 0.288592743876116 |
| 21 | 105.2 | 104.911407256124 | 0.288592743876116 |
| 22 | 105 | 105.034732847219 | -0.034732847219392 |
| 23 | 105.1 | 105.188889836089 | -0.0888898360887725 |
| 24 | 105.1 | 105.104103492211 | -0.00410349221061495 |
| 25 | 105.2 | 104.911407256124 | 0.288592743876116 |
| 26 | 104.9 | 104.603093278385 | 0.296906721614874 |
| 27 | 104.8 | 104.418104891742 | 0.381895108258121 |
| 28 | 104.5 | 104.433520590629 | 0.0664794093711834 |
| 29 | 104.5 | 104.564554031168 | -0.0645540311677838 |
| 30 | 104.4 | 104.703295321150 | -0.303295321150224 |
| 31 | 104.4 | 104.514453009785 | -0.114453009785232 |
| 32 | 104.2 | 104.325610698420 | -0.125610698420249 |
| 33 | 104.1 | 104.394981343411 | -0.294981343411474 |
| 34 | 103.9 | 104.402689192855 | -0.502689192854936 |
| 35 | 103.8 | 104.537576558116 | -0.737576558115648 |
| 36 | 103.9 | 104.633924676159 | -0.733924676159 |
| 37 | 104.2 | 104.379565644525 | -0.179565644524531 |
| 38 | 104.1 | 103.874701505977 | 0.225298494022674 |
| 39 | 103.8 | 103.651173872117 | 0.148826127883275 |
| 40 | 103.6 | 103.635758173230 | -0.0357581732297879 |
| 41 | 103.7 | 103.843870108203 | -0.143870108203442 |
| 42 | 103.5 | 104.144476236499 | -0.644476236498733 |
| 43 | 103.4 | 104.098229139838 | -0.698229139837912 |
| 44 | 103.1 | 103.824600484595 | -0.72460048459478 |
| 45 | 103.1 | 103.762937689047 | -0.662937689047024 |
| 46 | 103.1 | 103.701274893499 | -0.601274893499274 |
| 47 | 103.2 | 103.920948602638 | -0.720948602638132 |
| 48 | 103.3 | 103.932510376803 | -0.632510376803342 |
| 49 | 103.5 | 103.593365001291 | -0.0933650012907036 |
| 50 | 103.6 | 103.115478335796 | 0.484521664204361 |
| 51 | 103.5 | 102.972883121091 | 0.527116878908543 |
| 52 | 103.3 | 102.803310433335 | 0.496689566664855 |
| 53 | 103.2 | 102.922782099709 | 0.277217900291092 |
| 54 | 103.1 | 102.969029196370 | 0.130970803630268 |
| 55 | 103.2 | 102.915074250265 | 0.284925749734560 |
| 56 | 103 | 102.710816240014 | 0.289183759986483 |
| 57 | 103 | 102.776332960283 | 0.223667039716997 |
| 58 | 103.1 | 102.945905648039 | 0.154094351960676 |
| 59 | 103.4 | 103.258073550500 | 0.141926449500196 |
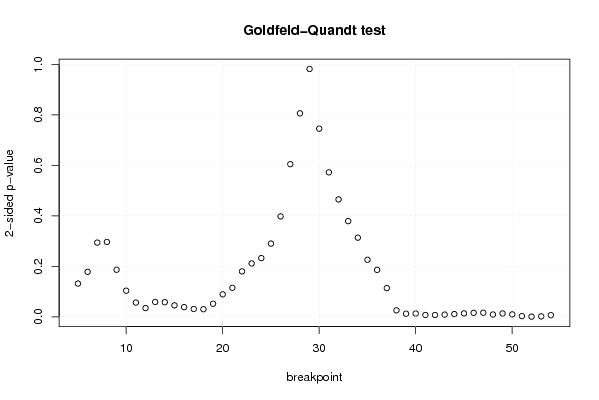
| Goldfeld-Quandt test for Heteroskedasticity | |||
| p-values | Alternative Hypothesis | ||
| breakpoint index | greater | 2-sided | less |
| 5 | 0.0657043912428305 | 0.131408782485661 | 0.93429560875717 |
| 6 | 0.0889452644193762 | 0.177890528838752 | 0.911054735580624 |
| 7 | 0.146880293943616 | 0.293760587887231 | 0.853119706056384 |
| 8 | 0.148187746719477 | 0.296375493438954 | 0.851812253280523 |
| 9 | 0.0930978776883454 | 0.186195755376691 | 0.906902122311655 |
| 10 | 0.0516104980930191 | 0.103220996186038 | 0.94838950190698 |
| 11 | 0.0281123004990112 | 0.0562246009980225 | 0.971887699500989 |
| 12 | 0.0171703474984610 | 0.0343406949969221 | 0.98282965250154 |
| 13 | 0.0292404902431319 | 0.0584809804862639 | 0.970759509756868 |
| 14 | 0.0287512808073009 | 0.0575025616146019 | 0.9712487191927 |
| 15 | 0.0225811866843572 | 0.0451623733687144 | 0.977418813315643 |
| 16 | 0.0190712956310427 | 0.0381425912620854 | 0.980928704368957 |
| 17 | 0.0152832464742233 | 0.0305664929484466 | 0.984716753525777 |
| 18 | 0.0149056651691330 | 0.0298113303382660 | 0.985094334830867 |
| 19 | 0.0257394261855862 | 0.0514788523711724 | 0.974260573814414 |
| 20 | 0.0444340514632611 | 0.0888681029265221 | 0.955565948536739 |
| 21 | 0.0573603970954792 | 0.114720794190958 | 0.94263960290452 |
| 22 | 0.0898840696953125 | 0.179768139390625 | 0.910115930304688 |
| 23 | 0.105568827119153 | 0.211137654238306 | 0.894431172880847 |
| 24 | 0.11615861273552 | 0.23231722547104 | 0.88384138726448 |
| 25 | 0.144949624674705 | 0.289899249349410 | 0.855050375325295 |
| 26 | 0.198840540687441 | 0.397681081374882 | 0.801159459312559 |
| 27 | 0.302267900601939 | 0.604535801203878 | 0.697732099398061 |
| 28 | 0.403034447267361 | 0.806068894534723 | 0.596965552732639 |
| 29 | 0.509027696449989 | 0.981944607100021 | 0.490972303550011 |
| 30 | 0.627318536595967 | 0.745362926808065 | 0.372681463404033 |
| 31 | 0.713853251737293 | 0.572293496525414 | 0.286146748262707 |
| 32 | 0.76748647062328 | 0.465027058753439 | 0.232513529376720 |
| 33 | 0.81051409478064 | 0.378971810438721 | 0.189485905219361 |
| 34 | 0.843316677384611 | 0.313366645230777 | 0.156683322615389 |
| 35 | 0.887095563361121 | 0.225808873277758 | 0.112904436638879 |
| 36 | 0.90705627451035 | 0.185887450979298 | 0.0929437254896492 |
| 37 | 0.943297341635426 | 0.113405316729147 | 0.0567026583645735 |
| 38 | 0.987305741602801 | 0.0253885167943971 | 0.0126942583971985 |
| 39 | 0.994011958559478 | 0.0119760828810436 | 0.00598804144052182 |
| 40 | 0.993655045565876 | 0.0126899088682481 | 0.00634495443412403 |
| 41 | 0.996477870532076 | 0.0070442589358482 | 0.0035221294679241 |
| 42 | 0.99655303222439 | 0.00689393555122 | 0.00344696777561 |
| 43 | 0.995721062587448 | 0.00855787482510414 | 0.00427893741255207 |
| 44 | 0.994720803254726 | 0.0105583934905484 | 0.00527919674527419 |
| 45 | 0.993357916272452 | 0.0132841674550970 | 0.00664208372754852 |
| 46 | 0.992279352634354 | 0.0154412947312926 | 0.0077206473656463 |
| 47 | 0.99204320675749 | 0.0159135864850223 | 0.00795679324251115 |
| 48 | 0.99552753917083 | 0.00894492165834016 | 0.00447246082917008 |
| 49 | 0.993550561497449 | 0.0128988770051021 | 0.00644943850255107 |
| 50 | 0.995299009159069 | 0.00940198168186223 | 0.00470099084093112 |
| 51 | 0.998682338430718 | 0.00263532313856470 | 0.00131766156928235 |
| 52 | 0.999814899465275 | 0.000370201069450011 | 0.000185100534725006 |
| 53 | 0.999235784661285 | 0.00152843067742943 | 0.000764215338714716 |
| 54 | 0.996915276331129 | 0.00616944733774284 | 0.00308472366887142 |
| Meta Analysis of Goldfeld-Quandt test for Heteroskedasticity | |||
| Description | # significant tests | % significant tests | OK/NOK |
| 1% type I error level | 9 | 0.18 | NOK |
| 5% type I error level | 22 | 0.44 | NOK |
| 10% type I error level | 27 | 0.54 | NOK |