| Multiple Linear Regression - Estimated Regression Equation |
| Y[t] = + 10728.97875 -749.17375X[t] + e[t] |
| Multiple Linear Regression - Ordinary Least Squares | |||||
| Variable | Parameter | S.D. | T-STAT H0: parameter = 0 | 2-tail p-value | 1-tail p-value |
| (Intercept) | 10728.97875 | 345.726271 | 31.0332 | 0 | 0 |
| X | -749.17375 | 773.067444 | -0.9691 | 0.336523 | 0.168262 |
| Multiple Linear Regression - Regression Statistics | |
| Multiple R | 0.126230200070555 |
| R-squared | 0.0159340634098522 |
| Adjusted R-squared | -0.00103259066928807 |
| F-TEST (value) | 0.939139993986336 |
| F-TEST (DF numerator) | 1 |
| F-TEST (DF denominator) | 58 |
| p-value | 0.336523066256252 |
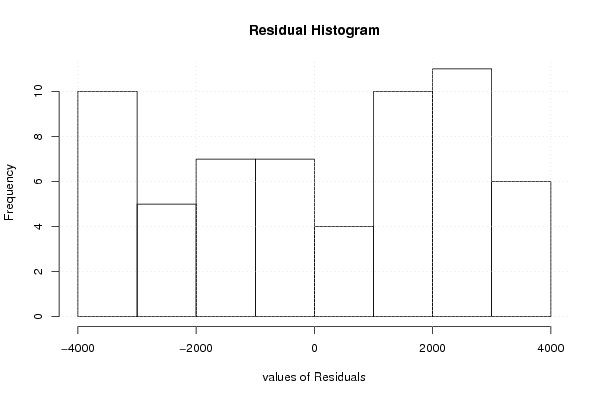
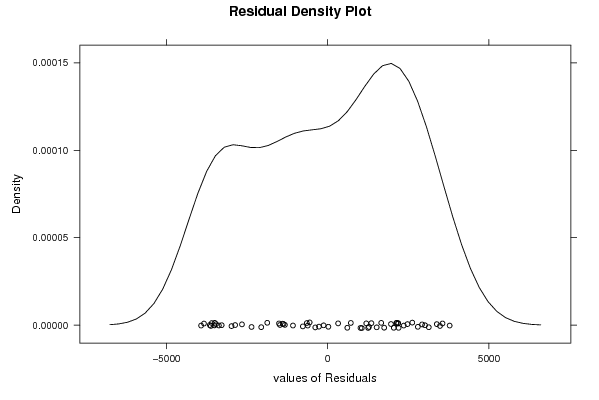
| Multiple Linear Regression - Residual Statistics | |
| Residual Standard Deviation | 2395.2618673994 |
| Sum Squared Residuals | 332762205.978225 |
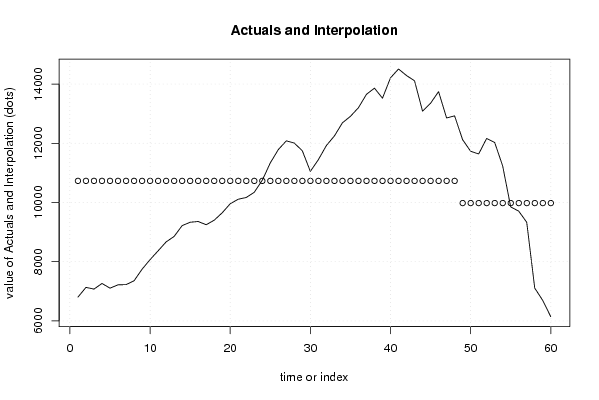
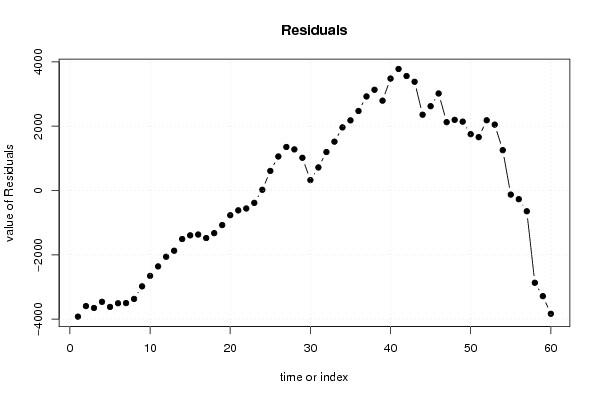
| Multiple Linear Regression - Actuals, Interpolation, and Residuals | |||
| Time or Index | Actuals | Interpolation Forecast | Residuals Prediction Error |
| 1 | 6802.96 | 10728.97875 | -3926.01875000001 |
| 2 | 7132.68 | 10728.97875 | -3596.29875 |
| 3 | 7073.29 | 10728.97875 | -3655.68875 |
| 4 | 7264.5 | 10728.97875 | -3464.47875 |
| 5 | 7105.33 | 10728.97875 | -3623.64875 |
| 6 | 7218.71 | 10728.97875 | -3510.26875 |
| 7 | 7225.72 | 10728.97875 | -3503.25875 |
| 8 | 7354.25 | 10728.97875 | -3374.72875 |
| 9 | 7745.46 | 10728.97875 | -2983.51875 |
| 10 | 8070.26 | 10728.97875 | -2658.71875 |
| 11 | 8366.33 | 10728.97875 | -2362.64875 |
| 12 | 8667.51 | 10728.97875 | -2061.46875 |
| 13 | 8854.34 | 10728.97875 | -1874.63875 |
| 14 | 9218.1 | 10728.97875 | -1510.87875 |
| 15 | 9332.9 | 10728.97875 | -1396.07875 |
| 16 | 9358.31 | 10728.97875 | -1370.66875 |
| 17 | 9248.66 | 10728.97875 | -1480.31875 |
| 18 | 9401.2 | 10728.97875 | -1327.77875 |
| 19 | 9652.04 | 10728.97875 | -1076.93875 |
| 20 | 9957.38 | 10728.97875 | -771.59875 |
| 21 | 10110.63 | 10728.97875 | -618.34875 |
| 22 | 10169.26 | 10728.97875 | -559.71875 |
| 23 | 10343.78 | 10728.97875 | -385.198749999999 |
| 24 | 10750.21 | 10728.97875 | 21.2312499999993 |
| 25 | 11337.5 | 10728.97875 | 608.52125 |
| 26 | 11786.96 | 10728.97875 | 1057.98125 |
| 27 | 12083.04 | 10728.97875 | 1354.06125 |
| 28 | 12007.74 | 10728.97875 | 1278.76125 |
| 29 | 11745.93 | 10728.97875 | 1016.95125 |
| 30 | 11051.51 | 10728.97875 | 322.531250000000 |
| 31 | 11445.9 | 10728.97875 | 716.92125 |
| 32 | 11924.88 | 10728.97875 | 1195.90125 |
| 33 | 12247.63 | 10728.97875 | 1518.65125 |
| 34 | 12690.91 | 10728.97875 | 1961.93125 |
| 35 | 12910.7 | 10728.97875 | 2181.72125 |
| 36 | 13202.12 | 10728.97875 | 2473.14125 |
| 37 | 13654.67 | 10728.97875 | 2925.69125 |
| 38 | 13862.82 | 10728.97875 | 3133.84125 |
| 39 | 13523.93 | 10728.97875 | 2794.95125 |
| 40 | 14211.17 | 10728.97875 | 3482.19125 |
| 41 | 14510.35 | 10728.97875 | 3781.37125 |
| 42 | 14289.23 | 10728.97875 | 3560.25125 |
| 43 | 14111.82 | 10728.97875 | 3382.84125 |
| 44 | 13086.59 | 10728.97875 | 2357.61125 |
| 45 | 13351.54 | 10728.97875 | 2622.56125 |
| 46 | 13747.69 | 10728.97875 | 3018.71125 |
| 47 | 12855.61 | 10728.97875 | 2126.63125 |
| 48 | 12926.93 | 10728.97875 | 2197.95125 |
| 49 | 12121.95 | 9979.805 | 2142.145 |
| 50 | 11731.65 | 9979.805 | 1751.845 |
| 51 | 11639.51 | 9979.805 | 1659.705 |
| 52 | 12163.78 | 9979.805 | 2183.975 |
| 53 | 12029.53 | 9979.805 | 2049.725 |
| 54 | 11234.18 | 9979.805 | 1254.375 |
| 55 | 9852.13 | 9979.805 | -127.675000000001 |
| 56 | 9709.04 | 9979.805 | -270.764999999999 |
| 57 | 9332.75 | 9979.805 | -647.055 |
| 58 | 7108.6 | 9979.805 | -2871.205 |
| 59 | 6691.49 | 9979.805 | -3288.315 |
| 60 | 6143.05 | 9979.805 | -3836.755 |
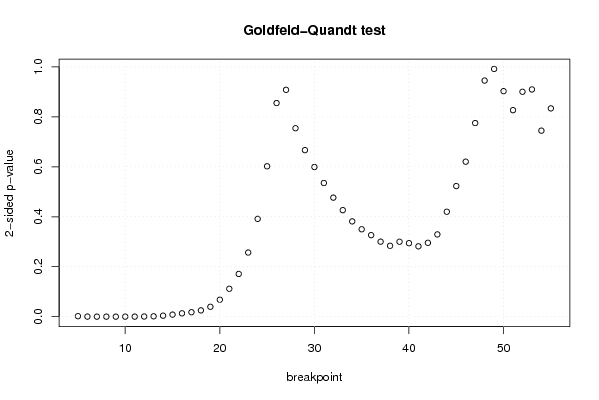
| Goldfeld-Quandt test for Heteroskedasticity | |||
| p-values | Alternative Hypothesis | ||
| breakpoint index | greater | 2-sided | less |
| 5 | 0.000960587826757566 | 0.00192117565351513 | 0.999039412173242 |
| 6 | 0.000101864659875499 | 0.000203729319750998 | 0.999898135340125 |
| 7 | 1.09268826022719e-05 | 2.18537652045439e-05 | 0.999989073117398 |
| 8 | 2.27519999069831e-06 | 4.55039998139663e-06 | 0.99999772480001 |
| 9 | 6.4677403364485e-06 | 1.2935480672897e-05 | 0.999993532259664 |
| 10 | 2.56278152715428e-05 | 5.12556305430856e-05 | 0.999974372184729 |
| 11 | 8.90142765236393e-05 | 0.000178028553047279 | 0.999910985723476 |
| 12 | 0.000289220754086141 | 0.000578441508172283 | 0.999710779245914 |
| 13 | 0.000696414428953668 | 0.00139282885790734 | 0.999303585571046 |
| 14 | 0.00197328030622231 | 0.00394656061244462 | 0.998026719693778 |
| 15 | 0.00408799934897584 | 0.00817599869795168 | 0.995912000651024 |
| 16 | 0.00666998816818566 | 0.0133399763363713 | 0.993330011831814 |
| 17 | 0.00886639639222972 | 0.0177327927844594 | 0.99113360360777 |
| 18 | 0.0125717859091867 | 0.0251435718183734 | 0.987428214090813 |
| 19 | 0.019766749055624 | 0.039533498111248 | 0.980233250944376 |
| 20 | 0.0339033236501712 | 0.0678066473003425 | 0.966096676349829 |
| 21 | 0.0558062259298641 | 0.111612451859728 | 0.944193774070136 |
| 22 | 0.085499764121259 | 0.170999528242518 | 0.914500235878741 |
| 23 | 0.128380969620708 | 0.256761939241416 | 0.871619030379292 |
| 24 | 0.195815395336483 | 0.391630790672965 | 0.804184604663517 |
| 25 | 0.301110145926606 | 0.602220291853211 | 0.698889854073395 |
| 26 | 0.42772991388162 | 0.85545982776324 | 0.57227008611838 |
| 27 | 0.545829480886135 | 0.90834103822773 | 0.454170519113865 |
| 28 | 0.622677697930094 | 0.754644604139812 | 0.377322302069906 |
| 29 | 0.666539047120085 | 0.66692190575983 | 0.333460952879915 |
| 30 | 0.700354580536259 | 0.599290838927482 | 0.299645419463741 |
| 31 | 0.732383532438455 | 0.535232935123091 | 0.267616467561545 |
| 32 | 0.761695356833441 | 0.476609286333118 | 0.238304643166559 |
| 33 | 0.786736917937634 | 0.426526164124732 | 0.213263082062366 |
| 34 | 0.809164786410899 | 0.381670427178202 | 0.190835213589101 |
| 35 | 0.82501441455207 | 0.349971170895862 | 0.174985585447931 |
| 36 | 0.83683781179663 | 0.32632437640674 | 0.16316218820337 |
| 37 | 0.849820926228696 | 0.300358147542607 | 0.150179073771304 |
| 38 | 0.858127115715658 | 0.283745768568684 | 0.141872884284342 |
| 39 | 0.849950668409654 | 0.300098663180691 | 0.150049331590346 |
| 40 | 0.852864459559895 | 0.29427108088021 | 0.147135540440105 |
| 41 | 0.859141491115126 | 0.281717017769749 | 0.140858508884874 |
| 42 | 0.852139951008959 | 0.295720097982082 | 0.147860048991041 |
| 43 | 0.835292630504561 | 0.329414738990878 | 0.164707369495439 |
| 44 | 0.789913753846099 | 0.420172492307802 | 0.210086246153901 |
| 45 | 0.738533116879262 | 0.522933766241477 | 0.261466883120738 |
| 46 | 0.689700000686946 | 0.620599998626107 | 0.310299999313054 |
| 47 | 0.612328247231261 | 0.775343505537478 | 0.387671752768739 |
| 48 | 0.527239655565247 | 0.945520688869507 | 0.472760344434753 |
| 49 | 0.496008307959512 | 0.992016615919025 | 0.503991692040488 |
| 50 | 0.45152850079882 | 0.90305700159764 | 0.54847149920118 |
| 51 | 0.413508365455171 | 0.827016730910342 | 0.586491634544829 |
| 52 | 0.450320487177232 | 0.900640974354464 | 0.549679512822768 |
| 53 | 0.545024455405107 | 0.909951089189787 | 0.454975544594893 |
| 54 | 0.62758139581144 | 0.74483720837712 | 0.37241860418856 |
| 55 | 0.582992188906159 | 0.834015622187683 | 0.417007811093841 |
| Meta Analysis of Goldfeld-Quandt test for Heteroskedasticity | |||
| Description | # significant tests | % significant tests | OK/NOK |
| 1% type I error level | 11 | 0.215686274509804 | NOK |
| 5% type I error level | 15 | 0.294117647058824 | NOK |
| 10% type I error level | 16 | 0.313725490196078 | NOK |