| Multiple Linear Regression - Estimated Regression Equation |
| Y[t] = + 2.04749099291583 + 0.268190282588306X[t] + 0.411430607756518M1[t] + 0.479213827669841M2[t] + 0.330330380916495M3[t] + 0.527218052971105M4[t] + 0.295001272884426M5[t] + 0.146117826131079M6[t] -0.218701515485238M7[t] -0.184251628905251M8[t] -0.249801742325264M9[t] -0.122233106493307M10[t] -0.221116553246654M11[t] -0.00111655324665354t + e[t] |
| Multiple Linear Regression - Ordinary Least Squares | |||||
| Variable | Parameter | S.D. | T-STAT H0: parameter = 0 | 2-tail p-value | 1-tail p-value |
| (Intercept) | 2.04749099291583 | 0.437171 | 4.6835 | 1.9e-05 | 9e-06 |
| X | 0.268190282588306 | 0.020264 | 13.2348 | 0 | 0 |
| M1 | 0.411430607756518 | 0.188097 | 2.1873 | 0.032988 | 0.016494 |
| M2 | 0.479213827669841 | 0.188015 | 2.5488 | 0.01363 | 0.006815 |
| M3 | 0.330330380916495 | 0.187956 | 1.7575 | 0.084399 | 0.042199 |
| M4 | 0.527218052971105 | 0.190227 | 2.7715 | 0.007598 | 0.003799 |
| M5 | 0.295001272884426 | 0.190082 | 1.552 | 0.126406 | 0.063203 |
| M6 | 0.146117826131079 | 0.18996 | 0.7692 | 0.445063 | 0.222531 |
| M7 | -0.218701515485238 | 0.191431 | -1.1425 | 0.258214 | 0.129107 |
| M8 | -0.184251628905251 | 0.191606 | -0.9616 | 0.34045 | 0.170225 |
| M9 | -0.249801742325264 | 0.191801 | -1.3024 | 0.198208 | 0.099104 |
| M10 | -0.122233106493307 | 0.196255 | -0.6228 | 0.535972 | 0.267986 |
| M11 | -0.221116553246654 | 0.196224 | -1.1269 | 0.264694 | 0.132347 |
| t | -0.00111655324665354 | 0.002033 | -0.5491 | 0.58517 | 0.292585 |
| Multiple Linear Regression - Regression Statistics | |
| Multiple R | 0.907202855997636 |
| R-squared | 0.823017021930267 |
| Adjusted R-squared | 0.78118468165924 |
| F-TEST (value) | 19.6741807079885 |
| F-TEST (DF numerator) | 13 |
| F-TEST (DF denominator) | 55 |
| p-value | 4.44089209850063e-16 |
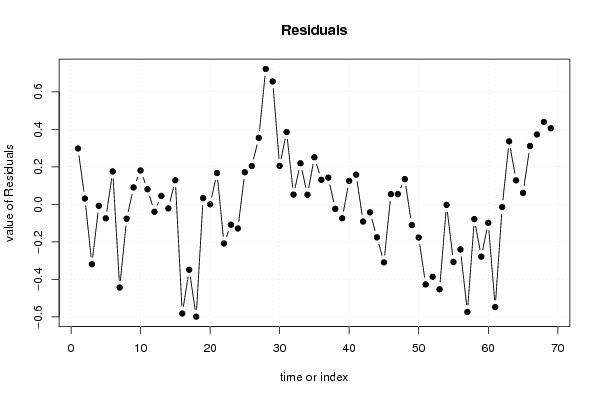
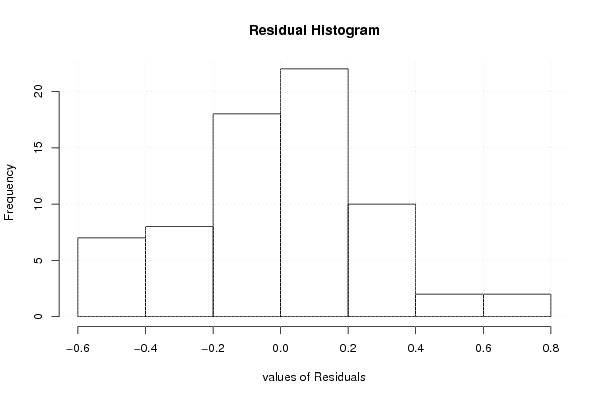
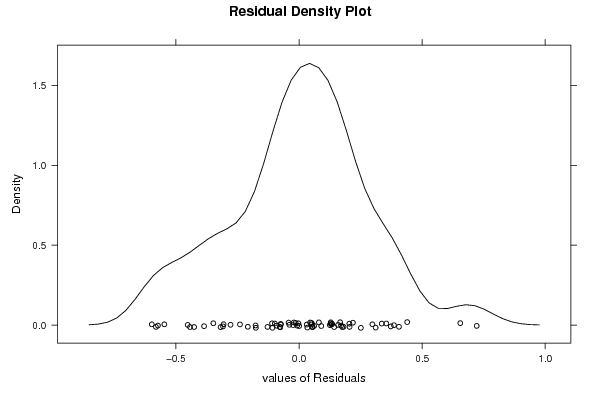
| Multiple Linear Regression - Residual Statistics | |
| Residual Standard Deviation | 0.310240057275317 |
| Sum Squared Residuals | 5.29368912260055 |
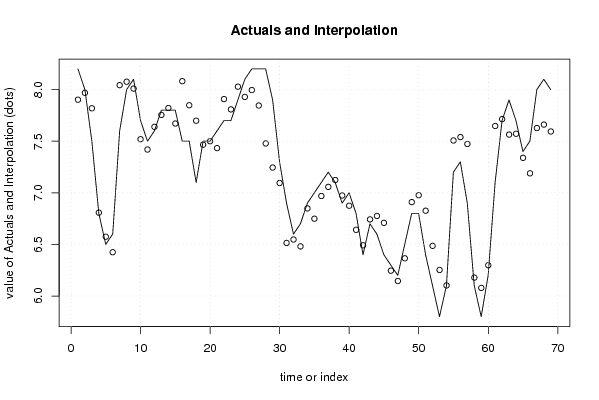
| Multiple Linear Regression - Actuals, Interpolation, and Residuals | |||
| Time or Index | Actuals | Interpolation Forecast | Residuals Prediction Error |
| 1 | 8.2 | 7.90206778396833 | 0.297932216031667 |
| 2 | 8 | 7.96873445063499 | 0.0312655493650105 |
| 3 | 7.5 | 7.81873445063499 | -0.318734450634988 |
| 4 | 6.8 | 6.80764929779557 | -0.0076492977955676 |
| 5 | 6.5 | 6.57431596446223 | -0.074315964462234 |
| 6 | 6.6 | 6.42431596446223 | 0.175684035537766 |
| 7 | 7.6 | 8.04298816075273 | -0.442988160752732 |
| 8 | 8 | 8.07632149408606 | -0.0763214940860637 |
| 9 | 8.1 | 8.0096548274194 | 0.090345172580602 |
| 10 | 7.7 | 7.5192692600516 | 0.180730739948404 |
| 11 | 7.5 | 7.4192692600516 | 0.080730739948404 |
| 12 | 7.6 | 7.6392692600516 | -0.0392692600515964 |
| 13 | 7.8 | 7.75457400371432 | 0.0454259962856753 |
| 14 | 7.8 | 7.821240670381 | -0.0212406703809934 |
| 15 | 7.8 | 7.671240670381 | 0.128759329619006 |
| 16 | 7.5 | 8.0815640152596 | -0.581564015259596 |
| 17 | 7.5 | 7.84823068192626 | -0.348230681926263 |
| 18 | 7.1 | 7.69823068192626 | -0.598230681926263 |
| 19 | 7.5 | 7.46638992835745 | 0.0336100716425545 |
| 20 | 7.5 | 7.49972326169078 | 0.000276738309221314 |
| 21 | 7.6 | 7.43305659502411 | 0.166943404975887 |
| 22 | 7.7 | 7.90815604497421 | -0.208156044974213 |
| 23 | 7.7 | 7.80815604497421 | -0.108156044974213 |
| 24 | 7.9 | 8.02815604497421 | -0.128156044974213 |
| 25 | 8.1 | 7.9289085625663 | 0.171091437433703 |
| 26 | 8.2 | 7.99557522923296 | 0.204424770767034 |
| 27 | 8.2 | 7.84557522923297 | 0.354424770767033 |
| 28 | 8.2 | 7.47814675460548 | 0.721853245394521 |
| 29 | 7.9 | 7.24481342127214 | 0.655186578727855 |
| 30 | 7.3 | 7.09481342127215 | 0.205186578727855 |
| 31 | 6.9 | 6.51432530033853 | 0.38567469966147 |
| 32 | 6.6 | 6.54765863367186 | 0.0523413663281359 |
| 33 | 6.7 | 6.4809919670052 | 0.219008032994803 |
| 34 | 6.9 | 6.84881530391998 | 0.0511846960800246 |
| 35 | 7 | 6.74881530391998 | 0.251184696080024 |
| 36 | 7.1 | 6.96881530391998 | 0.131184696080024 |
| 37 | 7.2 | 7.05730101932387 | 0.142698980676127 |
| 38 | 7.1 | 7.12396768599054 | -0.0239676859905426 |
| 39 | 6.9 | 6.97396768599054 | -0.0739676859905425 |
| 40 | 7 | 6.87472949395136 | 0.125270506048638 |
| 41 | 6.8 | 6.64139616061803 | 0.158603839381971 |
| 42 | 6.4 | 6.49139616061803 | -0.0913961606180284 |
| 43 | 6.7 | 6.74229791570816 | -0.0422979157081632 |
| 44 | 6.6 | 6.7756312490415 | -0.175631249041497 |
| 45 | 6.4 | 6.70896458237483 | -0.30896458237483 |
| 46 | 6.3 | 6.24539804326586 | 0.0546019567341405 |
| 47 | 6.2 | 6.14539804326586 | 0.0546019567341408 |
| 48 | 6.5 | 6.36539804326586 | 0.134601956734141 |
| 49 | 6.8 | 6.90980723906988 | -0.109807239069878 |
| 50 | 6.8 | 6.97647390573655 | -0.176473905736547 |
| 51 | 6.4 | 6.82647390573655 | -0.426473905736547 |
| 52 | 6.1 | 6.48586445936789 | -0.385864459367891 |
| 53 | 5.8 | 6.25253112603456 | -0.452531126034558 |
| 54 | 6.1 | 6.10253112603456 | -0.00253112603455805 |
| 55 | 7.2 | 7.50665109625441 | -0.306651096254409 |
| 56 | 7.3 | 7.53998442958774 | -0.239984429587743 |
| 57 | 6.9 | 7.47331776292108 | -0.573317762921076 |
| 58 | 6.1 | 6.17836134778836 | -0.078361347788356 |
| 59 | 5.8 | 6.07836134778836 | -0.278361347788356 |
| 60 | 6.2 | 6.29836134778836 | -0.0983613477883555 |
| 61 | 7.1 | 7.6473413913573 | -0.547341391357294 |
| 62 | 7.7 | 7.71400805802396 | -0.0140080580239620 |
| 63 | 7.9 | 7.56400805802396 | 0.335991941976038 |
| 64 | 7.7 | 7.5720459790201 | 0.127954020979896 |
| 65 | 7.4 | 7.33871264568677 | 0.0612873543132294 |
| 66 | 7.5 | 7.18871264568677 | 0.311287354313229 |
| 67 | 8 | 7.62734759858872 | 0.37265240141128 |
| 68 | 8.1 | 7.66068093192205 | 0.439319068077946 |
| 69 | 8 | 7.59401426525539 | 0.405985734744613 |
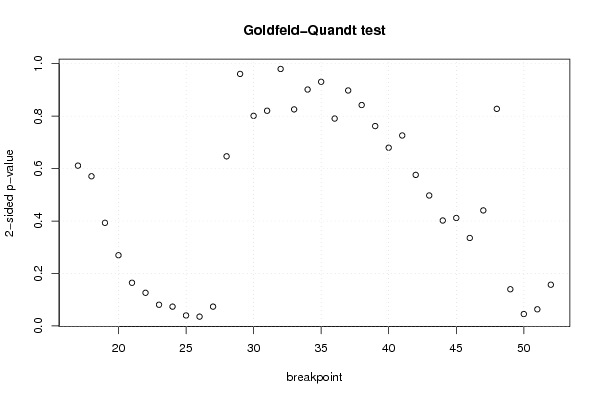
| Goldfeld-Quandt test for Heteroskedasticity | |||
| p-values | Alternative Hypothesis | ||
| breakpoint index | greater | 2-sided | less |
| 17 | 0.305651909359663 | 0.611303818719325 | 0.694348090640337 |
| 18 | 0.285408614474545 | 0.57081722894909 | 0.714591385525455 |
| 19 | 0.196663468667016 | 0.393326937334032 | 0.803336531332984 |
| 20 | 0.134872220342560 | 0.269744440685121 | 0.86512777965744 |
| 21 | 0.0823713153555791 | 0.164742630711158 | 0.917628684644421 |
| 22 | 0.0632743176738866 | 0.126548635347773 | 0.936725682326113 |
| 23 | 0.0404894933426185 | 0.080978986685237 | 0.959510506657381 |
| 24 | 0.0368807862346054 | 0.0737615724692108 | 0.963119213765395 |
| 25 | 0.0200908020362554 | 0.0401816040725108 | 0.979909197963745 |
| 26 | 0.0178054538491912 | 0.0356109076983824 | 0.982194546150809 |
| 27 | 0.0368834626309870 | 0.0737669252619739 | 0.963116537369013 |
| 28 | 0.323475186732641 | 0.646950373465282 | 0.676524813267359 |
| 29 | 0.480515489330913 | 0.961030978661826 | 0.519484510669087 |
| 30 | 0.400650605108223 | 0.801301210216447 | 0.599349394891777 |
| 31 | 0.410322799071948 | 0.820645598143895 | 0.589677200928052 |
| 32 | 0.490017595792198 | 0.980035191584397 | 0.509982404207802 |
| 33 | 0.58706547759951 | 0.82586904480098 | 0.41293452240049 |
| 34 | 0.549204253333558 | 0.901591493332884 | 0.450795746666442 |
| 35 | 0.465520067703294 | 0.931040135406588 | 0.534479932296706 |
| 36 | 0.39544417462478 | 0.79088834924956 | 0.60455582537522 |
| 37 | 0.448993115349759 | 0.897986230699518 | 0.551006884650241 |
| 38 | 0.421193563349232 | 0.842387126698465 | 0.578806436650768 |
| 39 | 0.381112174079618 | 0.762224348159235 | 0.618887825920382 |
| 40 | 0.339885155492924 | 0.679770310985847 | 0.660114844507076 |
| 41 | 0.363190560865736 | 0.726381121731472 | 0.636809439134264 |
| 42 | 0.288060719222251 | 0.576121438444503 | 0.711939280777749 |
| 43 | 0.248779095865478 | 0.497558191730957 | 0.751220904134522 |
| 44 | 0.201107818780894 | 0.402215637561787 | 0.798892181219106 |
| 45 | 0.205892211832077 | 0.411784423664154 | 0.794107788167923 |
| 46 | 0.167827612696237 | 0.335655225392473 | 0.832172387303763 |
| 47 | 0.220355045126863 | 0.440710090253725 | 0.779644954873137 |
| 48 | 0.413941572716728 | 0.827883145433457 | 0.586058427283272 |
| 49 | 0.92996030966023 | 0.140079380679541 | 0.0700396903397707 |
| 50 | 0.977214743273346 | 0.045570513453308 | 0.022785256726654 |
| 51 | 0.968171731443027 | 0.0636565371139457 | 0.0318282685569728 |
| 52 | 0.92134207467432 | 0.157315850651359 | 0.0786579253256795 |
| Meta Analysis of Goldfeld-Quandt test for Heteroskedasticity | |||
| Description | # significant tests | % significant tests | OK/NOK |
| 1% type I error level | 0 | 0 | OK |
| 5% type I error level | 3 | 0.0833333333333333 | NOK |
| 10% type I error level | 7 | 0.194444444444444 | NOK |