| Multiple Linear Regression - Estimated Regression Equation |
| Y[t] = + 0.0438440963714834 + 0.091191104880777X[t] + 1.10242811026445`Y(t-1)`[t] -0.486419144668766`Y(t-2)`[t] -0.188441799569958`Y(t-3)`[t] + 0.342364461886313`Y(t-4)`[t] -0.189339107617867M1[t] -0.248582058103744M2[t] + 0.00334296687708956M3[t] -0.53509934530751M4[t] -0.353680066285393M5[t] -0.188467403632904M6[t] -0.259620844371123M7[t] -0.0467034678873066M8[t] -0.0132662230148949M9[t] -0.113338664654363M10[t] -0.0864416950016453M11[t] + 0.00188780839695149t + e[t] |
| Multiple Linear Regression - Ordinary Least Squares | |||||
| Variable | Parameter | S.D. | T-STAT H0: parameter = 0 | 2-tail p-value | 1-tail p-value |
| (Intercept) | 0.0438440963714834 | 0.401943 | 0.1091 | 0.913603 | 0.456802 |
| X | 0.091191104880777 | 0.0215 | 4.2415 | 0.000103 | 5.2e-05 |
| `Y(t-1)` | 1.10242811026445 | 0.156443 | 7.0468 | 0 | 0 |
| `Y(t-2)` | -0.486419144668766 | 0.229403 | -2.1204 | 0.039281 | 0.019641 |
| `Y(t-3)` | -0.188441799569958 | 0.221128 | -0.8522 | 0.398434 | 0.199217 |
| `Y(t-4)` | 0.342364461886313 | 0.118904 | 2.8793 | 0.005982 | 0.002991 |
| M1 | -0.189339107617867 | 0.106143 | -1.7838 | 0.080911 | 0.040456 |
| M2 | -0.248582058103744 | 0.11166 | -2.2262 | 0.030829 | 0.015415 |
| M3 | 0.00334296687708956 | 0.14087 | 0.0237 | 0.981168 | 0.490584 |
| M4 | -0.53509934530751 | 0.126357 | -4.2348 | 0.000106 | 5.3e-05 |
| M5 | -0.353680066285393 | 0.143484 | -2.4649 | 0.017413 | 0.008707 |
| M6 | -0.188467403632904 | 0.119133 | -1.582 | 0.120358 | 0.060179 |
| M7 | -0.259620844371123 | 0.121117 | -2.1436 | 0.037274 | 0.018637 |
| M8 | -0.0467034678873066 | 0.121031 | -0.3859 | 0.701326 | 0.350663 |
| M9 | -0.0132662230148949 | 0.117847 | -0.1126 | 0.91085 | 0.455425 |
| M10 | -0.113338664654363 | 0.117581 | -0.9639 | 0.340021 | 0.170011 |
| M11 | -0.0864416950016453 | 0.111035 | -0.7785 | 0.440173 | 0.220086 |
| t | 0.00188780839695149 | 0.001441 | 1.3099 | 0.19659 | 0.098295 |
| Multiple Linear Regression - Regression Statistics | |
| Multiple R | 0.97556268486673 |
| R-squared | 0.951722552104384 |
| Adjusted R-squared | 0.934260496482565 |
| F-TEST (value) | 54.5023205008703 |
| F-TEST (DF numerator) | 17 |
| F-TEST (DF denominator) | 47 |
| p-value | 0 |
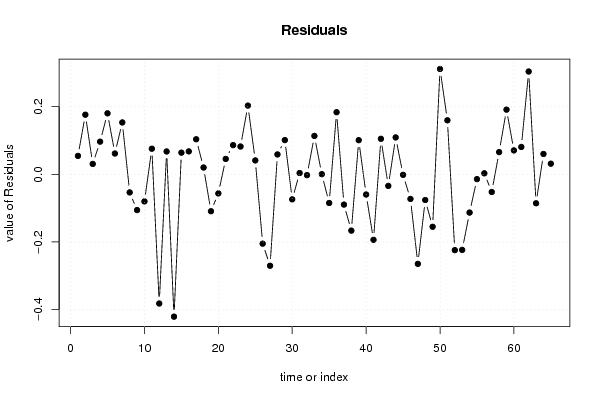
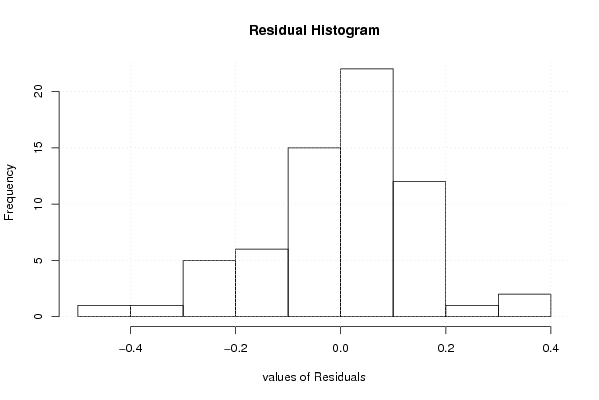
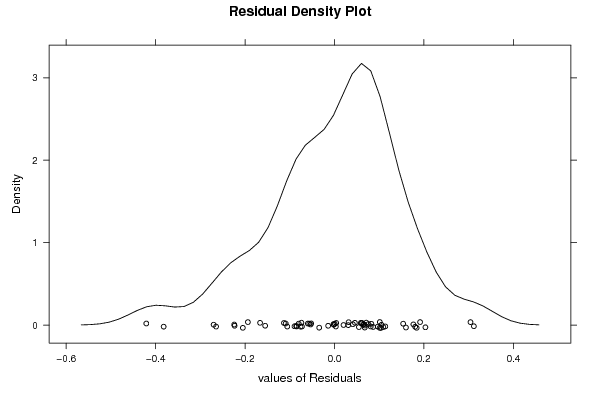
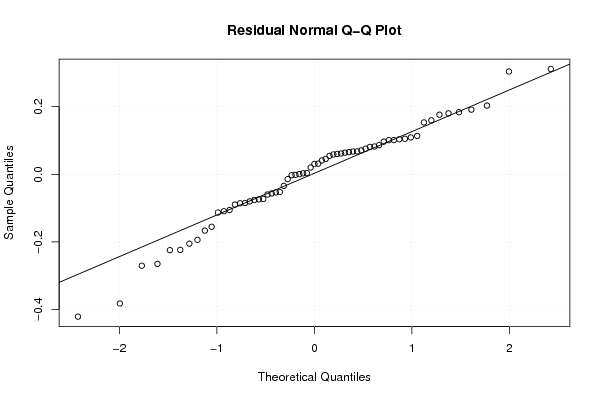
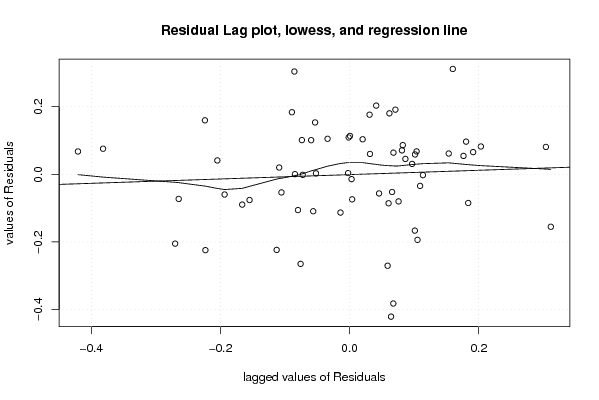
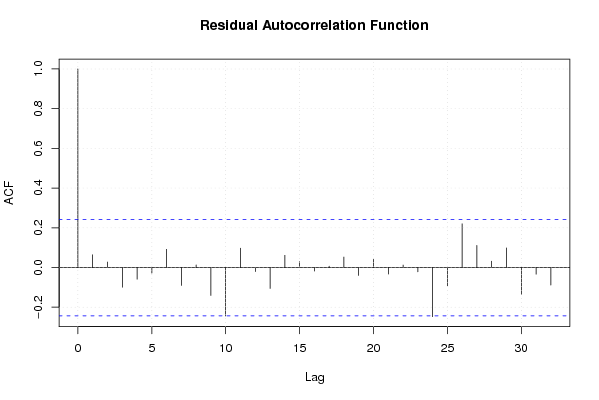
| Multiple Linear Regression - Residual Statistics | |
| Residual Standard Deviation | 0.169643885658411 |
| Sum Squared Residuals | 1.35261525324035 |
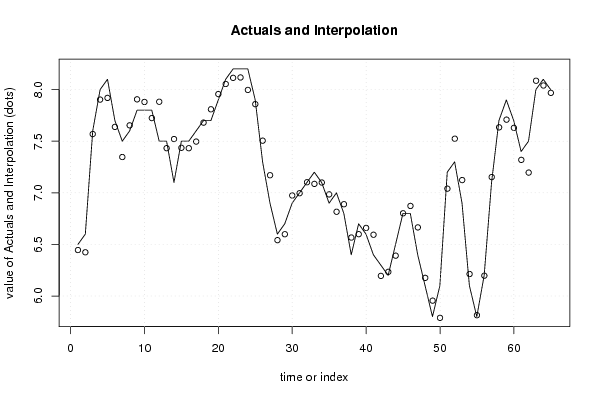
| Multiple Linear Regression - Actuals, Interpolation, and Residuals | |||
| Time or Index | Actuals | Interpolation Forecast | Residuals Prediction Error |
| 1 | 6.5 | 6.44543400995743 | 0.054565990042572 |
| 2 | 6.6 | 6.42359184346504 | 0.176408156534963 |
| 3 | 7.6 | 7.56911443614346 | 0.03088556385654 |
| 4 | 8 | 7.90322354470395 | 0.0967764552960502 |
| 5 | 8.1 | 7.91952921303714 | 0.180470786962857 |
| 6 | 7.7 | 7.63835994263841 | 0.061640057361593 |
| 7 | 7.5 | 7.34646889378281 | 0.153531106217185 |
| 8 | 7.6 | 7.65345771927573 | -0.0534577192757292 |
| 9 | 7.8 | 7.90561236315305 | -0.105612363153049 |
| 10 | 7.8 | 7.88001401265601 | -0.0800140126560126 |
| 11 | 7.8 | 7.72419788943767 | 0.0758021105623299 |
| 12 | 7.5 | 7.88202836301553 | -0.382028363015528 |
| 13 | 7.5 | 7.43232152309254 | 0.0676784769074585 |
| 14 | 7.1 | 7.52089212440425 | -0.420892124404246 |
| 15 | 7.5 | 7.43586180598763 | 0.0641381940123728 |
| 16 | 7.5 | 7.43213686560737 | 0.0678631343926295 |
| 17 | 7.6 | 7.49625301498692 | 0.103746985013084 |
| 18 | 7.7 | 7.6798222288253 | 0.0201777711746977 |
| 19 | 7.7 | 7.80910327779813 | -0.109103277798129 |
| 20 | 7.9 | 7.95642236825502 | -0.0564223682550237 |
| 21 | 8.1 | 8.05436221053544 | 0.0456377894645638 |
| 22 | 8.2 | 8.11361581660069 | 0.0863841833993132 |
| 23 | 8.2 | 8.11767121682906 | 0.0823287831709441 |
| 24 | 8.2 | 7.99664201797441 | 0.203357982025585 |
| 25 | 7.9 | 7.85881943117377 | 0.0411805688262343 |
| 26 | 7.3 | 7.50497230219414 | -0.204972302194139 |
| 27 | 6.9 | 7.17030112890926 | -0.270301128909262 |
| 28 | 6.6 | 6.54115940768808 | 0.0588405923119164 |
| 29 | 6.7 | 6.5986614610714 | 0.101338538928596 |
| 30 | 6.9 | 6.97396052363681 | -0.0739605236368146 |
| 31 | 7 | 6.99612535399802 | 0.00387464600197746 |
| 32 | 7.1 | 7.10233600244859 | -0.00233600244859139 |
| 33 | 7.2 | 7.08638071269523 | 0.113619287304771 |
| 34 | 7.1 | 7.09942568843255 | 0.000574311567450727 |
| 35 | 6.9 | 6.98471800722053 | -0.0847180072205312 |
| 36 | 7 | 6.8162858538959 | 0.183714146104103 |
| 37 | 6.8 | 6.8894418207808 | -0.089441820780806 |
| 38 | 6.4 | 6.56641105589747 | -0.166411055897474 |
| 39 | 6.7 | 6.59895894299476 | 0.101041057005237 |
| 40 | 6.6 | 6.65962533625658 | -0.0596253362565784 |
| 41 | 6.4 | 6.59366769669929 | -0.193667696699291 |
| 42 | 6.3 | 6.1948257047995 | 0.105174295200500 |
| 43 | 6.2 | 6.23415460888843 | -0.0341546088884289 |
| 44 | 6.5 | 6.39081081093499 | 0.109189189065011 |
| 45 | 6.8 | 6.80147305177069 | -0.00147305177068493 |
| 46 | 6.8 | 6.87269884197524 | -0.0726988419752369 |
| 47 | 6.4 | 6.66478889056466 | -0.264788890564657 |
| 48 | 6.1 | 6.17594173879083 | -0.075941738790829 |
| 49 | 5.8 | 5.95503900292398 | -0.155039002923979 |
| 50 | 6.1 | 5.78825789098433 | 0.311742109015668 |
| 51 | 7.2 | 7.04017294817167 | 0.159827051828328 |
| 52 | 7.3 | 7.52418682357938 | -0.224186823579379 |
| 53 | 6.9 | 7.12343378445237 | -0.223433784452367 |
| 54 | 6.1 | 6.21303160009998 | -0.113031600099976 |
| 55 | 5.8 | 5.81414786553260 | -0.0141478655326054 |
| 56 | 6.2 | 6.19697309908567 | 0.00302690091433393 |
| 57 | 7.1 | 7.1521716618456 | -0.0521716618456001 |
| 58 | 7.7 | 7.63424564033551 | 0.0657543596644856 |
| 59 | 7.9 | 7.70862399594809 | 0.191376004051914 |
| 60 | 7.7 | 7.62910202632333 | 0.0708979736766684 |
| 61 | 7.4 | 7.31894421207148 | 0.0810557879285197 |
| 62 | 7.5 | 7.19587478305477 | 0.304125216945229 |
| 63 | 8 | 8.08559073779321 | -0.085590737793215 |
| 64 | 8.1 | 8.03966802216464 | 0.0603319778353614 |
| 65 | 8 | 7.96845482975288 | 0.0315451702471214 |
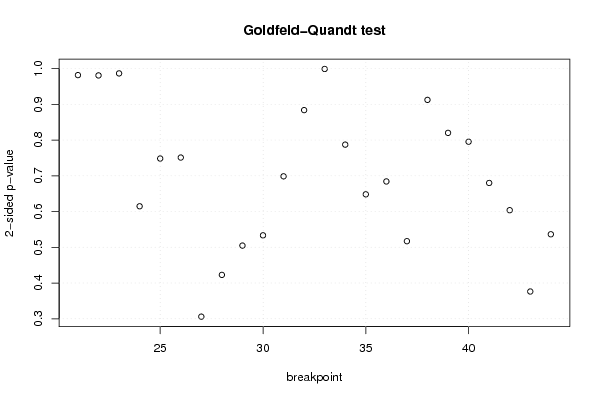
| Goldfeld-Quandt test for Heteroskedasticity | |||
| p-values | Alternative Hypothesis | ||
| breakpoint index | greater | 2-sided | less |
| 21 | 0.490944935436138 | 0.981889870872276 | 0.509055064563862 |
| 22 | 0.509505400477714 | 0.980989199044572 | 0.490494599522286 |
| 23 | 0.493335967556963 | 0.986671935113927 | 0.506664032443037 |
| 24 | 0.692589578058237 | 0.614820843883527 | 0.307410421941763 |
| 25 | 0.625794627741329 | 0.748410744517342 | 0.374205372258671 |
| 26 | 0.624404583975842 | 0.751190832048316 | 0.375595416024158 |
| 27 | 0.847031689645292 | 0.305936620709416 | 0.152968310354708 |
| 28 | 0.78859442162503 | 0.422811156749941 | 0.211405578374970 |
| 29 | 0.747594051165028 | 0.504811897669944 | 0.252405948834972 |
| 30 | 0.733265991823236 | 0.533468016353527 | 0.266734008176764 |
| 31 | 0.650679780070438 | 0.698640439859124 | 0.349320219929562 |
| 32 | 0.558044015797843 | 0.883911968404315 | 0.441955984202157 |
| 33 | 0.499548354871492 | 0.999096709742983 | 0.500451645128508 |
| 34 | 0.3936543173521 | 0.7873086347042 | 0.6063456826479 |
| 35 | 0.324127149796449 | 0.648254299592897 | 0.675872850203551 |
| 36 | 0.342152412759102 | 0.684304825518204 | 0.657847587240898 |
| 37 | 0.258559134787522 | 0.517118269575043 | 0.741440865212478 |
| 38 | 0.456274835979265 | 0.91254967195853 | 0.543725164020735 |
| 39 | 0.410085051087323 | 0.820170102174646 | 0.589914948912677 |
| 40 | 0.397733682675406 | 0.795467365350813 | 0.602266317324593 |
| 41 | 0.340030359454569 | 0.680060718909138 | 0.659969640545431 |
| 42 | 0.301927583419318 | 0.603855166838636 | 0.698072416580682 |
| 43 | 0.188143087253542 | 0.376286174507084 | 0.811856912746458 |
| 44 | 0.268237520017897 | 0.536475040035794 | 0.731762479982103 |
| Meta Analysis of Goldfeld-Quandt test for Heteroskedasticity | |||
| Description | # significant tests | % significant tests | OK/NOK |
| 1% type I error level | 0 | 0 | OK |
| 5% type I error level | 0 | 0 | OK |
| 10% type I error level | 0 | 0 | OK |