Free Statistics

of Irreproducible Research!

Author's title

Author*The author of this computation has been verified*
R Software Modulerwasp_multipleregression.wasp
Title produced by softwareMultiple Regression
Date of computationThu, 19 Nov 2009 15:00:07 -0700
Cite this page as followsStatistical Computations at FreeStatistics.org, Office for Research Development and Education, URL https://freestatistics.org/blog/index.php?v=date/2009/Nov/19/t12586680957gz823xab7bmv65.htm/, Retrieved Sat, 20 Apr 2024 15:38:22 +0000
Statistical Computations at FreeStatistics.org, Office for Research Development and Education, URL https://freestatistics.org/blog/index.php?pk=57969, Retrieved Sat, 20 Apr 2024 15:38:22 +0000
QR Codes:

Original text written by user:
IsPrivate?No (this computation is public)
User-defined keywords
Estimated Impact225
Family? (F = Feedback message, R = changed R code, M = changed R Module, P = changed Parameters, D = changed Data)
-     [Multiple Regression] [Q1 The Seatbeltlaw] [2007-11-14 19:27:43] [8cd6641b921d30ebe00b648d1481bba0]
- RMPD  [Multiple Regression] [Seatbelt] [2009-11-12 13:54:52] [b98453cac15ba1066b407e146608df68]
-    D    [Multiple Regression] [model 1] [2009-11-17 14:36:29] [ed603017d2bee8fbd82b6d5ec04e12c3]
-    D      [Multiple Regression] [multiple regression] [2009-11-19 21:38:11] [ed603017d2bee8fbd82b6d5ec04e12c3]
-   P           [Multiple Regression] [monthly dummies] [2009-11-19 22:00:07] [87085ce7f5378f281469a8b1f0969170] [Current]
-   P             [Multiple Regression] [model3] [2009-11-20 08:47:44] [ed603017d2bee8fbd82b6d5ec04e12c3]
-    D              [Multiple Regression] [model 4] [2009-11-20 08:59:37] [ed603017d2bee8fbd82b6d5ec04e12c3]
-    D                [Multiple Regression] [W7: Model 4] [2009-11-22 13:34:45] [03d5b865e91ca35b5a5d21b8d6da5aba]
-    D                  [Multiple Regression] [review 7] [2009-11-24 21:51:11] [309ee52d0058ff0a6f7eec15e07b2d9f]
-    D                [Multiple Regression] [] [2009-11-22 15:02:10] [9f35ad889e41dd0c9322ca60d75b9f47]
-    D                [Multiple Regression] [Beste model] [2009-12-05 15:17:52] [34b80aeb109c116fd63bf2eb7493a276]
-    D              [Multiple Regression] [Workshop7] [2009-11-20 13:14:04] [34b80aeb109c116fd63bf2eb7493a276]
-    D                [Multiple Regression] [workshop7] [2009-11-20 13:34:45] [34b80aeb109c116fd63bf2eb7493a276]
-   P                   [Multiple Regression] [Workshop 7: verbe...] [2009-11-27 14:49:24] [7c2a5b25a196bd646844b8f5223c9b3e]
-   PD                [Multiple Regression] [Workshop 7] [2009-11-20 16:57:31] [78762f311bef5a0e45c439762ada383c]
-   P                   [Multiple Regression] [verb ws 7] [2009-11-21 09:45:52] [134dc66689e3d457a82860db6471d419]
-    D                [Multiple Regression] [model 3] [2009-12-05 14:58:14] [34b80aeb109c116fd63bf2eb7493a276]
-    D              [Multiple Regression] [W7: Linear Trend] [2009-11-21 14:22:35] [03d5b865e91ca35b5a5d21b8d6da5aba]
-    D              [Multiple Regression] [] [2009-11-22 14:13:11] [9f35ad889e41dd0c9322ca60d75b9f47]
-    D            [Multiple Regression] [W7: Monthly Dummies] [2009-11-21 14:07:55] [03d5b865e91ca35b5a5d21b8d6da5aba]
-    D            [Multiple Regression] [WS7] [2009-11-21 15:04:45] [9f35ad889e41dd0c9322ca60d75b9f47]
Feedback Forum

Post a new message
Dataseries X:
106.1	97.89
106	98.69
105.9	99.01
105.8	99.18
105.7	98.45
105.6	98.13
105.4	98.29
105.4	99.1
105.5	99.26
105.6	98.85
105.7	98.05
105.9	98.53
106.1	99.34
106	100.14
105.8	100.3
105.8	100.22
105.7	99.9
105.5	99.58
105.3	99.9
105.2	100.78
105.2	100.78
105	100.46
105.1	100.06
105.1	100.28
105.2	100.78
104.9	101.58
104.8	102.06
104.5	102.02
104.5	101.68
104.4	101.32
104.4	101.81
104.2	102.3
104.1	102.12
103.9	102.1
103.8	101.75
103.9	101.5
104.2	102.16
104.1	103.47
103.8	104.05
103.6	104.09
103.7	103.55
103.5	102.77
103.4	102.89
103.1	103.6
103.1	103.76
103.1	103.92
103.2	103.35
103.3	103.32
103.5	104.2
103.6	105.44
103.5	105.81
103.3	106.25
103.2	105.94
103.1	105.82
103.2	105.96
103	106.49
103	106.32
103.1	105.88
103.4	105.07


Summary of computational transaction
Raw Inputview raw input (R code)
Raw Outputview raw output of R engine
Computing time4 seconds
R Server'Gwilym Jenkins' @ 72.249.127.135

\begin{tabular}{lllllllll}
\hline
Summary of computational transaction \tabularnewline
Raw Input & view raw input (R code)  \tabularnewline
Raw Output & view raw output of R engine  \tabularnewline
Computing time & 4 seconds \tabularnewline
R Server & 'Gwilym Jenkins' @ 72.249.127.135 \tabularnewline
\hline
\end{tabular}
%Source: https://freestatistics.org/blog/index.php?pk=57969&T=0

[TABLE]
[ROW][C]Summary of computational transaction[/C][/ROW]
[ROW][C]Raw Input[/C][C]view raw input (R code) [/C][/ROW]
[ROW][C]Raw Output[/C][C]view raw output of R engine [/C][/ROW]
[ROW][C]Computing time[/C][C]4 seconds[/C][/ROW]
[ROW][C]R Server[/C][C]'Gwilym Jenkins' @ 72.249.127.135[/C][/ROW]
[/TABLE]
Source: https://freestatistics.org/blog/index.php?pk=57969&T=0

Globally Unique Identifier (entire table): ba.freestatistics.org/blog/index.php?pk=57969&T=0

As an alternative you can also use a QR Code:  

The GUIDs for individual cells are displayed in the table below:

Summary of computational transaction
Raw Inputview raw input (R code)
Raw Outputview raw output of R engine
Computing time4 seconds
R Server'Gwilym Jenkins' @ 72.249.127.135


Multiple Linear Regression - Estimated Regression Equation
Werkl[t] = + 143.973715807234 -0.390691631516334Infl[t] + 0.456911830344265M1[t] + 0.743696545545371M2[t] + 0.732940748784612M3[t] + 0.614354061725341M4[t] + 0.399324210806029M5[t] + 0.110861390829816M6[t] + 0.126971532182841M7[t] + 0.234204608140009M8[t] + 0.231860458350911M9[t] + 0.111377982258543M10[t] -0.0175673138100251M11[t] + e[t]

\begin{tabular}{lllllllll}
\hline
Multiple Linear Regression - Estimated Regression Equation \tabularnewline
Werkl[t] =  +  143.973715807234 -0.390691631516334Infl[t] +  0.456911830344265M1[t] +  0.743696545545371M2[t] +  0.732940748784612M3[t] +  0.614354061725341M4[t] +  0.399324210806029M5[t] +  0.110861390829816M6[t] +  0.126971532182841M7[t] +  0.234204608140009M8[t] +  0.231860458350911M9[t] +  0.111377982258543M10[t] -0.0175673138100251M11[t]  + e[t] \tabularnewline
\hline
\end{tabular}
%Source: https://freestatistics.org/blog/index.php?pk=57969&T=1

[TABLE]
[ROW][C]Multiple Linear Regression - Estimated Regression Equation[/C][/ROW]
[ROW][C]Werkl[t] =  +  143.973715807234 -0.390691631516334Infl[t] +  0.456911830344265M1[t] +  0.743696545545371M2[t] +  0.732940748784612M3[t] +  0.614354061725341M4[t] +  0.399324210806029M5[t] +  0.110861390829816M6[t] +  0.126971532182841M7[t] +  0.234204608140009M8[t] +  0.231860458350911M9[t] +  0.111377982258543M10[t] -0.0175673138100251M11[t]  + e[t][/C][/ROW]
[/TABLE]
Source: https://freestatistics.org/blog/index.php?pk=57969&T=1

Globally Unique Identifier (entire table): ba.freestatistics.org/blog/index.php?pk=57969&T=1

As an alternative you can also use a QR Code:  

The GUIDs for individual cells are displayed in the table below:

Multiple Linear Regression - Estimated Regression Equation
Werkl[t] = + 143.973715807234 -0.390691631516334Infl[t] + 0.456911830344265M1[t] + 0.743696545545371M2[t] + 0.732940748784612M3[t] + 0.614354061725341M4[t] + 0.399324210806029M5[t] + 0.110861390829816M6[t] + 0.126971532182841M7[t] + 0.234204608140009M8[t] + 0.231860458350911M9[t] + 0.111377982258543M10[t] -0.0175673138100251M11[t] + e[t]


Multiple Linear Regression - Ordinary Least Squares
VariableParameterS.D.T-STATH0: parameter = 02-tail p-value1-tail p-value
(Intercept)143.9737158072341.85252877.717400
Infl-0.3906916315163340.018279-21.373600
M10.4569118303442650.231011.97790.0539490.026975
M20.7436965455453710.231673.21020.002420.00121
M30.7329407487846120.2323013.15510.0028270.001414
M40.6143540617253410.2325132.64220.0112190.005609
M50.3993242108060290.2317261.72330.0915580.045779
M60.1108613908298160.2312840.47930.6339740.316987
M70.1269715321828410.2315460.54840.5860940.293047
M80.2342046081400090.2327321.00630.3195230.159761
M90.2318604583509110.2327190.99630.3243110.162155
M100.1113779822585430.2322930.47950.6338750.316937
M11-0.01756731381002510.231414-0.07590.9398170.469909

\begin{tabular}{lllllllll}
\hline
Multiple Linear Regression - Ordinary Least Squares \tabularnewline
Variable & Parameter & S.D. & T-STATH0: parameter = 0 & 2-tail p-value & 1-tail p-value \tabularnewline
(Intercept) & 143.973715807234 & 1.852528 & 77.7174 & 0 & 0 \tabularnewline
Infl & -0.390691631516334 & 0.018279 & -21.3736 & 0 & 0 \tabularnewline
M1 & 0.456911830344265 & 0.23101 & 1.9779 & 0.053949 & 0.026975 \tabularnewline
M2 & 0.743696545545371 & 0.23167 & 3.2102 & 0.00242 & 0.00121 \tabularnewline
M3 & 0.732940748784612 & 0.232301 & 3.1551 & 0.002827 & 0.001414 \tabularnewline
M4 & 0.614354061725341 & 0.232513 & 2.6422 & 0.011219 & 0.005609 \tabularnewline
M5 & 0.399324210806029 & 0.231726 & 1.7233 & 0.091558 & 0.045779 \tabularnewline
M6 & 0.110861390829816 & 0.231284 & 0.4793 & 0.633974 & 0.316987 \tabularnewline
M7 & 0.126971532182841 & 0.231546 & 0.5484 & 0.586094 & 0.293047 \tabularnewline
M8 & 0.234204608140009 & 0.232732 & 1.0063 & 0.319523 & 0.159761 \tabularnewline
M9 & 0.231860458350911 & 0.232719 & 0.9963 & 0.324311 & 0.162155 \tabularnewline
M10 & 0.111377982258543 & 0.232293 & 0.4795 & 0.633875 & 0.316937 \tabularnewline
M11 & -0.0175673138100251 & 0.231414 & -0.0759 & 0.939817 & 0.469909 \tabularnewline
\hline
\end{tabular}
%Source: https://freestatistics.org/blog/index.php?pk=57969&T=2

[TABLE]
[ROW][C]Multiple Linear Regression - Ordinary Least Squares[/C][/ROW]
[ROW][C]Variable[/C][C]Parameter[/C][C]S.D.[/C][C]T-STATH0: parameter = 0[/C][C]2-tail p-value[/C][C]1-tail p-value[/C][/ROW]
[ROW][C](Intercept)[/C][C]143.973715807234[/C][C]1.852528[/C][C]77.7174[/C][C]0[/C][C]0[/C][/ROW]
[ROW][C]Infl[/C][C]-0.390691631516334[/C][C]0.018279[/C][C]-21.3736[/C][C]0[/C][C]0[/C][/ROW]
[ROW][C]M1[/C][C]0.456911830344265[/C][C]0.23101[/C][C]1.9779[/C][C]0.053949[/C][C]0.026975[/C][/ROW]
[ROW][C]M2[/C][C]0.743696545545371[/C][C]0.23167[/C][C]3.2102[/C][C]0.00242[/C][C]0.00121[/C][/ROW]
[ROW][C]M3[/C][C]0.732940748784612[/C][C]0.232301[/C][C]3.1551[/C][C]0.002827[/C][C]0.001414[/C][/ROW]
[ROW][C]M4[/C][C]0.614354061725341[/C][C]0.232513[/C][C]2.6422[/C][C]0.011219[/C][C]0.005609[/C][/ROW]
[ROW][C]M5[/C][C]0.399324210806029[/C][C]0.231726[/C][C]1.7233[/C][C]0.091558[/C][C]0.045779[/C][/ROW]
[ROW][C]M6[/C][C]0.110861390829816[/C][C]0.231284[/C][C]0.4793[/C][C]0.633974[/C][C]0.316987[/C][/ROW]
[ROW][C]M7[/C][C]0.126971532182841[/C][C]0.231546[/C][C]0.5484[/C][C]0.586094[/C][C]0.293047[/C][/ROW]
[ROW][C]M8[/C][C]0.234204608140009[/C][C]0.232732[/C][C]1.0063[/C][C]0.319523[/C][C]0.159761[/C][/ROW]
[ROW][C]M9[/C][C]0.231860458350911[/C][C]0.232719[/C][C]0.9963[/C][C]0.324311[/C][C]0.162155[/C][/ROW]
[ROW][C]M10[/C][C]0.111377982258543[/C][C]0.232293[/C][C]0.4795[/C][C]0.633875[/C][C]0.316937[/C][/ROW]
[ROW][C]M11[/C][C]-0.0175673138100251[/C][C]0.231414[/C][C]-0.0759[/C][C]0.939817[/C][C]0.469909[/C][/ROW]
[/TABLE]
Source: https://freestatistics.org/blog/index.php?pk=57969&T=2

Globally Unique Identifier (entire table): ba.freestatistics.org/blog/index.php?pk=57969&T=2

As an alternative you can also use a QR Code:  

The GUIDs for individual cells are displayed in the table below:

Multiple Linear Regression - Ordinary Least Squares
VariableParameterS.D.T-STATH0: parameter = 02-tail p-value1-tail p-value
(Intercept)143.9737158072341.85252877.717400
Infl-0.3906916315163340.018279-21.373600
M10.4569118303442650.231011.97790.0539490.026975
M20.7436965455453710.231673.21020.002420.00121
M30.7329407487846120.2323013.15510.0028270.001414
M40.6143540617253410.2325132.64220.0112190.005609
M50.3993242108060290.2317261.72330.0915580.045779
M60.1108613908298160.2312840.47930.6339740.316987
M70.1269715321828410.2315460.54840.5860940.293047
M80.2342046081400090.2327321.00630.3195230.159761
M90.2318604583509110.2327190.99630.3243110.162155
M100.1113779822585430.2322930.47950.6338750.316937
M11-0.01756731381002510.231414-0.07590.9398170.469909


Multiple Linear Regression - Regression Statistics
Multiple R0.95674117805331
R-squared0.915353681782835
Adjusted R-squared0.89327203355227
F-TEST (value)41.4531411887921
F-TEST (DF numerator)12
F-TEST (DF denominator)46
p-value0
Multiple Linear Regression - Residual Statistics
Residual Standard Deviation0.344367616333890
Sum Squared Residuals5.45509653825634

\begin{tabular}{lllllllll}
\hline
Multiple Linear Regression - Regression Statistics \tabularnewline
Multiple R & 0.95674117805331 \tabularnewline
R-squared & 0.915353681782835 \tabularnewline
Adjusted R-squared & 0.89327203355227 \tabularnewline
F-TEST (value) & 41.4531411887921 \tabularnewline
F-TEST (DF numerator) & 12 \tabularnewline
F-TEST (DF denominator) & 46 \tabularnewline
p-value & 0 \tabularnewline
Multiple Linear Regression - Residual Statistics \tabularnewline
Residual Standard Deviation & 0.344367616333890 \tabularnewline
Sum Squared Residuals & 5.45509653825634 \tabularnewline
\hline
\end{tabular}
%Source: https://freestatistics.org/blog/index.php?pk=57969&T=3

[TABLE]
[ROW][C]Multiple Linear Regression - Regression Statistics[/C][/ROW]
[ROW][C]Multiple R[/C][C]0.95674117805331[/C][/ROW]
[ROW][C]R-squared[/C][C]0.915353681782835[/C][/ROW]
[ROW][C]Adjusted R-squared[/C][C]0.89327203355227[/C][/ROW]
[ROW][C]F-TEST (value)[/C][C]41.4531411887921[/C][/ROW]
[ROW][C]F-TEST (DF numerator)[/C][C]12[/C][/ROW]
[ROW][C]F-TEST (DF denominator)[/C][C]46[/C][/ROW]
[ROW][C]p-value[/C][C]0[/C][/ROW]
[ROW][C]Multiple Linear Regression - Residual Statistics[/C][/ROW]
[ROW][C]Residual Standard Deviation[/C][C]0.344367616333890[/C][/ROW]
[ROW][C]Sum Squared Residuals[/C][C]5.45509653825634[/C][/ROW]
[/TABLE]
Source: https://freestatistics.org/blog/index.php?pk=57969&T=3

Globally Unique Identifier (entire table): ba.freestatistics.org/blog/index.php?pk=57969&T=3

As an alternative you can also use a QR Code:  

The GUIDs for individual cells are displayed in the table below:

Multiple Linear Regression - Regression Statistics
Multiple R0.95674117805331
R-squared0.915353681782835
Adjusted R-squared0.89327203355227
F-TEST (value)41.4531411887921
F-TEST (DF numerator)12
F-TEST (DF denominator)46
p-value0
Multiple Linear Regression - Residual Statistics
Residual Standard Deviation0.344367616333890
Sum Squared Residuals5.45509653825634


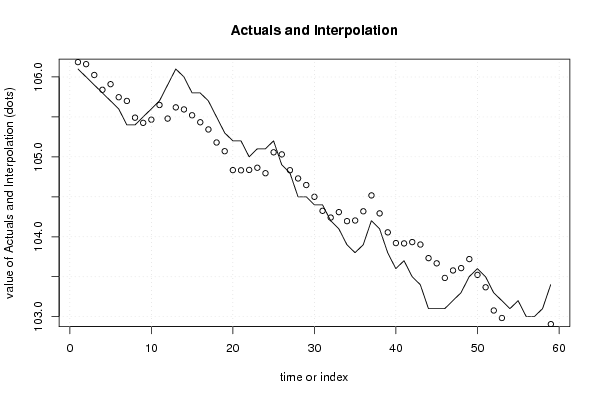
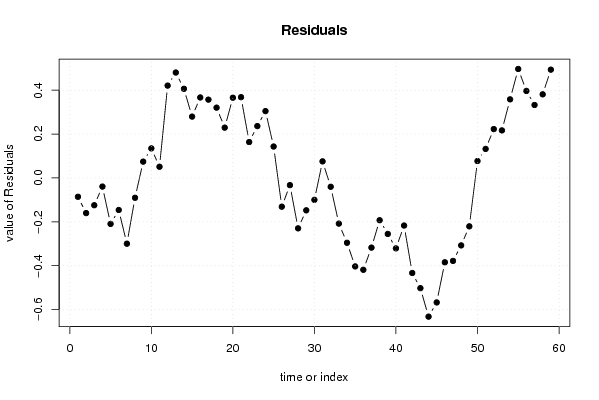
Multiple Linear Regression - Actuals, Interpolation, and Residuals
Time or IndexActualsInterpolationForecastResidualsPrediction Error
1106.1106.185823828444-0.0858238284444918
2106106.160055238433-0.160055238432842
3105.9106.024278119587-0.124278119586847
4105.8105.839273855170-0.0392738551698082
5105.7105.909448895257-0.209448895257416
6105.6105.746007397366-0.146007397366441
7105.4105.699606877677-0.299606877676837
8105.4105.490379732106-0.0903797321057792
9105.5105.4255249212740.0744750787259314
10105.6105.4652260141030.134773985896592
11105.7105.6488340232480.051165976752103
12105.9105.478869353930.421130646069923
13106.1105.6193209627460.480679037253878
14106105.5935523727340.406447627265843
15105.8105.5202859149310.279714085069211
16105.8105.4329545583930.367045441607176
17105.7105.3429460295590.357053970441269
18105.5105.1795045316680.32049546833225
19105.3105.0705933509360.229406649064451
20105.2104.8340177911580.365982208841661
21105.2104.8316736413690.36832635863076
22105104.8362124873620.163787512637895
23105.1104.86354384390.236456156099927
24105.1104.7951589987770.304841001223495
25105.2105.0567250133630.143274986637406
26104.9105.030956423351-0.130956423350632
27104.8104.832668643462-0.0326686434620398
28104.5104.729709621663-0.229709621663422
29104.5104.647514925460-0.147514925459659
30104.4104.499701092829-0.099701092829326
31104.4104.3243723347390.075627665260656
32104.2104.240166511254-0.0401665112535133
33104.1104.308146855137-0.208146855137360
34103.9104.195478211675-0.295478211675312
35103.8104.203274986637-0.403274986637467
36103.9104.318515208327-0.418515208326567
37104.2104.51757056187-0.317570561870056
38104.1104.292549239785-0.192549239784773
39103.8104.055192296745-0.255192296744538
40103.6103.920977944425-0.320977944424614
41103.7103.916921574524-0.216921574524116
42103.5103.933198227131-0.433198227130647
43103.4103.902425372702-0.502425372701704
44103.1103.732267390282-0.63226739028229
45103.1103.667412579451-0.567412579450573
46103.1103.484419442316-0.384419442315593
47103.2103.578168376211-0.37816837621133
48103.3103.607456438967-0.307456438966851
49103.5103.720559633577-0.220559633576736
50103.6103.5228867256980.0771132743024041
51103.5103.3675750252760.132424974724214
52103.3103.0770840203490.222915979650668
53103.2102.98316857520.216831424799922
54103.1102.7415887510060.358411248994164
55103.2102.7030020639470.496997936053434
56103102.60316857520.396831424799921
57103102.6672420027690.332757997231242
58103.1102.7186638445440.381336155456418
59103.4102.9061787700030.493821229996766

\begin{tabular}{lllllllll}
\hline
Multiple Linear Regression - Actuals, Interpolation, and Residuals \tabularnewline
Time or Index & Actuals & InterpolationForecast & ResidualsPrediction Error \tabularnewline
1 & 106.1 & 106.185823828444 & -0.0858238284444918 \tabularnewline
2 & 106 & 106.160055238433 & -0.160055238432842 \tabularnewline
3 & 105.9 & 106.024278119587 & -0.124278119586847 \tabularnewline
4 & 105.8 & 105.839273855170 & -0.0392738551698082 \tabularnewline
5 & 105.7 & 105.909448895257 & -0.209448895257416 \tabularnewline
6 & 105.6 & 105.746007397366 & -0.146007397366441 \tabularnewline
7 & 105.4 & 105.699606877677 & -0.299606877676837 \tabularnewline
8 & 105.4 & 105.490379732106 & -0.0903797321057792 \tabularnewline
9 & 105.5 & 105.425524921274 & 0.0744750787259314 \tabularnewline
10 & 105.6 & 105.465226014103 & 0.134773985896592 \tabularnewline
11 & 105.7 & 105.648834023248 & 0.051165976752103 \tabularnewline
12 & 105.9 & 105.47886935393 & 0.421130646069923 \tabularnewline
13 & 106.1 & 105.619320962746 & 0.480679037253878 \tabularnewline
14 & 106 & 105.593552372734 & 0.406447627265843 \tabularnewline
15 & 105.8 & 105.520285914931 & 0.279714085069211 \tabularnewline
16 & 105.8 & 105.432954558393 & 0.367045441607176 \tabularnewline
17 & 105.7 & 105.342946029559 & 0.357053970441269 \tabularnewline
18 & 105.5 & 105.179504531668 & 0.32049546833225 \tabularnewline
19 & 105.3 & 105.070593350936 & 0.229406649064451 \tabularnewline
20 & 105.2 & 104.834017791158 & 0.365982208841661 \tabularnewline
21 & 105.2 & 104.831673641369 & 0.36832635863076 \tabularnewline
22 & 105 & 104.836212487362 & 0.163787512637895 \tabularnewline
23 & 105.1 & 104.8635438439 & 0.236456156099927 \tabularnewline
24 & 105.1 & 104.795158998777 & 0.304841001223495 \tabularnewline
25 & 105.2 & 105.056725013363 & 0.143274986637406 \tabularnewline
26 & 104.9 & 105.030956423351 & -0.130956423350632 \tabularnewline
27 & 104.8 & 104.832668643462 & -0.0326686434620398 \tabularnewline
28 & 104.5 & 104.729709621663 & -0.229709621663422 \tabularnewline
29 & 104.5 & 104.647514925460 & -0.147514925459659 \tabularnewline
30 & 104.4 & 104.499701092829 & -0.099701092829326 \tabularnewline
31 & 104.4 & 104.324372334739 & 0.075627665260656 \tabularnewline
32 & 104.2 & 104.240166511254 & -0.0401665112535133 \tabularnewline
33 & 104.1 & 104.308146855137 & -0.208146855137360 \tabularnewline
34 & 103.9 & 104.195478211675 & -0.295478211675312 \tabularnewline
35 & 103.8 & 104.203274986637 & -0.403274986637467 \tabularnewline
36 & 103.9 & 104.318515208327 & -0.418515208326567 \tabularnewline
37 & 104.2 & 104.51757056187 & -0.317570561870056 \tabularnewline
38 & 104.1 & 104.292549239785 & -0.192549239784773 \tabularnewline
39 & 103.8 & 104.055192296745 & -0.255192296744538 \tabularnewline
40 & 103.6 & 103.920977944425 & -0.320977944424614 \tabularnewline
41 & 103.7 & 103.916921574524 & -0.216921574524116 \tabularnewline
42 & 103.5 & 103.933198227131 & -0.433198227130647 \tabularnewline
43 & 103.4 & 103.902425372702 & -0.502425372701704 \tabularnewline
44 & 103.1 & 103.732267390282 & -0.63226739028229 \tabularnewline
45 & 103.1 & 103.667412579451 & -0.567412579450573 \tabularnewline
46 & 103.1 & 103.484419442316 & -0.384419442315593 \tabularnewline
47 & 103.2 & 103.578168376211 & -0.37816837621133 \tabularnewline
48 & 103.3 & 103.607456438967 & -0.307456438966851 \tabularnewline
49 & 103.5 & 103.720559633577 & -0.220559633576736 \tabularnewline
50 & 103.6 & 103.522886725698 & 0.0771132743024041 \tabularnewline
51 & 103.5 & 103.367575025276 & 0.132424974724214 \tabularnewline
52 & 103.3 & 103.077084020349 & 0.222915979650668 \tabularnewline
53 & 103.2 & 102.9831685752 & 0.216831424799922 \tabularnewline
54 & 103.1 & 102.741588751006 & 0.358411248994164 \tabularnewline
55 & 103.2 & 102.703002063947 & 0.496997936053434 \tabularnewline
56 & 103 & 102.6031685752 & 0.396831424799921 \tabularnewline
57 & 103 & 102.667242002769 & 0.332757997231242 \tabularnewline
58 & 103.1 & 102.718663844544 & 0.381336155456418 \tabularnewline
59 & 103.4 & 102.906178770003 & 0.493821229996766 \tabularnewline
\hline
\end{tabular}
%Source: https://freestatistics.org/blog/index.php?pk=57969&T=4

[TABLE]
[ROW][C]Multiple Linear Regression - Actuals, Interpolation, and Residuals[/C][/ROW]
[ROW][C]Time or Index[/C][C]Actuals[/C][C]InterpolationForecast[/C][C]ResidualsPrediction Error[/C][/ROW]
[ROW][C]1[/C][C]106.1[/C][C]106.185823828444[/C][C]-0.0858238284444918[/C][/ROW]
[ROW][C]2[/C][C]106[/C][C]106.160055238433[/C][C]-0.160055238432842[/C][/ROW]
[ROW][C]3[/C][C]105.9[/C][C]106.024278119587[/C][C]-0.124278119586847[/C][/ROW]
[ROW][C]4[/C][C]105.8[/C][C]105.839273855170[/C][C]-0.0392738551698082[/C][/ROW]
[ROW][C]5[/C][C]105.7[/C][C]105.909448895257[/C][C]-0.209448895257416[/C][/ROW]
[ROW][C]6[/C][C]105.6[/C][C]105.746007397366[/C][C]-0.146007397366441[/C][/ROW]
[ROW][C]7[/C][C]105.4[/C][C]105.699606877677[/C][C]-0.299606877676837[/C][/ROW]
[ROW][C]8[/C][C]105.4[/C][C]105.490379732106[/C][C]-0.0903797321057792[/C][/ROW]
[ROW][C]9[/C][C]105.5[/C][C]105.425524921274[/C][C]0.0744750787259314[/C][/ROW]
[ROW][C]10[/C][C]105.6[/C][C]105.465226014103[/C][C]0.134773985896592[/C][/ROW]
[ROW][C]11[/C][C]105.7[/C][C]105.648834023248[/C][C]0.051165976752103[/C][/ROW]
[ROW][C]12[/C][C]105.9[/C][C]105.47886935393[/C][C]0.421130646069923[/C][/ROW]
[ROW][C]13[/C][C]106.1[/C][C]105.619320962746[/C][C]0.480679037253878[/C][/ROW]
[ROW][C]14[/C][C]106[/C][C]105.593552372734[/C][C]0.406447627265843[/C][/ROW]
[ROW][C]15[/C][C]105.8[/C][C]105.520285914931[/C][C]0.279714085069211[/C][/ROW]
[ROW][C]16[/C][C]105.8[/C][C]105.432954558393[/C][C]0.367045441607176[/C][/ROW]
[ROW][C]17[/C][C]105.7[/C][C]105.342946029559[/C][C]0.357053970441269[/C][/ROW]
[ROW][C]18[/C][C]105.5[/C][C]105.179504531668[/C][C]0.32049546833225[/C][/ROW]
[ROW][C]19[/C][C]105.3[/C][C]105.070593350936[/C][C]0.229406649064451[/C][/ROW]
[ROW][C]20[/C][C]105.2[/C][C]104.834017791158[/C][C]0.365982208841661[/C][/ROW]
[ROW][C]21[/C][C]105.2[/C][C]104.831673641369[/C][C]0.36832635863076[/C][/ROW]
[ROW][C]22[/C][C]105[/C][C]104.836212487362[/C][C]0.163787512637895[/C][/ROW]
[ROW][C]23[/C][C]105.1[/C][C]104.8635438439[/C][C]0.236456156099927[/C][/ROW]
[ROW][C]24[/C][C]105.1[/C][C]104.795158998777[/C][C]0.304841001223495[/C][/ROW]
[ROW][C]25[/C][C]105.2[/C][C]105.056725013363[/C][C]0.143274986637406[/C][/ROW]
[ROW][C]26[/C][C]104.9[/C][C]105.030956423351[/C][C]-0.130956423350632[/C][/ROW]
[ROW][C]27[/C][C]104.8[/C][C]104.832668643462[/C][C]-0.0326686434620398[/C][/ROW]
[ROW][C]28[/C][C]104.5[/C][C]104.729709621663[/C][C]-0.229709621663422[/C][/ROW]
[ROW][C]29[/C][C]104.5[/C][C]104.647514925460[/C][C]-0.147514925459659[/C][/ROW]
[ROW][C]30[/C][C]104.4[/C][C]104.499701092829[/C][C]-0.099701092829326[/C][/ROW]
[ROW][C]31[/C][C]104.4[/C][C]104.324372334739[/C][C]0.075627665260656[/C][/ROW]
[ROW][C]32[/C][C]104.2[/C][C]104.240166511254[/C][C]-0.0401665112535133[/C][/ROW]
[ROW][C]33[/C][C]104.1[/C][C]104.308146855137[/C][C]-0.208146855137360[/C][/ROW]
[ROW][C]34[/C][C]103.9[/C][C]104.195478211675[/C][C]-0.295478211675312[/C][/ROW]
[ROW][C]35[/C][C]103.8[/C][C]104.203274986637[/C][C]-0.403274986637467[/C][/ROW]
[ROW][C]36[/C][C]103.9[/C][C]104.318515208327[/C][C]-0.418515208326567[/C][/ROW]
[ROW][C]37[/C][C]104.2[/C][C]104.51757056187[/C][C]-0.317570561870056[/C][/ROW]
[ROW][C]38[/C][C]104.1[/C][C]104.292549239785[/C][C]-0.192549239784773[/C][/ROW]
[ROW][C]39[/C][C]103.8[/C][C]104.055192296745[/C][C]-0.255192296744538[/C][/ROW]
[ROW][C]40[/C][C]103.6[/C][C]103.920977944425[/C][C]-0.320977944424614[/C][/ROW]
[ROW][C]41[/C][C]103.7[/C][C]103.916921574524[/C][C]-0.216921574524116[/C][/ROW]
[ROW][C]42[/C][C]103.5[/C][C]103.933198227131[/C][C]-0.433198227130647[/C][/ROW]
[ROW][C]43[/C][C]103.4[/C][C]103.902425372702[/C][C]-0.502425372701704[/C][/ROW]
[ROW][C]44[/C][C]103.1[/C][C]103.732267390282[/C][C]-0.63226739028229[/C][/ROW]
[ROW][C]45[/C][C]103.1[/C][C]103.667412579451[/C][C]-0.567412579450573[/C][/ROW]
[ROW][C]46[/C][C]103.1[/C][C]103.484419442316[/C][C]-0.384419442315593[/C][/ROW]
[ROW][C]47[/C][C]103.2[/C][C]103.578168376211[/C][C]-0.37816837621133[/C][/ROW]
[ROW][C]48[/C][C]103.3[/C][C]103.607456438967[/C][C]-0.307456438966851[/C][/ROW]
[ROW][C]49[/C][C]103.5[/C][C]103.720559633577[/C][C]-0.220559633576736[/C][/ROW]
[ROW][C]50[/C][C]103.6[/C][C]103.522886725698[/C][C]0.0771132743024041[/C][/ROW]
[ROW][C]51[/C][C]103.5[/C][C]103.367575025276[/C][C]0.132424974724214[/C][/ROW]
[ROW][C]52[/C][C]103.3[/C][C]103.077084020349[/C][C]0.222915979650668[/C][/ROW]
[ROW][C]53[/C][C]103.2[/C][C]102.9831685752[/C][C]0.216831424799922[/C][/ROW]
[ROW][C]54[/C][C]103.1[/C][C]102.741588751006[/C][C]0.358411248994164[/C][/ROW]
[ROW][C]55[/C][C]103.2[/C][C]102.703002063947[/C][C]0.496997936053434[/C][/ROW]
[ROW][C]56[/C][C]103[/C][C]102.6031685752[/C][C]0.396831424799921[/C][/ROW]
[ROW][C]57[/C][C]103[/C][C]102.667242002769[/C][C]0.332757997231242[/C][/ROW]
[ROW][C]58[/C][C]103.1[/C][C]102.718663844544[/C][C]0.381336155456418[/C][/ROW]
[ROW][C]59[/C][C]103.4[/C][C]102.906178770003[/C][C]0.493821229996766[/C][/ROW]
[/TABLE]
Source: https://freestatistics.org/blog/index.php?pk=57969&T=4

Globally Unique Identifier (entire table): ba.freestatistics.org/blog/index.php?pk=57969&T=4

As an alternative you can also use a QR Code:  

The GUIDs for individual cells are displayed in the table below:

Multiple Linear Regression - Actuals, Interpolation, and Residuals
Time or IndexActualsInterpolationForecastResidualsPrediction Error
1106.1106.185823828444-0.0858238284444918
2106106.160055238433-0.160055238432842
3105.9106.024278119587-0.124278119586847
4105.8105.839273855170-0.0392738551698082
5105.7105.909448895257-0.209448895257416
6105.6105.746007397366-0.146007397366441
7105.4105.699606877677-0.299606877676837
8105.4105.490379732106-0.0903797321057792
9105.5105.4255249212740.0744750787259314
10105.6105.4652260141030.134773985896592
11105.7105.6488340232480.051165976752103
12105.9105.478869353930.421130646069923
13106.1105.6193209627460.480679037253878
14106105.5935523727340.406447627265843
15105.8105.5202859149310.279714085069211
16105.8105.4329545583930.367045441607176
17105.7105.3429460295590.357053970441269
18105.5105.1795045316680.32049546833225
19105.3105.0705933509360.229406649064451
20105.2104.8340177911580.365982208841661
21105.2104.8316736413690.36832635863076
22105104.8362124873620.163787512637895
23105.1104.86354384390.236456156099927
24105.1104.7951589987770.304841001223495
25105.2105.0567250133630.143274986637406
26104.9105.030956423351-0.130956423350632
27104.8104.832668643462-0.0326686434620398
28104.5104.729709621663-0.229709621663422
29104.5104.647514925460-0.147514925459659
30104.4104.499701092829-0.099701092829326
31104.4104.3243723347390.075627665260656
32104.2104.240166511254-0.0401665112535133
33104.1104.308146855137-0.208146855137360
34103.9104.195478211675-0.295478211675312
35103.8104.203274986637-0.403274986637467
36103.9104.318515208327-0.418515208326567
37104.2104.51757056187-0.317570561870056
38104.1104.292549239785-0.192549239784773
39103.8104.055192296745-0.255192296744538
40103.6103.920977944425-0.320977944424614
41103.7103.916921574524-0.216921574524116
42103.5103.933198227131-0.433198227130647
43103.4103.902425372702-0.502425372701704
44103.1103.732267390282-0.63226739028229
45103.1103.667412579451-0.567412579450573
46103.1103.484419442316-0.384419442315593
47103.2103.578168376211-0.37816837621133
48103.3103.607456438967-0.307456438966851
49103.5103.720559633577-0.220559633576736
50103.6103.5228867256980.0771132743024041
51103.5103.3675750252760.132424974724214
52103.3103.0770840203490.222915979650668
53103.2102.98316857520.216831424799922
54103.1102.7415887510060.358411248994164
55103.2102.7030020639470.496997936053434
56103102.60316857520.396831424799921
57103102.6672420027690.332757997231242
58103.1102.7186638445440.381336155456418
59103.4102.9061787700030.493821229996766


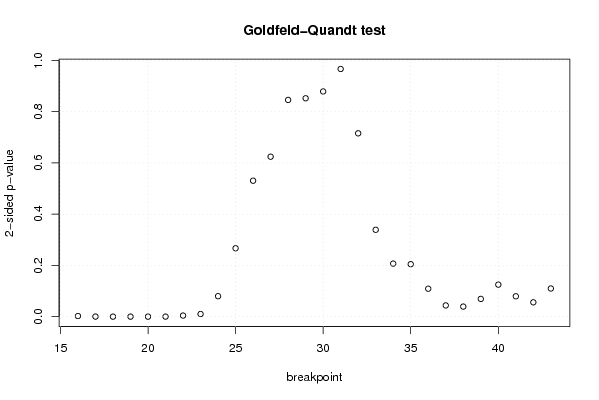
Goldfeld-Quandt test for Heteroskedasticity
p-valuesAlternative Hypothesis
breakpoint indexgreater2-sidedless
160.001224130919953050.00244826183990610.998775869080047
170.0001162501452248820.0002325002904497640.999883749854775
183.10913699466135e-056.21827398932271e-050.999968908630053
195.11178346741122e-061.02235669348224e-050.999994888216533
207.55776291522252e-061.51155258304450e-050.999992442237085
214.00578488810076e-058.01156977620152e-050.999959942151119
220.002131630710828350.004263261421656710.997868369289172
230.005142889323245370.01028577864649070.994857110676755
240.0399551589489390.0799103178978780.96004484105106
250.1334341206815720.2668682413631450.866565879318428
260.2652389305884970.5304778611769940.734761069411503
270.3120983525723070.6241967051446140.687901647427693
280.4228363997970840.8456727995941670.577163600202916
290.4260531165973590.8521062331947170.573946883402641
300.4393589056484400.8787178112968810.56064109435156
310.4832885815678290.9665771631356570.516711418432171
320.6422771325792750.7154457348414490.357722867420725
330.8305244765600020.3389510468799960.169475523439998
340.8965069476631260.2069861046737470.103493052336874
350.8976131639915760.2047736720168480.102386836008424
360.9454822121422740.1090355757154520.0545177878577262
370.9780925027596030.04381499448079330.0219074972403966
380.980368815505220.03926236898956020.0196311844947801
390.9653625699626270.06927486007474550.0346374300373728
400.9375666063921130.1248667872157740.0624333936078872
410.9602662562457410.07946748750851740.0397337437542587
420.9720420894175320.05591582116493570.0279579105824679
430.9450904696307320.1098190607385360.0549095303692682

\begin{tabular}{lllllllll}
\hline
Goldfeld-Quandt test for Heteroskedasticity \tabularnewline
p-values & Alternative Hypothesis \tabularnewline
breakpoint index & greater & 2-sided & less \tabularnewline
16 & 0.00122413091995305 & 0.0024482618399061 & 0.998775869080047 \tabularnewline
17 & 0.000116250145224882 & 0.000232500290449764 & 0.999883749854775 \tabularnewline
18 & 3.10913699466135e-05 & 6.21827398932271e-05 & 0.999968908630053 \tabularnewline
19 & 5.11178346741122e-06 & 1.02235669348224e-05 & 0.999994888216533 \tabularnewline
20 & 7.55776291522252e-06 & 1.51155258304450e-05 & 0.999992442237085 \tabularnewline
21 & 4.00578488810076e-05 & 8.01156977620152e-05 & 0.999959942151119 \tabularnewline
22 & 0.00213163071082835 & 0.00426326142165671 & 0.997868369289172 \tabularnewline
23 & 0.00514288932324537 & 0.0102857786464907 & 0.994857110676755 \tabularnewline
24 & 0.039955158948939 & 0.079910317897878 & 0.96004484105106 \tabularnewline
25 & 0.133434120681572 & 0.266868241363145 & 0.866565879318428 \tabularnewline
26 & 0.265238930588497 & 0.530477861176994 & 0.734761069411503 \tabularnewline
27 & 0.312098352572307 & 0.624196705144614 & 0.687901647427693 \tabularnewline
28 & 0.422836399797084 & 0.845672799594167 & 0.577163600202916 \tabularnewline
29 & 0.426053116597359 & 0.852106233194717 & 0.573946883402641 \tabularnewline
30 & 0.439358905648440 & 0.878717811296881 & 0.56064109435156 \tabularnewline
31 & 0.483288581567829 & 0.966577163135657 & 0.516711418432171 \tabularnewline
32 & 0.642277132579275 & 0.715445734841449 & 0.357722867420725 \tabularnewline
33 & 0.830524476560002 & 0.338951046879996 & 0.169475523439998 \tabularnewline
34 & 0.896506947663126 & 0.206986104673747 & 0.103493052336874 \tabularnewline
35 & 0.897613163991576 & 0.204773672016848 & 0.102386836008424 \tabularnewline
36 & 0.945482212142274 & 0.109035575715452 & 0.0545177878577262 \tabularnewline
37 & 0.978092502759603 & 0.0438149944807933 & 0.0219074972403966 \tabularnewline
38 & 0.98036881550522 & 0.0392623689895602 & 0.0196311844947801 \tabularnewline
39 & 0.965362569962627 & 0.0692748600747455 & 0.0346374300373728 \tabularnewline
40 & 0.937566606392113 & 0.124866787215774 & 0.0624333936078872 \tabularnewline
41 & 0.960266256245741 & 0.0794674875085174 & 0.0397337437542587 \tabularnewline
42 & 0.972042089417532 & 0.0559158211649357 & 0.0279579105824679 \tabularnewline
43 & 0.945090469630732 & 0.109819060738536 & 0.0549095303692682 \tabularnewline
\hline
\end{tabular}
%Source: https://freestatistics.org/blog/index.php?pk=57969&T=5

[TABLE]
[ROW][C]Goldfeld-Quandt test for Heteroskedasticity[/C][/ROW]
[ROW][C]p-values[/C][C]Alternative Hypothesis[/C][/ROW]
[ROW][C]breakpoint index[/C][C]greater[/C][C]2-sided[/C][C]less[/C][/ROW]
[ROW][C]16[/C][C]0.00122413091995305[/C][C]0.0024482618399061[/C][C]0.998775869080047[/C][/ROW]
[ROW][C]17[/C][C]0.000116250145224882[/C][C]0.000232500290449764[/C][C]0.999883749854775[/C][/ROW]
[ROW][C]18[/C][C]3.10913699466135e-05[/C][C]6.21827398932271e-05[/C][C]0.999968908630053[/C][/ROW]
[ROW][C]19[/C][C]5.11178346741122e-06[/C][C]1.02235669348224e-05[/C][C]0.999994888216533[/C][/ROW]
[ROW][C]20[/C][C]7.55776291522252e-06[/C][C]1.51155258304450e-05[/C][C]0.999992442237085[/C][/ROW]
[ROW][C]21[/C][C]4.00578488810076e-05[/C][C]8.01156977620152e-05[/C][C]0.999959942151119[/C][/ROW]
[ROW][C]22[/C][C]0.00213163071082835[/C][C]0.00426326142165671[/C][C]0.997868369289172[/C][/ROW]
[ROW][C]23[/C][C]0.00514288932324537[/C][C]0.0102857786464907[/C][C]0.994857110676755[/C][/ROW]
[ROW][C]24[/C][C]0.039955158948939[/C][C]0.079910317897878[/C][C]0.96004484105106[/C][/ROW]
[ROW][C]25[/C][C]0.133434120681572[/C][C]0.266868241363145[/C][C]0.866565879318428[/C][/ROW]
[ROW][C]26[/C][C]0.265238930588497[/C][C]0.530477861176994[/C][C]0.734761069411503[/C][/ROW]
[ROW][C]27[/C][C]0.312098352572307[/C][C]0.624196705144614[/C][C]0.687901647427693[/C][/ROW]
[ROW][C]28[/C][C]0.422836399797084[/C][C]0.845672799594167[/C][C]0.577163600202916[/C][/ROW]
[ROW][C]29[/C][C]0.426053116597359[/C][C]0.852106233194717[/C][C]0.573946883402641[/C][/ROW]
[ROW][C]30[/C][C]0.439358905648440[/C][C]0.878717811296881[/C][C]0.56064109435156[/C][/ROW]
[ROW][C]31[/C][C]0.483288581567829[/C][C]0.966577163135657[/C][C]0.516711418432171[/C][/ROW]
[ROW][C]32[/C][C]0.642277132579275[/C][C]0.715445734841449[/C][C]0.357722867420725[/C][/ROW]
[ROW][C]33[/C][C]0.830524476560002[/C][C]0.338951046879996[/C][C]0.169475523439998[/C][/ROW]
[ROW][C]34[/C][C]0.896506947663126[/C][C]0.206986104673747[/C][C]0.103493052336874[/C][/ROW]
[ROW][C]35[/C][C]0.897613163991576[/C][C]0.204773672016848[/C][C]0.102386836008424[/C][/ROW]
[ROW][C]36[/C][C]0.945482212142274[/C][C]0.109035575715452[/C][C]0.0545177878577262[/C][/ROW]
[ROW][C]37[/C][C]0.978092502759603[/C][C]0.0438149944807933[/C][C]0.0219074972403966[/C][/ROW]
[ROW][C]38[/C][C]0.98036881550522[/C][C]0.0392623689895602[/C][C]0.0196311844947801[/C][/ROW]
[ROW][C]39[/C][C]0.965362569962627[/C][C]0.0692748600747455[/C][C]0.0346374300373728[/C][/ROW]
[ROW][C]40[/C][C]0.937566606392113[/C][C]0.124866787215774[/C][C]0.0624333936078872[/C][/ROW]
[ROW][C]41[/C][C]0.960266256245741[/C][C]0.0794674875085174[/C][C]0.0397337437542587[/C][/ROW]
[ROW][C]42[/C][C]0.972042089417532[/C][C]0.0559158211649357[/C][C]0.0279579105824679[/C][/ROW]
[ROW][C]43[/C][C]0.945090469630732[/C][C]0.109819060738536[/C][C]0.0549095303692682[/C][/ROW]
[/TABLE]
Source: https://freestatistics.org/blog/index.php?pk=57969&T=5

Globally Unique Identifier (entire table): ba.freestatistics.org/blog/index.php?pk=57969&T=5

As an alternative you can also use a QR Code:  

The GUIDs for individual cells are displayed in the table below:

Goldfeld-Quandt test for Heteroskedasticity
p-valuesAlternative Hypothesis
breakpoint indexgreater2-sidedless
160.001224130919953050.00244826183990610.998775869080047
170.0001162501452248820.0002325002904497640.999883749854775
183.10913699466135e-056.21827398932271e-050.999968908630053
195.11178346741122e-061.02235669348224e-050.999994888216533
207.55776291522252e-061.51155258304450e-050.999992442237085
214.00578488810076e-058.01156977620152e-050.999959942151119
220.002131630710828350.004263261421656710.997868369289172
230.005142889323245370.01028577864649070.994857110676755
240.0399551589489390.0799103178978780.96004484105106
250.1334341206815720.2668682413631450.866565879318428
260.2652389305884970.5304778611769940.734761069411503
270.3120983525723070.6241967051446140.687901647427693
280.4228363997970840.8456727995941670.577163600202916
290.4260531165973590.8521062331947170.573946883402641
300.4393589056484400.8787178112968810.56064109435156
310.4832885815678290.9665771631356570.516711418432171
320.6422771325792750.7154457348414490.357722867420725
330.8305244765600020.3389510468799960.169475523439998
340.8965069476631260.2069861046737470.103493052336874
350.8976131639915760.2047736720168480.102386836008424
360.9454822121422740.1090355757154520.0545177878577262
370.9780925027596030.04381499448079330.0219074972403966
380.980368815505220.03926236898956020.0196311844947801
390.9653625699626270.06927486007474550.0346374300373728
400.9375666063921130.1248667872157740.0624333936078872
410.9602662562457410.07946748750851740.0397337437542587
420.9720420894175320.05591582116493570.0279579105824679
430.9450904696307320.1098190607385360.0549095303692682


Meta Analysis of Goldfeld-Quandt test for Heteroskedasticity
Description# significant tests% significant testsOK/NOK
1% type I error level70.25NOK
5% type I error level100.357142857142857NOK
10% type I error level140.5NOK

\begin{tabular}{lllllllll}
\hline
Meta Analysis of Goldfeld-Quandt test for Heteroskedasticity \tabularnewline
Description & # significant tests & % significant tests & OK/NOK \tabularnewline
1% type I error level & 7 & 0.25 & NOK \tabularnewline
5% type I error level & 10 & 0.357142857142857 & NOK \tabularnewline
10% type I error level & 14 & 0.5 & NOK \tabularnewline
\hline
\end{tabular}
%Source: https://freestatistics.org/blog/index.php?pk=57969&T=6

[TABLE]
[ROW][C]Meta Analysis of Goldfeld-Quandt test for Heteroskedasticity[/C][/ROW]
[ROW][C]Description[/C][C]# significant tests[/C][C]% significant tests[/C][C]OK/NOK[/C][/ROW]
[ROW][C]1% type I error level[/C][C]7[/C][C]0.25[/C][C]NOK[/C][/ROW]
[ROW][C]5% type I error level[/C][C]10[/C][C]0.357142857142857[/C][C]NOK[/C][/ROW]
[ROW][C]10% type I error level[/C][C]14[/C][C]0.5[/C][C]NOK[/C][/ROW]
[/TABLE]
Source: https://freestatistics.org/blog/index.php?pk=57969&T=6

Globally Unique Identifier (entire table): ba.freestatistics.org/blog/index.php?pk=57969&T=6

As an alternative you can also use a QR Code:  

The GUIDs for individual cells are displayed in the table below:

Meta Analysis of Goldfeld-Quandt test for Heteroskedasticity
Description# significant tests% significant testsOK/NOK
1% type I error level70.25NOK
5% type I error level100.357142857142857NOK
10% type I error level140.5NOK


Parameters (Session):
par1 = 1 ; par2 = Include Monthly Dummies ; par3 = No Linear Trend ;
Parameters (R input):
par1 = 1 ; par2 = Include Monthly Dummies ; par3 = No Linear Trend ;
R code (references can be found in the software module):
library(lattice)
library(lmtest)
n25 <- 25 #minimum number of obs. for Goldfeld-Quandt test
par1 <- as.numeric(par1)
x <- t(y)
k <- length(x[1,])
n <- length(x[,1])
x1 <- cbind(x[,par1], x[,1:k!=par1])
mycolnames <- c(colnames(x)[par1], colnames(x)[1:k!=par1])
colnames(x1) <- mycolnames #colnames(x)[par1]
x <- x1
if (par3 == 'First Differences'){
x2 <- array(0, dim=c(n-1,k), dimnames=list(1:(n-1), paste('(1-B)',colnames(x),sep='')))
for (i in 1:n-1) {
for (j in 1:k) {
x2[i,j] <- x[i+1,j] - x[i,j]
}
}
x <- x2
}
if (par2 == 'Include Monthly Dummies'){
x2 <- array(0, dim=c(n,11), dimnames=list(1:n, paste('M', seq(1:11), sep ='')))
for (i in 1:11){
x2[seq(i,n,12),i] <- 1
}
x <- cbind(x, x2)
}
if (par2 == 'Include Quarterly Dummies'){
x2 <- array(0, dim=c(n,3), dimnames=list(1:n, paste('Q', seq(1:3), sep ='')))
for (i in 1:3){
x2[seq(i,n,4),i] <- 1
}
x <- cbind(x, x2)
}
k <- length(x[1,])
if (par3 == 'Linear Trend'){
x <- cbind(x, c(1:n))
colnames(x)[k+1] <- 't'
}
x
k <- length(x[1,])
df <- as.data.frame(x)
(mylm <- lm(df))
(mysum <- summary(mylm))
if (n > n25) {
kp3 <- k + 3
nmkm3 <- n - k - 3
gqarr <- array(NA, dim=c(nmkm3-kp3+1,3))
numgqtests <- 0
numsignificant1 <- 0
numsignificant5 <- 0
numsignificant10 <- 0
for (mypoint in kp3:nmkm3) {
j <- 0
numgqtests <- numgqtests + 1
for (myalt in c('greater', 'two.sided', 'less')) {
j <- j + 1
gqarr[mypoint-kp3+1,j] <- gqtest(mylm, point=mypoint, alternative=myalt)$p.value
}
if (gqarr[mypoint-kp3+1,2] < 0.01) numsignificant1 <- numsignificant1 + 1
if (gqarr[mypoint-kp3+1,2] < 0.05) numsignificant5 <- numsignificant5 + 1
if (gqarr[mypoint-kp3+1,2] < 0.10) numsignificant10 <- numsignificant10 + 1
}
gqarr
}
bitmap(file='test0.png')
plot(x[,1], type='l', main='Actuals and Interpolation', ylab='value of Actuals and Interpolation (dots)', xlab='time or index')
points(x[,1]-mysum$resid)
grid()
dev.off()
bitmap(file='test1.png')
plot(mysum$resid, type='b', pch=19, main='Residuals', ylab='value of Residuals', xlab='time or index')
grid()
dev.off()
bitmap(file='test2.png')
hist(mysum$resid, main='Residual Histogram', xlab='values of Residuals')
grid()
dev.off()
bitmap(file='test3.png')
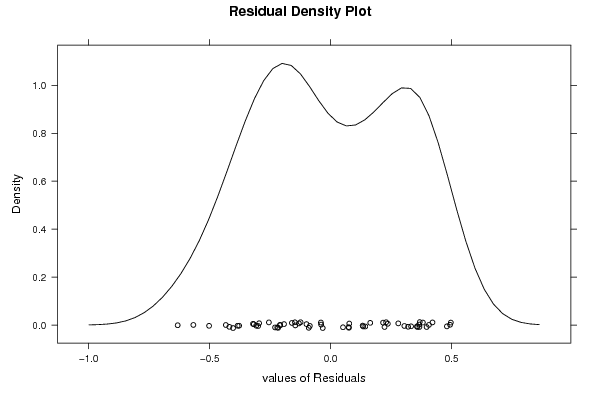
densityplot(~mysum$resid,col='black',main='Residual Density Plot', xlab='values of Residuals')
dev.off()
bitmap(file='test4.png')
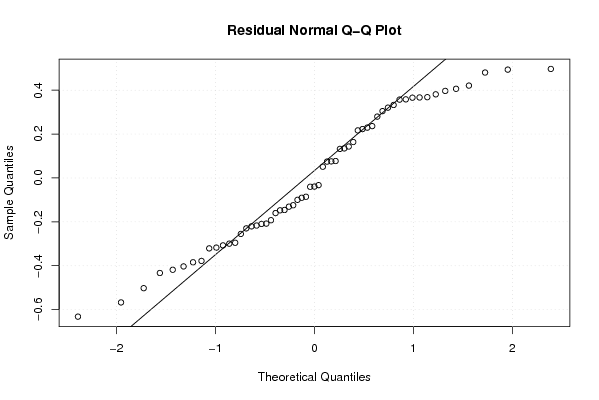
qqnorm(mysum$resid, main='Residual Normal Q-Q Plot')
qqline(mysum$resid)
grid()
dev.off()
(myerror <- as.ts(mysum$resid))
bitmap(file='test5.png')
dum <- cbind(lag(myerror,k=1),myerror)
dum
dum1 <- dum[2:length(myerror),]
dum1
z <- as.data.frame(dum1)
z
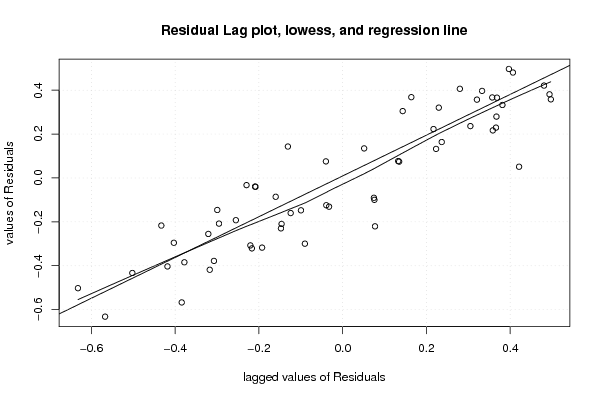
plot(z,main=paste('Residual Lag plot, lowess, and regression line'), ylab='values of Residuals', xlab='lagged values of Residuals')
lines(lowess(z))
abline(lm(z))
grid()
dev.off()
bitmap(file='test6.png')
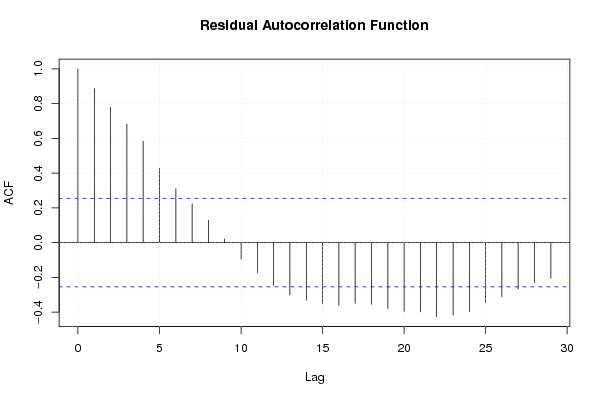
acf(mysum$resid, lag.max=length(mysum$resid)/2, main='Residual Autocorrelation Function')
grid()
dev.off()
bitmap(file='test7.png')
pacf(mysum$resid, lag.max=length(mysum$resid)/2, main='Residual Partial Autocorrelation Function')
grid()
dev.off()
bitmap(file='test8.png')
opar <- par(mfrow = c(2,2), oma = c(0, 0, 1.1, 0))
plot(mylm, las = 1, sub='Residual Diagnostics')
par(opar)
dev.off()
if (n > n25) {
bitmap(file='test9.png')
plot(kp3:nmkm3,gqarr[,2], main='Goldfeld-Quandt test',ylab='2-sided p-value',xlab='breakpoint')
grid()
dev.off()
}
load(file='createtable')
a<-table.start()
a<-table.row.start(a)
a<-table.element(a, 'Multiple Linear Regression - Estimated Regression Equation', 1, TRUE)
a<-table.row.end(a)
myeq <- colnames(x)[1]
myeq <- paste(myeq, '[t] = ', sep='')
for (i in 1:k){
if (mysum$coefficients[i,1] > 0) myeq <- paste(myeq, '+', '')
myeq <- paste(myeq, mysum$coefficients[i,1], sep=' ')
if (rownames(mysum$coefficients)[i] != '(Intercept)') {
myeq <- paste(myeq, rownames(mysum$coefficients)[i], sep='')
if (rownames(mysum$coefficients)[i] != 't') myeq <- paste(myeq, '[t]', sep='')
}
}
myeq <- paste(myeq, ' + e[t]')
a<-table.row.start(a)
a<-table.element(a, myeq)
a<-table.row.end(a)
a<-table.end(a)
table.save(a,file='mytable1.tab')
a<-table.start()
a<-table.row.start(a)
a<-table.element(a,hyperlink('ols1.htm','Multiple Linear Regression - Ordinary Least Squares',''), 6, TRUE)
a<-table.row.end(a)
a<-table.row.start(a)
a<-table.element(a,'Variable',header=TRUE)
a<-table.element(a,'Parameter',header=TRUE)
a<-table.element(a,'S.D.',header=TRUE)
a<-table.element(a,'T-STAT
H0: parameter = 0',header=TRUE)
a<-table.element(a,'2-tail p-value',header=TRUE)
a<-table.element(a,'1-tail p-value',header=TRUE)
a<-table.row.end(a)
for (i in 1:k){
a<-table.row.start(a)
a<-table.element(a,rownames(mysum$coefficients)[i],header=TRUE)
a<-table.element(a,mysum$coefficients[i,1])
a<-table.element(a, round(mysum$coefficients[i,2],6))
a<-table.element(a, round(mysum$coefficients[i,3],4))
a<-table.element(a, round(mysum$coefficients[i,4],6))
a<-table.element(a, round(mysum$coefficients[i,4]/2,6))
a<-table.row.end(a)
}
a<-table.end(a)
table.save(a,file='mytable2.tab')
a<-table.start()
a<-table.row.start(a)
a<-table.element(a, 'Multiple Linear Regression - Regression Statistics', 2, TRUE)
a<-table.row.end(a)
a<-table.row.start(a)
a<-table.element(a, 'Multiple R',1,TRUE)
a<-table.element(a, sqrt(mysum$r.squared))
a<-table.row.end(a)
a<-table.row.start(a)
a<-table.element(a, 'R-squared',1,TRUE)
a<-table.element(a, mysum$r.squared)
a<-table.row.end(a)
a<-table.row.start(a)
a<-table.element(a, 'Adjusted R-squared',1,TRUE)
a<-table.element(a, mysum$adj.r.squared)
a<-table.row.end(a)
a<-table.row.start(a)
a<-table.element(a, 'F-TEST (value)',1,TRUE)
a<-table.element(a, mysum$fstatistic[1])
a<-table.row.end(a)
a<-table.row.start(a)
a<-table.element(a, 'F-TEST (DF numerator)',1,TRUE)
a<-table.element(a, mysum$fstatistic[2])
a<-table.row.end(a)
a<-table.row.start(a)
a<-table.element(a, 'F-TEST (DF denominator)',1,TRUE)
a<-table.element(a, mysum$fstatistic[3])
a<-table.row.end(a)
a<-table.row.start(a)
a<-table.element(a, 'p-value',1,TRUE)
a<-table.element(a, 1-pf(mysum$fstatistic[1],mysum$fstatistic[2],mysum$fstatistic[3]))
a<-table.row.end(a)
a<-table.row.start(a)
a<-table.element(a, 'Multiple Linear Regression - Residual Statistics', 2, TRUE)
a<-table.row.end(a)
a<-table.row.start(a)
a<-table.element(a, 'Residual Standard Deviation',1,TRUE)
a<-table.element(a, mysum$sigma)
a<-table.row.end(a)
a<-table.row.start(a)
a<-table.element(a, 'Sum Squared Residuals',1,TRUE)
a<-table.element(a, sum(myerror*myerror))
a<-table.row.end(a)
a<-table.end(a)
table.save(a,file='mytable3.tab')
a<-table.start()
a<-table.row.start(a)
a<-table.element(a, 'Multiple Linear Regression - Actuals, Interpolation, and Residuals', 4, TRUE)
a<-table.row.end(a)
a<-table.row.start(a)
a<-table.element(a, 'Time or Index', 1, TRUE)
a<-table.element(a, 'Actuals', 1, TRUE)
a<-table.element(a, 'Interpolation
Forecast', 1, TRUE)
a<-table.element(a, 'Residuals
Prediction Error', 1, TRUE)
a<-table.row.end(a)
for (i in 1:n) {
a<-table.row.start(a)
a<-table.element(a,i, 1, TRUE)
a<-table.element(a,x[i])
a<-table.element(a,x[i]-mysum$resid[i])
a<-table.element(a,mysum$resid[i])
a<-table.row.end(a)
}
a<-table.end(a)
table.save(a,file='mytable4.tab')
if (n > n25) {
a<-table.start()
a<-table.row.start(a)
a<-table.element(a,'Goldfeld-Quandt test for Heteroskedasticity',4,TRUE)
a<-table.row.end(a)
a<-table.row.start(a)
a<-table.element(a,'p-values',header=TRUE)
a<-table.element(a,'Alternative Hypothesis',3,header=TRUE)
a<-table.row.end(a)
a<-table.row.start(a)
a<-table.element(a,'breakpoint index',header=TRUE)
a<-table.element(a,'greater',header=TRUE)
a<-table.element(a,'2-sided',header=TRUE)
a<-table.element(a,'less',header=TRUE)
a<-table.row.end(a)
for (mypoint in kp3:nmkm3) {
a<-table.row.start(a)
a<-table.element(a,mypoint,header=TRUE)
a<-table.element(a,gqarr[mypoint-kp3+1,1])
a<-table.element(a,gqarr[mypoint-kp3+1,2])
a<-table.element(a,gqarr[mypoint-kp3+1,3])
a<-table.row.end(a)
}
a<-table.end(a)
table.save(a,file='mytable5.tab')
a<-table.start()
a<-table.row.start(a)
a<-table.element(a,'Meta Analysis of Goldfeld-Quandt test for Heteroskedasticity',4,TRUE)
a<-table.row.end(a)
a<-table.row.start(a)
a<-table.element(a,'Description',header=TRUE)
a<-table.element(a,'# significant tests',header=TRUE)
a<-table.element(a,'% significant tests',header=TRUE)
a<-table.element(a,'OK/NOK',header=TRUE)
a<-table.row.end(a)
a<-table.row.start(a)
a<-table.element(a,'1% type I error level',header=TRUE)
a<-table.element(a,numsignificant1)
a<-table.element(a,numsignificant1/numgqtests)
if (numsignificant1/numgqtests < 0.01) dum <- 'OK' else dum <- 'NOK'
a<-table.element(a,dum)
a<-table.row.end(a)
a<-table.row.start(a)
a<-table.element(a,'5% type I error level',header=TRUE)
a<-table.element(a,numsignificant5)
a<-table.element(a,numsignificant5/numgqtests)
if (numsignificant5/numgqtests < 0.05) dum <- 'OK' else dum <- 'NOK'
a<-table.element(a,dum)
a<-table.row.end(a)
a<-table.row.start(a)
a<-table.element(a,'10% type I error level',header=TRUE)
a<-table.element(a,numsignificant10)
a<-table.element(a,numsignificant10/numgqtests)
if (numsignificant10/numgqtests < 0.1) dum <- 'OK' else dum <- 'NOK'
a<-table.element(a,dum)
a<-table.row.end(a)
a<-table.end(a)
table.save(a,file='mytable6.tab')
}