| Multiple Linear Regression - Estimated Regression Equation |
| Y[t] = + 101.656351098474 -0.878501125566274X[t] + e[t] |
| Multiple Linear Regression - Ordinary Least Squares | |||||
| Variable | Parameter | S.D. | T-STAT H0: parameter = 0 | 2-tail p-value | 1-tail p-value |
| (Intercept) | 101.656351098474 | 0.279527 | 363.673 | 0 | 0 |
| X | -0.878501125566274 | 0.098678 | -8.9027 | 0 | 0 |
| Multiple Linear Regression - Regression Statistics | |
| Multiple R | 0.75989485080661 |
| R-squared | 0.5774401842824 |
| Adjusted R-squared | 0.570154670218304 |
| F-TEST (value) | 79.2586740211045 |
| F-TEST (DF numerator) | 1 |
| F-TEST (DF denominator) | 58 |
| p-value | 1.91957560957690e-12 |
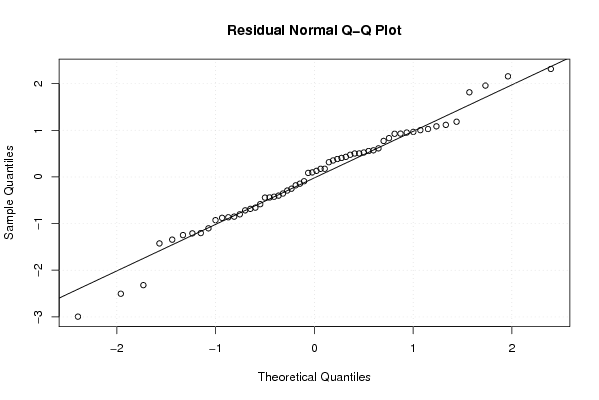
| Multiple Linear Regression - Residual Statistics | |
| Residual Standard Deviation | 1.07801618410123 |
| Sum Squared Residuals | 67.402895804682 |
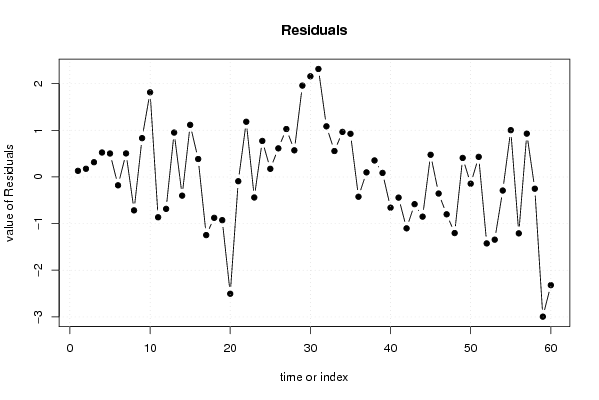
| Multiple Linear Regression - Actuals, Interpolation, and Residuals | |||
| Time or Index | Actuals | Interpolation Forecast | Residuals Prediction Error |
| 1 | 100.03 | 99.899348847342 | 0.130651152658071 |
| 2 | 100.25 | 100.075049072455 | 0.174950927544810 |
| 3 | 99.6 | 99.2843980594455 | 0.315601940554456 |
| 4 | 100.16 | 99.635798509672 | 0.524201490327948 |
| 5 | 100.49 | 99.9871989598986 | 0.502801040101436 |
| 6 | 99.72 | 99.899348847342 | -0.179348847341932 |
| 7 | 100.14 | 99.635798509672 | 0.504201490327952 |
| 8 | 98.48 | 99.196547946889 | -0.716547946888908 |
| 9 | 100.38 | 99.5479483971154 | 0.832051602884574 |
| 10 | 101.45 | 99.635798509672 | 1.81420149032795 |
| 11 | 98.42 | 99.2843980594455 | -0.864398059445537 |
| 12 | 98.6 | 99.2843980594455 | -0.684398059445544 |
| 13 | 100.06 | 99.1086978343323 | 0.951302165667718 |
| 14 | 98.62 | 99.0208477217757 | -0.400847721775652 |
| 15 | 100.84 | 99.7236486222287 | 1.11635137777133 |
| 16 | 100.02 | 99.635798509672 | 0.384201490327947 |
| 17 | 97.95 | 99.196547946889 | -1.24654794688891 |
| 18 | 98.32 | 99.196547946889 | -0.876547946888918 |
| 19 | 98.27 | 99.196547946889 | -0.926547946888916 |
| 20 | 97.22 | 99.7236486222287 | -2.50364862222868 |
| 21 | 99.28 | 99.3722481720022 | -0.092248172002165 |
| 22 | 100.38 | 99.196547946889 | 1.18345205311108 |
| 23 | 99.02 | 99.4600982845588 | -0.440098284558798 |
| 24 | 100.32 | 99.5479483971154 | 0.772051602884572 |
| 25 | 99.81 | 99.635798509672 | 0.174201490327954 |
| 26 | 100.6 | 99.9871989598986 | 0.612801040101436 |
| 27 | 101.19 | 100.162899185012 | 1.02710081498818 |
| 28 | 100.47 | 99.899348847342 | 0.570651152658068 |
| 29 | 101.77 | 99.8114987347853 | 1.95850126521469 |
| 30 | 102.32 | 100.162899185012 | 2.15710081498818 |
| 31 | 102.39 | 100.075049072455 | 2.31495092754481 |
| 32 | 101.16 | 100.075049072455 | 1.08495092754481 |
| 33 | 100.63 | 100.075049072455 | 0.55495092754481 |
| 34 | 101.48 | 100.514299635238 | 0.96570036476168 |
| 35 | 101.44 | 100.514299635238 | 0.925700364761675 |
| 36 | 100.09 | 100.514299635238 | -0.42429963523832 |
| 37 | 100.7 | 100.602149747795 | 0.0978502522050524 |
| 38 | 100.78 | 100.426449522682 | 0.353550477318306 |
| 39 | 99.81 | 99.7236486222287 | 0.0863513777713264 |
| 40 | 98.45 | 99.1086978343323 | -0.658697834332281 |
| 41 | 98.49 | 98.932997609219 | -0.442997609219034 |
| 42 | 97.48 | 98.5815971589925 | -1.10159715899252 |
| 43 | 97.91 | 98.493747046436 | -0.583747046435895 |
| 44 | 96.94 | 97.7909461459829 | -0.850946145982874 |
| 45 | 98.53 | 98.0544964836528 | 0.475503516347246 |
| 46 | 96.82 | 97.1759953580865 | -0.355995358086487 |
| 47 | 95.76 | 96.56104457019 | -0.801044570190083 |
| 48 | 95.27 | 96.4731944576335 | -1.20319445763346 |
| 49 | 97.32 | 96.9124450204166 | 0.407554979583396 |
| 50 | 96.68 | 96.82459490786 | -0.144594907859964 |
| 51 | 97.87 | 97.4395456957564 | 0.430454304243642 |
| 52 | 97.42 | 98.8451474966624 | -1.4251474966624 |
| 53 | 97.94 | 99.2843980594455 | -1.34439805944554 |
| 54 | 99.52 | 99.8114987347853 | -0.291498734785307 |
| 55 | 100.99 | 99.9871989598986 | 1.00280104010144 |
| 56 | 99.92 | 101.129250423135 | -1.20925042313471 |
| 57 | 101.97 | 101.041400310578 | 0.928599689421911 |
| 58 | 101.58 | 101.832051323588 | -0.252051323587737 |
| 59 | 99.54 | 102.534852224041 | -2.99485222404075 |
| 60 | 100.83 | 103.149803011937 | -2.31980301193715 |
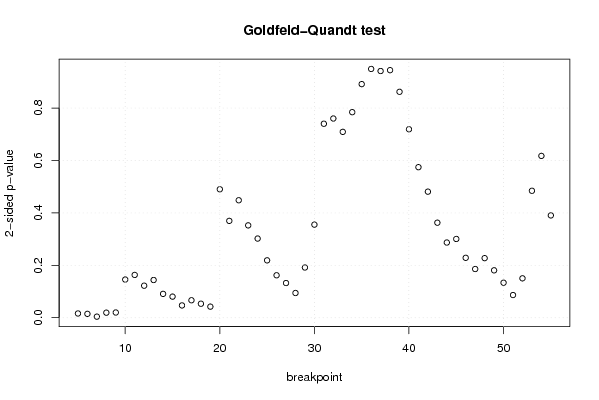
| Goldfeld-Quandt test for Heteroskedasticity | |||
| p-values | Alternative Hypothesis | ||
| breakpoint index | greater | 2-sided | less |
| 5 | 0.0081186983200256 | 0.0162373966400512 | 0.991881301679974 |
| 6 | 0.0074241283376767 | 0.0148482566753534 | 0.992575871662323 |
| 7 | 0.00205831001983873 | 0.00411662003967747 | 0.997941689980161 |
| 8 | 0.00964083925579564 | 0.0192816785115913 | 0.990359160744204 |
| 9 | 0.00997928369822485 | 0.0199585673964497 | 0.990020716301775 |
| 10 | 0.0728615680988856 | 0.145723136197771 | 0.927138431901114 |
| 11 | 0.0816919549974866 | 0.163383909994973 | 0.918308045002513 |
| 12 | 0.0611322488081268 | 0.122264497616254 | 0.938867751191873 |
| 13 | 0.0719835142720185 | 0.143967028544037 | 0.928016485727981 |
| 14 | 0.0455147350638137 | 0.0910294701276275 | 0.954485264936186 |
| 15 | 0.0402392339206905 | 0.0804784678413811 | 0.95976076607931 |
| 16 | 0.0234717900970272 | 0.0469435801940544 | 0.976528209902973 |
| 17 | 0.0333331061845356 | 0.0666662123690712 | 0.966666893815464 |
| 18 | 0.0267100321216212 | 0.0534200642432424 | 0.973289967878379 |
| 19 | 0.0211890238250689 | 0.0423780476501377 | 0.978810976174931 |
| 20 | 0.245150991851617 | 0.490301983703235 | 0.754849008148383 |
| 21 | 0.184846622726637 | 0.369693245453275 | 0.815153377273363 |
| 22 | 0.224154015899269 | 0.448308031798539 | 0.77584598410073 |
| 23 | 0.176268521281538 | 0.352537042563076 | 0.823731478718462 |
| 24 | 0.151072827759010 | 0.302145655518020 | 0.84892717224099 |
| 25 | 0.109517141843436 | 0.219034283686871 | 0.890482858156564 |
| 26 | 0.080997537485542 | 0.161995074971084 | 0.919002462514458 |
| 27 | 0.0662003732858558 | 0.132400746571712 | 0.933799626714144 |
| 28 | 0.0471965851667197 | 0.0943931703334395 | 0.95280341483328 |
| 29 | 0.0958213424364417 | 0.191642684872883 | 0.904178657563558 |
| 30 | 0.177658930802060 | 0.355317861604121 | 0.82234106919794 |
| 31 | 0.370149362022599 | 0.740298724045197 | 0.629850637977401 |
| 32 | 0.38014693378206 | 0.76029386756412 | 0.61985306621794 |
| 33 | 0.354691085540845 | 0.70938217108169 | 0.645308914459155 |
| 34 | 0.392272967815302 | 0.784545935630604 | 0.607727032184698 |
| 35 | 0.445776618976264 | 0.891553237952529 | 0.554223381023736 |
| 36 | 0.474723953263663 | 0.949447906527325 | 0.525276046736337 |
| 37 | 0.470748038687698 | 0.941496077375397 | 0.529251961312302 |
| 38 | 0.472403933014426 | 0.944807866028852 | 0.527596066985574 |
| 39 | 0.431126456378574 | 0.862252912757148 | 0.568873543621426 |
| 40 | 0.359627811184610 | 0.719255622369219 | 0.64037218881539 |
| 41 | 0.287254450254295 | 0.574508900508589 | 0.712745549745705 |
| 42 | 0.240568854633188 | 0.481137709266375 | 0.759431145366812 |
| 43 | 0.181356251857044 | 0.362712503714088 | 0.818643748142956 |
| 44 | 0.143498229531064 | 0.286996459062127 | 0.856501770468936 |
| 45 | 0.150335755260523 | 0.300671510521047 | 0.849664244739477 |
| 46 | 0.114311456357802 | 0.228622912715603 | 0.885688543642199 |
| 47 | 0.0929497019085435 | 0.185899403817087 | 0.907050298091457 |
| 48 | 0.113701860321375 | 0.22740372064275 | 0.886298139678625 |
| 49 | 0.0904704768298262 | 0.180940953659652 | 0.909529523170174 |
| 50 | 0.0668154879655338 | 0.133630975931068 | 0.933184512034466 |
| 51 | 0.043290854079309 | 0.086581708158618 | 0.95670914592069 |
| 52 | 0.075205441999986 | 0.150410883999972 | 0.924794558000014 |
| 53 | 0.242254566076618 | 0.484509132153237 | 0.757745433923382 |
| 54 | 0.308794576565860 | 0.617589153131721 | 0.69120542343414 |
| 55 | 0.195241287691061 | 0.390482575382122 | 0.804758712308939 |
| Meta Analysis of Goldfeld-Quandt test for Heteroskedasticity | |||
| Description | # significant tests | % significant tests | OK/NOK |
| 1% type I error level | 1 | 0.0196078431372549 | NOK |
| 5% type I error level | 7 | 0.137254901960784 | NOK |
| 10% type I error level | 13 | 0.254901960784314 | NOK |