| Multiple Linear Regression - Estimated Regression Equation |
| Y[t] = + 101.473296893034 -0.89729709691884X[t] + 0.968511877494062M1[t] + 0.74987074493858M2[t] + 1.24112149625985M3[t] + 0.536858770135734M4[t] + 0.558163579518627M5[t] + 0.627684621148016M6[t] + 1.16477319828442M7[t] -0.123651702024567M8[t] + 1.26970716541995M9[t] + 1.41512009092609M10[t] -0.0756291577526306M11[t] -0.0152507513212727t + e[t] |
| Multiple Linear Regression - Ordinary Least Squares | |||||
| Variable | Parameter | S.D. | T-STAT H0: parameter = 0 | 2-tail p-value | 1-tail p-value |
| (Intercept) | 101.473296893034 | 0.556211 | 182.4368 | 0 | 0 |
| X | -0.89729709691884 | 0.092424 | -9.7085 | 0 | 0 |
| M1 | 0.968511877494062 | 0.640517 | 1.5121 | 0.137354 | 0.068677 |
| M2 | 0.74987074493858 | 0.639196 | 1.1731 | 0.246776 | 0.123388 |
| M3 | 1.24112149625985 | 0.638313 | 1.9444 | 0.05798 | 0.02899 |
| M4 | 0.536858770135734 | 0.636233 | 0.8438 | 0.403143 | 0.201572 |
| M5 | 0.558163579518627 | 0.635419 | 0.8784 | 0.384282 | 0.192141 |
| M6 | 0.627684621148016 | 0.634317 | 0.9895 | 0.327574 | 0.163787 |
| M7 | 1.16477319828442 | 0.634082 | 1.8369 | 0.072684 | 0.036342 |
| M8 | -0.123651702024567 | 0.633154 | -0.1953 | 0.846022 | 0.423011 |
| M9 | 1.26970716541995 | 0.632701 | 2.0068 | 0.050669 | 0.025334 |
| M10 | 1.41512009092609 | 0.632323 | 2.238 | 0.030106 | 0.015053 |
| M11 | -0.0756291577526306 | 0.63218 | -0.1196 | 0.905295 | 0.452648 |
| t | -0.0152507513212727 | 0.007606 | -2.005 | 0.050866 | 0.025433 |
| Multiple Linear Regression - Regression Statistics | |
| Multiple R | 0.843822817706935 |
| R-squared | 0.712036947682871 |
| Adjusted R-squared | 0.630656085071508 |
| F-TEST (value) | 8.74943966965834 |
| F-TEST (DF numerator) | 13 |
| F-TEST (DF denominator) | 46 |
| p-value | 1.36955831120389e-08 |
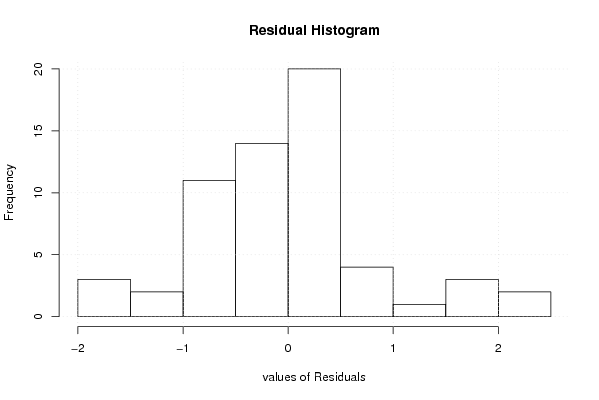
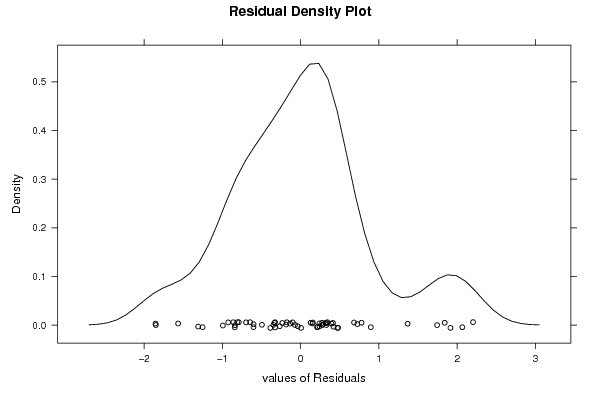
| Multiple Linear Regression - Residual Statistics | |
| Residual Standard Deviation | 0.999274140497838 |
| Sum Squared Residuals | 45.9332451619139 |
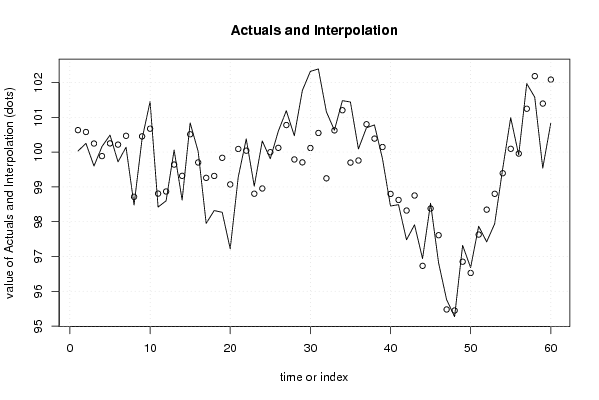
| Multiple Linear Regression - Actuals, Interpolation, and Residuals | |||
| Time or Index | Actuals | Interpolation Forecast | Residuals Prediction Error |
| 1 | 100.03 | 100.631963825369 | -0.601963825368862 |
| 2 | 100.25 | 100.577531360876 | -0.327531360875884 |
| 3 | 99.6 | 100.245963973649 | -0.645963973648927 |
| 4 | 100.16 | 99.885369334971 | 0.274630665028931 |
| 5 | 100.49 | 100.250342231800 | 0.239657768199771 |
| 6 | 99.72 | 100.214882812416 | -0.494882812416457 |
| 7 | 100.14 | 100.467531509156 | -0.327531509155934 |
| 8 | 98.48 | 98.7152073090663 | -0.235207309066252 |
| 9 | 100.38 | 100.452234263957 | -0.0722342639570395 |
| 10 | 101.45 | 100.672126147834 | 0.777873852166214 |
| 11 | 98.42 | 98.8072073090663 | -0.387207309066256 |
| 12 | 98.6 | 98.8675857154976 | -0.267585715497621 |
| 13 | 100.06 | 99.6413874222866 | 0.418612577713367 |
| 14 | 98.62 | 99.317765828718 | -0.697765828717993 |
| 15 | 100.84 | 100.511603506253 | 0.328396493746934 |
| 16 | 100.02 | 99.7023603191158 | 0.317639680884203 |
| 17 | 97.95 | 99.259765828718 | -1.30976582871799 |
| 18 | 98.32 | 99.3140361190261 | -0.994036119026117 |
| 19 | 98.27 | 99.8358739448412 | -1.56587394484124 |
| 20 | 97.22 | 99.0705765513623 | -1.85057655136229 |
| 21 | 99.28 | 100.089765828718 | -0.809765828717994 |
| 22 | 100.38 | 100.040468583519 | 0.339531416480898 |
| 23 | 99.02 | 98.8036577125948 | 0.216342287405244 |
| 24 | 100.32 | 98.953765828718 | 1.366234171282 |
| 25 | 99.81 | 99.9967566645827 | -0.186756664582665 |
| 26 | 100.6 | 100.121783619473 | 0.478216380526545 |
| 27 | 101.19 | 100.777243038857 | 0.41275696114278 |
| 28 | 100.47 | 99.7885404323362 | 0.681459567663826 |
| 29 | 101.77 | 99.704864780706 | 2.06513521929409 |
| 30 | 102.32 | 100.118053909782 | 2.20194609021843 |
| 31 | 102.39 | 100.550162025905 | 1.83983797409519 |
| 32 | 101.16 | 99.2464863742746 | 1.91351362572545 |
| 33 | 100.63 | 100.624594490398 | 0.0054055096022002 |
| 34 | 101.48 | 101.203405213042 | 0.276594786957919 |
| 35 | 101.44 | 99.697405213042 | 1.74259478695791 |
| 36 | 100.09 | 99.7577836194734 | 0.332216380526557 |
| 37 | 100.7 | 100.800774455338 | -0.100774455338116 |
| 38 | 100.78 | 100.387423152078 | 0.392576847922404 |
| 39 | 99.81 | 100.145585474543 | -0.335585474542523 |
| 40 | 98.45 | 98.797964029254 | -0.347964029253941 |
| 41 | 98.49 | 98.6245586679318 | -0.134558667931802 |
| 42 | 97.48 | 98.3199101194724 | -0.839910119472372 |
| 43 | 97.91 | 98.7520182355956 | -0.842018235595627 |
| 44 | 96.94 | 96.7305049064303 | 0.209495093569705 |
| 45 | 98.53 | 98.3778021516292 | 0.152197848370811 |
| 46 | 96.82 | 97.6106672288952 | -0.790667228895227 |
| 47 | 95.76 | 95.476559261052 | 0.283440738947971 |
| 48 | 95.27 | 95.4472079577915 | -0.177207957791512 |
| 49 | 97.32 | 96.8491176324237 | 0.470882367576276 |
| 50 | 96.68 | 96.525496038855 | 0.154503961144927 |
| 51 | 97.87 | 97.6296040066983 | 0.240395993301737 |
| 52 | 97.42 | 98.345765884323 | -0.925765884323018 |
| 53 | 97.94 | 98.800468490844 | -0.860468490844063 |
| 54 | 99.52 | 99.3931170393035 | 0.126882960696515 |
| 55 | 100.99 | 100.094414284502 | 0.895585715497615 |
| 56 | 99.92 | 99.9572248588666 | -0.0372248588666119 |
| 57 | 101.97 | 101.245603265298 | 0.724396734702024 |
| 58 | 101.58 | 102.183332826710 | -0.603332826709803 |
| 59 | 99.54 | 101.395170504245 | -1.85517050424487 |
| 60 | 100.83 | 102.083656878519 | -1.25365687851942 |
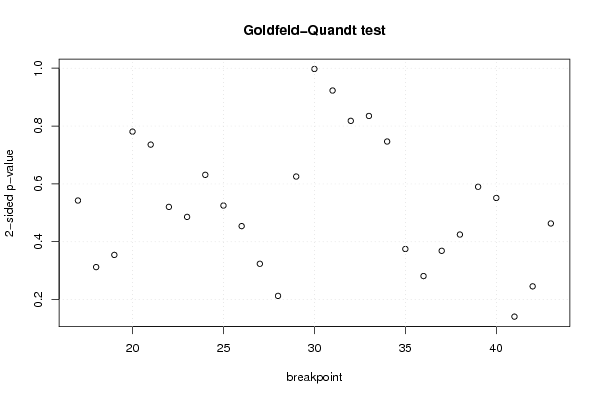
| Goldfeld-Quandt test for Heteroskedasticity | |||
| p-values | Alternative Hypothesis | ||
| breakpoint index | greater | 2-sided | less |
| 17 | 0.271221434618069 | 0.542442869236138 | 0.728778565381931 |
| 18 | 0.156114203898486 | 0.312228407796972 | 0.843885796101514 |
| 19 | 0.177168749900818 | 0.354337499801636 | 0.822831250099182 |
| 20 | 0.390348023555196 | 0.780696047110392 | 0.609651976444804 |
| 21 | 0.367895274601237 | 0.735790549202475 | 0.632104725398763 |
| 22 | 0.260201350094769 | 0.520402700189538 | 0.73979864990523 |
| 23 | 0.242886073159631 | 0.485772146319261 | 0.757113926840369 |
| 24 | 0.315638318418779 | 0.631276636837558 | 0.684361681581221 |
| 25 | 0.262536951967122 | 0.525073903934244 | 0.737463048032878 |
| 26 | 0.226951376153116 | 0.453902752306233 | 0.773048623846884 |
| 27 | 0.161823785363718 | 0.323647570727435 | 0.838176214636282 |
| 28 | 0.106278569345358 | 0.212557138690716 | 0.893721430654642 |
| 29 | 0.312685870583488 | 0.625371741166976 | 0.687314129416512 |
| 30 | 0.50123960377891 | 0.99752079244218 | 0.49876039622109 |
| 31 | 0.538565801656229 | 0.922868396687541 | 0.461434198343771 |
| 32 | 0.590982668331706 | 0.818034663336589 | 0.409017331668294 |
| 33 | 0.582537218763222 | 0.834925562473556 | 0.417462781236778 |
| 34 | 0.626738711813289 | 0.746522576373422 | 0.373261288186711 |
| 35 | 0.812593798941816 | 0.374812402116367 | 0.187406201058184 |
| 36 | 0.859397910388936 | 0.281204179222127 | 0.140602089611064 |
| 37 | 0.815732424709654 | 0.368535150580692 | 0.184267575290346 |
| 38 | 0.787598951209153 | 0.424802097581694 | 0.212401048790847 |
| 39 | 0.705019396323322 | 0.589961207353356 | 0.294980603676678 |
| 40 | 0.724329704091617 | 0.551340591816766 | 0.275670295908383 |
| 41 | 0.929599789817204 | 0.140800420365591 | 0.0704002101827955 |
| 42 | 0.877188441099517 | 0.245623117800966 | 0.122811558900483 |
| 43 | 0.768436572039401 | 0.463126855921197 | 0.231563427960599 |
| Meta Analysis of Goldfeld-Quandt test for Heteroskedasticity | |||
| Description | # significant tests | % significant tests | OK/NOK |
| 1% type I error level | 0 | 0 | OK |
| 5% type I error level | 0 | 0 | OK |
| 10% type I error level | 0 | 0 | OK |