| Multiple Linear Regression - Estimated Regression Equation |
| Y[t] = + 52.9237129088855 -0.456561313045817X[t] + 0.529784539853996Y1[t] + 0.00162859374509381Y2[t] + 0.211227162008023Y3[t] -0.268925741424594Y4[t] + 0.779715739410484M1[t] + 0.72084508465959M2[t] + 1.39416708889035M3[t] -0.251540990310942M4[t] + 1.76147716754322M5[t] + 1.11916991858972M6[t] -0.0997453594323863M7[t] + 0.207964494807340M8[t] + 1.42410413266541M9[t] + 1.02998559517508M10[t] + 1.50184215778441M11[t] -0.00838297611828369t + e[t] |
| Multiple Linear Regression - Ordinary Least Squares | |||||
| Variable | Parameter | S.D. | T-STAT H0: parameter = 0 | 2-tail p-value | 1-tail p-value |
| (Intercept) | 52.9237129088855 | 13.880394 | 3.8128 | 0.00049 | 0.000245 |
| X | -0.456561313045817 | 0.136277 | -3.3502 | 0.001834 | 0.000917 |
| Y1 | 0.529784539853996 | 0.150924 | 3.5103 | 0.001171 | 0.000585 |
| Y2 | 0.00162859374509381 | 0.169852 | 0.0096 | 0.9924 | 0.4962 |
| Y3 | 0.211227162008023 | 0.165712 | 1.2747 | 0.210167 | 0.105083 |
| Y4 | -0.268925741424594 | 0.139164 | -1.9324 | 0.060785 | 0.030393 |
| M1 | 0.779715739410484 | 0.631015 | 1.2357 | 0.224172 | 0.112086 |
| M2 | 0.72084508465959 | 0.604075 | 1.1933 | 0.240147 | 0.120074 |
| M3 | 1.39416708889035 | 0.62547 | 2.229 | 0.031805 | 0.015902 |
| M4 | -0.251540990310942 | 0.599557 | -0.4195 | 0.677181 | 0.33859 |
| M5 | 1.76147716754322 | 0.654977 | 2.6894 | 0.010573 | 0.005287 |
| M6 | 1.11916991858972 | 0.607961 | 1.8409 | 0.07346 | 0.03673 |
| M7 | -0.0997453594323863 | 0.66993 | -0.1489 | 0.882428 | 0.441214 |
| M8 | 0.207964494807340 | 0.660939 | 0.3147 | 0.754748 | 0.377374 |
| M9 | 1.42410413266541 | 0.661141 | 2.154 | 0.037645 | 0.018823 |
| M10 | 1.02998559517508 | 0.684813 | 1.504 | 0.140838 | 0.070419 |
| M11 | 1.50184215778441 | 0.655248 | 2.292 | 0.027535 | 0.013767 |
| t | -0.00838297611828369 | 0.008107 | -1.0341 | 0.30764 | 0.15382 |
| Multiple Linear Regression - Regression Statistics | |
| Multiple R | 0.904112399567176 |
| R-squared | 0.817419231051118 |
| Adjusted R-squared | 0.735738360731881 |
| F-TEST (value) | 10.0074745513406 |
| F-TEST (DF numerator) | 17 |
| F-TEST (DF denominator) | 38 |
| p-value | 2.72499856013297e-09 |
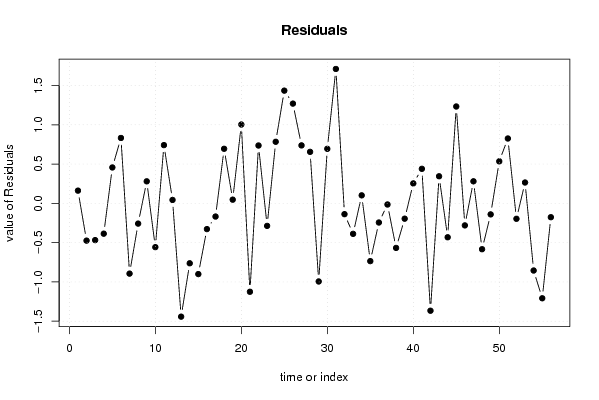
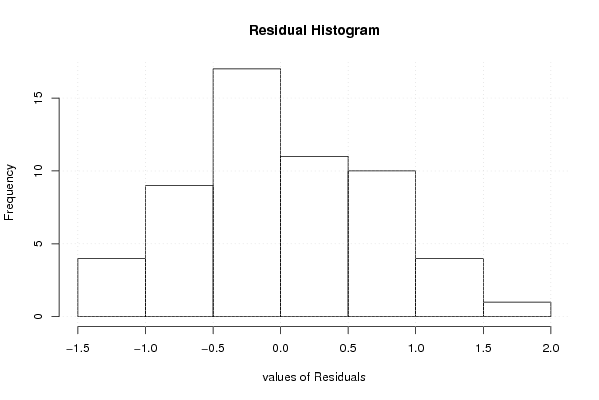
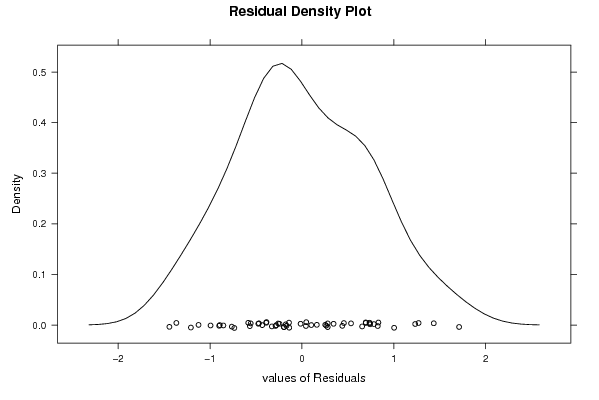
| Multiple Linear Regression - Residual Statistics | |
| Residual Standard Deviation | 0.871677777536568 |
| Sum Squared Residuals | 28.8732416183414 |
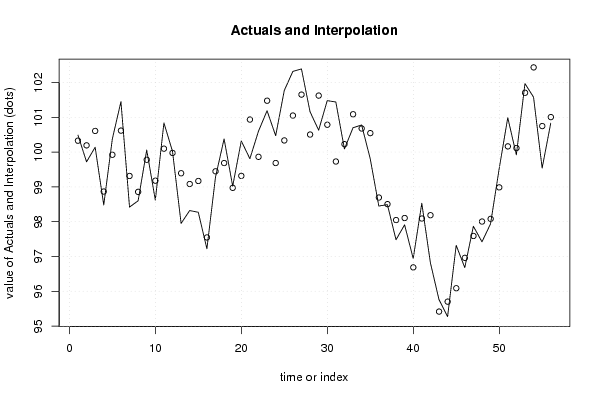
| Multiple Linear Regression - Actuals, Interpolation, and Residuals | |||
| Time or Index | Actuals | Interpolation Forecast | Residuals Prediction Error |
| 1 | 100.49 | 100.327887702781 | 0.162112297219314 |
| 2 | 99.72 | 100.194257532837 | -0.474257532837242 |
| 3 | 100.14 | 100.607920449935 | -0.467920449934754 |
| 4 | 98.48 | 98.865910775912 | -0.385910775912100 |
| 5 | 100.38 | 99.9230217466653 | 0.456978253334675 |
| 6 | 101.45 | 100.617663041944 | 0.832336958055842 |
| 7 | 98.42 | 99.3141181480133 | -0.894118148013252 |
| 8 | 98.6 | 98.8576888042644 | -0.257688804264411 |
| 9 | 100.06 | 99.779613936163 | 0.280386063837036 |
| 10 | 98.62 | 99.1774660221021 | -0.5574660221021 |
| 11 | 100.84 | 100.098542554186 | 0.741457445814154 |
| 12 | 100.02 | 99.9764228155368 | 0.043577184463196 |
| 13 | 97.95 | 99.3918683819685 | -1.44186838196845 |
| 14 | 98.32 | 99.0828026740398 | -0.762802674039766 |
| 15 | 98.27 | 99.1701693740367 | -0.900169374036691 |
| 16 | 97.22 | 97.5474073418492 | -0.32740734184915 |
| 17 | 99.28 | 99.4478931365246 | -0.167893136524621 |
| 18 | 100.38 | 99.685472895083 | 0.694527104916929 |
| 19 | 99.02 | 98.9729186987735 | 0.0470813012264834 |
| 20 | 100.32 | 99.31668616935 | 1.00331383064994 |
| 21 | 99.81 | 100.934966827585 | -1.12496682758545 |
| 22 | 100.6 | 99.8639296398403 | 0.736070360159702 |
| 23 | 101.19 | 101.476749011563 | -0.286749011563036 |
| 24 | 100.47 | 99.686085634843 | 0.783914365156985 |
| 25 | 101.77 | 100.335299854558 | 1.43470014544176 |
| 26 | 102.32 | 101.050390753080 | 1.26960924691957 |
| 27 | 102.39 | 101.652422574590 | 0.737577425409654 |
| 28 | 101.16 | 100.504534008056 | 0.655465991943504 |
| 29 | 100.63 | 101.624219682587 | -0.99421968258655 |
| 30 | 101.48 | 100.785897881166 | 0.694102118834376 |
| 31 | 101.44 | 99.7294191200466 | 1.71058087995335 |
| 32 | 100.09 | 100.227767187345 | -0.137767187345252 |
| 33 | 100.7 | 101.087979438499 | -0.387979438498780 |
| 34 | 100.78 | 100.678099663345 | 0.101900336655159 |
| 35 | 99.81 | 100.545300765718 | -0.735300765718213 |
| 36 | 98.45 | 98.6936203162728 | -0.24362031627277 |
| 37 | 98.49 | 98.5044075775133 | -0.0144075775132797 |
| 38 | 97.48 | 98.0471015090648 | -0.567101509064845 |
| 39 | 97.91 | 98.104956193221 | -0.194956193220964 |
| 40 | 96.94 | 96.6859666547372 | 0.25403334526283 |
| 41 | 98.53 | 98.0902830587537 | 0.439716941246282 |
| 42 | 96.82 | 98.1862518815735 | -1.36625188157353 |
| 43 | 95.76 | 95.415490193245 | 0.344509806754938 |
| 44 | 95.27 | 95.7015135892872 | -0.431513589287205 |
| 45 | 97.32 | 96.0874397977528 | 1.23256020224719 |
| 46 | 96.68 | 96.9605046747128 | -0.280504674712759 |
| 47 | 97.87 | 97.5894076685329 | 0.280592331467096 |
| 48 | 97.42 | 98.0038712333474 | -0.583871233347412 |
| 49 | 97.94 | 98.0805364831793 | -0.140536483179338 |
| 50 | 99.52 | 98.9854475309777 | 0.534552469022281 |
| 51 | 100.99 | 100.164531408217 | 0.825468591782755 |
| 52 | 99.92 | 100.116181219445 | -0.196181219445085 |
| 53 | 101.97 | 101.704582375470 | 0.265417624530215 |
| 54 | 101.58 | 102.434714300234 | -0.854714300233616 |
| 55 | 99.54 | 100.748053839922 | -1.20805383992152 |
| 56 | 100.83 | 101.006344249753 | -0.176344249753068 |
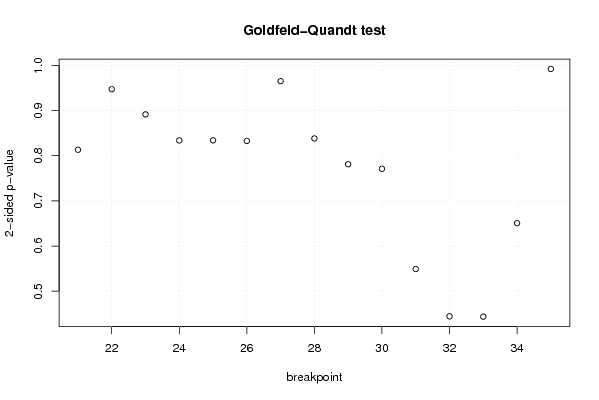
| Goldfeld-Quandt test for Heteroskedasticity | |||
| p-values | Alternative Hypothesis | ||
| breakpoint index | greater | 2-sided | less |
| 21 | 0.593475660422072 | 0.813048679155856 | 0.406524339577928 |
| 22 | 0.473498161661901 | 0.946996323323802 | 0.526501838338099 |
| 23 | 0.445663568857683 | 0.891327137715367 | 0.554336431142317 |
| 24 | 0.416825557649025 | 0.83365111529805 | 0.583174442350975 |
| 25 | 0.583074056802449 | 0.833851886395102 | 0.416925943197551 |
| 26 | 0.58369702741661 | 0.832605945166779 | 0.416302972583389 |
| 27 | 0.482413061559585 | 0.96482612311917 | 0.517586938440415 |
| 28 | 0.418984965646474 | 0.837969931292949 | 0.581015034353526 |
| 29 | 0.609556527386277 | 0.780886945227447 | 0.390443472613723 |
| 30 | 0.614564307178687 | 0.770871385642627 | 0.385435692821313 |
| 31 | 0.725467682453386 | 0.549064635093227 | 0.274532317546614 |
| 32 | 0.777811566458133 | 0.444376867083734 | 0.222188433541867 |
| 33 | 0.7781744549891 | 0.4436510900218 | 0.2218255450109 |
| 34 | 0.674735376359363 | 0.650529247281274 | 0.325264623640637 |
| 35 | 0.495918592245693 | 0.991837184491385 | 0.504081407754307 |
| Meta Analysis of Goldfeld-Quandt test for Heteroskedasticity | |||
| Description | # significant tests | % significant tests | OK/NOK |
| 1% type I error level | 0 | 0 | OK |
| 5% type I error level | 0 | 0 | OK |
| 10% type I error level | 0 | 0 | OK |