| Multiple Linear Regression - Estimated Regression Equation |
| Y[t] = + 59.5323076923077 -7.21057692307693X[t] -0.712996794871812M1[t] -0.199326923076930M2[t] -0.373605769230770M3[t] -0.527884615384615M4[t] -0.682163461538468M5[t] -0.616442307692312M6[t] + 0.97139423076923M7[t] + 0.817115384615381M8[t] + 0.582836538461533M9[t] + 0.408557692307688M10[t] + 0.234278846153841M11[t] -0.325721153846153t + e[t] |
| Multiple Linear Regression - Ordinary Least Squares | |||||
| Variable | Parameter | S.D. | T-STAT H0: parameter = 0 | 2-tail p-value | 1-tail p-value |
| (Intercept) | 59.5323076923077 | 2.823153 | 21.0872 | 0 | 0 |
| X | -7.21057692307693 | 2.725502 | -2.6456 | 0.011056 | 0.005528 |
| M1 | -0.712996794871812 | 3.168376 | -0.225 | 0.822927 | 0.411464 |
| M2 | -0.199326923076930 | 3.327191 | -0.0599 | 0.952483 | 0.476241 |
| M3 | -0.373605769230770 | 3.321148 | -0.1125 | 0.910912 | 0.455456 |
| M4 | -0.527884615384615 | 3.316887 | -0.1592 | 0.874232 | 0.437116 |
| M5 | -0.682163461538468 | 3.314416 | -0.2058 | 0.837823 | 0.418911 |
| M6 | -0.616442307692312 | 3.313739 | -0.186 | 0.853225 | 0.426612 |
| M7 | 0.97139423076923 | 3.324947 | 0.2922 | 0.771455 | 0.385728 |
| M8 | 0.817115384615381 | 3.316887 | 0.2464 | 0.806484 | 0.403242 |
| M9 | 0.582836538461533 | 3.310606 | 0.1761 | 0.86101 | 0.430505 |
| M10 | 0.408557692307688 | 3.306111 | 0.1236 | 0.902178 | 0.451089 |
| M11 | 0.234278846153841 | 3.303412 | 0.0709 | 0.943762 | 0.471881 |
| t | -0.325721153846153 | 0.07712 | -4.2235 | 0.000109 | 5.5e-05 |
| Multiple Linear Regression - Regression Statistics | |
| Multiple R | 0.890912068408306 |
| R-squared | 0.793724313635566 |
| Adjusted R-squared | 0.736669336556041 |
| F-TEST (value) | 13.9115701077095 |
| F-TEST (DF numerator) | 13 |
| F-TEST (DF denominator) | 47 |
| p-value | 5.62927482405939e-12 |
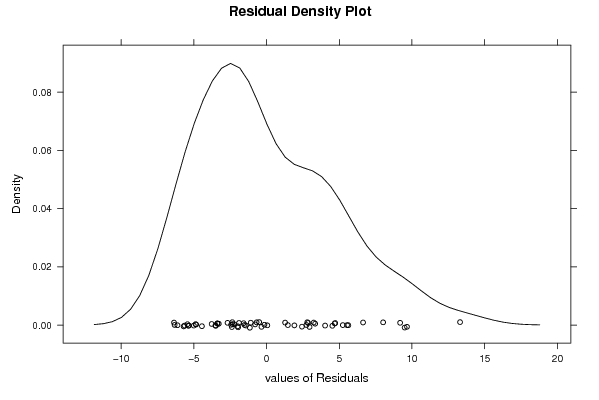
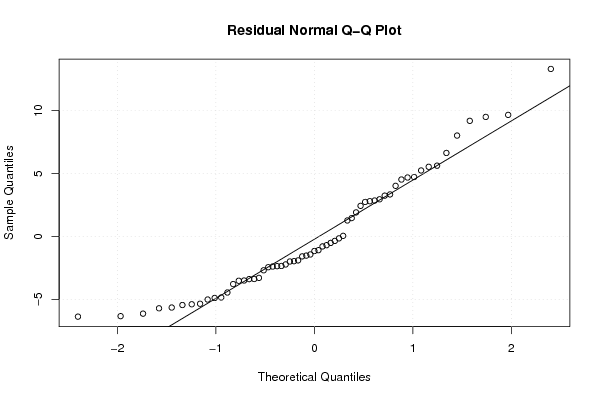
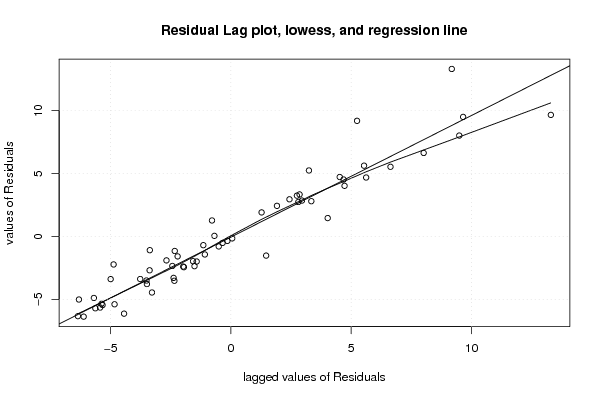
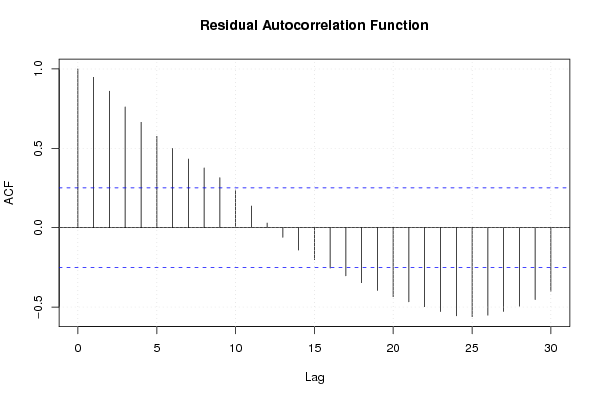
| Multiple Linear Regression - Residual Statistics | |
| Residual Standard Deviation | 5.22172889694719 |
| Sum Squared Residuals | 1281.52327564103 |
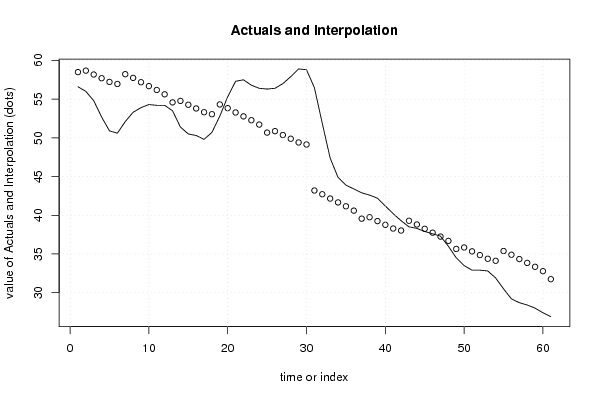
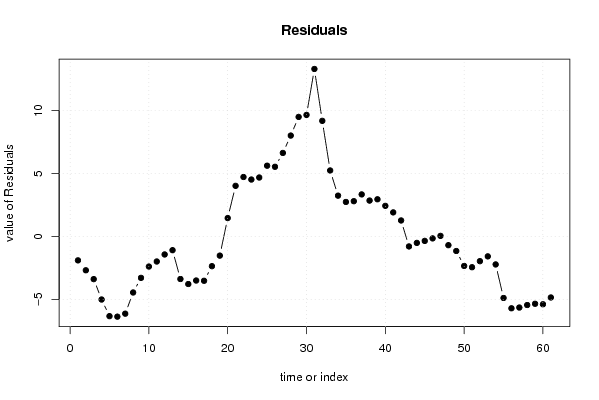
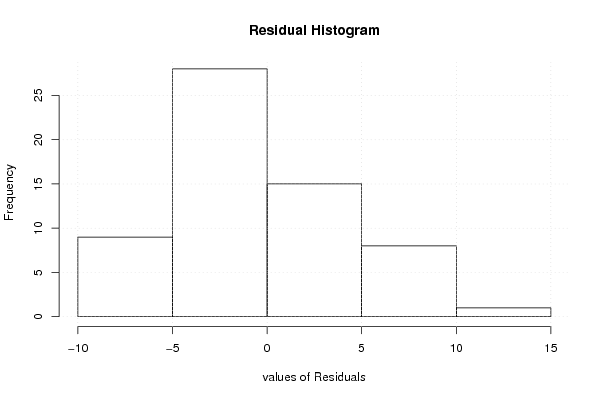
| Multiple Linear Regression - Actuals, Interpolation, and Residuals | |||
| Time or Index | Actuals | Interpolation Forecast | Residuals Prediction Error |
| 1 | 56.6 | 58.4935897435898 | -1.8935897435898 |
| 2 | 56 | 58.6815384615385 | -2.68153846153848 |
| 3 | 54.8 | 58.1815384615385 | -3.38153846153846 |
| 4 | 52.7 | 57.7015384615385 | -5.00153846153845 |
| 5 | 50.9 | 57.2215384615385 | -6.32153846153846 |
| 6 | 50.6 | 56.9615384615385 | -6.36153846153846 |
| 7 | 52.1 | 58.2236538461538 | -6.12365384615384 |
| 8 | 53.3 | 57.7436538461538 | -4.44365384615384 |
| 9 | 53.9 | 57.1836538461538 | -3.28365384615384 |
| 10 | 54.3 | 56.6836538461538 | -2.38365384615385 |
| 11 | 54.2 | 56.1836538461538 | -1.98365384615384 |
| 12 | 54.2 | 55.6236538461539 | -1.42365384615385 |
| 13 | 53.5 | 54.5849358974359 | -1.08493589743588 |
| 14 | 51.4 | 54.7728846153846 | -3.3728846153846 |
| 15 | 50.5 | 54.2728846153846 | -3.77288461538461 |
| 16 | 50.3 | 53.7928846153846 | -3.49288461538462 |
| 17 | 49.8 | 53.3128846153846 | -3.51288461538461 |
| 18 | 50.7 | 53.0528846153846 | -2.35288461538461 |
| 19 | 52.8 | 54.315 | -1.51500000000000 |
| 20 | 55.3 | 53.835 | 1.46500000000000 |
| 21 | 57.3 | 53.275 | 4.025 |
| 22 | 57.5 | 52.775 | 4.725 |
| 23 | 56.8 | 52.275 | 4.525 |
| 24 | 56.4 | 51.715 | 4.68499999999999 |
| 25 | 56.3 | 50.676282051282 | 5.62371794871796 |
| 26 | 56.4 | 50.8642307692308 | 5.53576923076923 |
| 27 | 57 | 50.3642307692308 | 6.63576923076923 |
| 28 | 57.9 | 49.8842307692308 | 8.01576923076922 |
| 29 | 58.9 | 49.4042307692308 | 9.49576923076923 |
| 30 | 58.8 | 49.1442307692308 | 9.65576923076923 |
| 31 | 56.5 | 43.1957692307692 | 13.3042307692308 |
| 32 | 51.9 | 42.7157692307692 | 9.18423076923077 |
| 33 | 47.4 | 42.1557692307692 | 5.24423076923077 |
| 34 | 44.9 | 41.6557692307692 | 3.24423076923077 |
| 35 | 43.9 | 41.1557692307692 | 2.74423076923077 |
| 36 | 43.4 | 40.5957692307692 | 2.80423076923077 |
| 37 | 42.9 | 39.5570512820513 | 3.34294871794873 |
| 38 | 42.6 | 39.745 | 2.85500000000000 |
| 39 | 42.2 | 39.245 | 2.95500000000000 |
| 40 | 41.2 | 38.765 | 2.435 |
| 41 | 40.2 | 38.285 | 1.91500000000001 |
| 42 | 39.3 | 38.025 | 1.27500000000000 |
| 43 | 38.5 | 39.2871153846154 | -0.787115384615385 |
| 44 | 38.3 | 38.8071153846154 | -0.507115384615387 |
| 45 | 37.9 | 38.2471153846154 | -0.347115384615384 |
| 46 | 37.6 | 37.7471153846154 | -0.147115384615383 |
| 47 | 37.3 | 37.2471153846154 | 0.0528846153846132 |
| 48 | 36 | 36.6871153846154 | -0.68711538461539 |
| 49 | 34.5 | 35.6483974358974 | -1.14839743589742 |
| 50 | 33.5 | 35.8363461538462 | -2.33634615384615 |
| 51 | 32.9 | 35.3363461538462 | -2.43634615384616 |
| 52 | 32.9 | 34.8563461538462 | -1.95634615384616 |
| 53 | 32.8 | 34.3763461538462 | -1.57634615384616 |
| 54 | 31.9 | 34.1163461538462 | -2.21634615384616 |
| 55 | 30.5 | 35.3784615384615 | -4.87846153846154 |
| 56 | 29.2 | 34.8984615384615 | -5.69846153846154 |
| 57 | 28.7 | 34.3384615384615 | -5.63846153846154 |
| 58 | 28.4 | 33.8384615384615 | -5.43846153846155 |
| 59 | 28 | 33.3384615384615 | -5.33846153846154 |
| 60 | 27.4 | 32.7784615384615 | -5.37846153846155 |
| 61 | 26.9 | 31.7397435897436 | -4.83974358974358 |
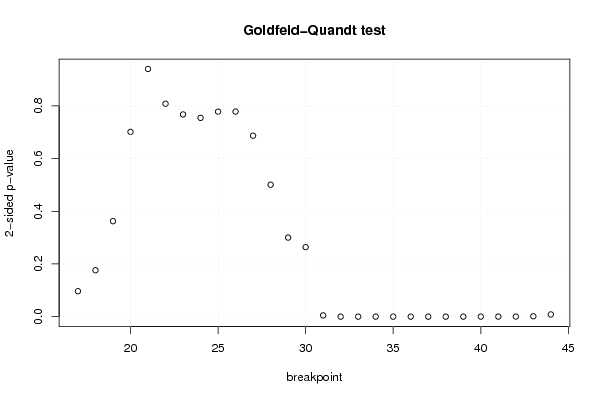
| Goldfeld-Quandt test for Heteroskedasticity | |||
| p-values | Alternative Hypothesis | ||
| breakpoint index | greater | 2-sided | less |
| 17 | 0.0483488559345309 | 0.0966977118690618 | 0.95165114406547 |
| 18 | 0.0881075550456606 | 0.176215110091321 | 0.91189244495434 |
| 19 | 0.181295369832739 | 0.362590739665477 | 0.818704630167261 |
| 20 | 0.350919507987495 | 0.701839015974991 | 0.649080492012505 |
| 21 | 0.529734498276983 | 0.940531003446035 | 0.470265501723017 |
| 22 | 0.595748985459407 | 0.808502029081187 | 0.404251014540593 |
| 23 | 0.616085370667871 | 0.767829258664258 | 0.383914629332129 |
| 24 | 0.622665214468901 | 0.754669571062197 | 0.377334785531099 |
| 25 | 0.610822301166607 | 0.778355397666786 | 0.389177698833393 |
| 26 | 0.610632312469551 | 0.778735375060899 | 0.389367687530449 |
| 27 | 0.656447364275127 | 0.687105271449745 | 0.343552635724873 |
| 28 | 0.74947833017448 | 0.50104333965104 | 0.25052166982552 |
| 29 | 0.849864762706242 | 0.300270474587516 | 0.150135237293758 |
| 30 | 0.868067390972918 | 0.263865218054163 | 0.131932609027082 |
| 31 | 0.997634103306655 | 0.00473179338668961 | 0.00236589669334480 |
| 32 | 0.999999092262164 | 1.81547567208814e-06 | 9.0773783604407e-07 |
| 33 | 0.999999899103557 | 2.01792885263215e-07 | 1.00896442631608e-07 |
| 34 | 0.999999868452973 | 2.63094055117641e-07 | 1.31547027558821e-07 |
| 35 | 0.999999892562385 | 2.14875230803867e-07 | 1.07437615401934e-07 |
| 36 | 0.999999805774392 | 3.88451216032274e-07 | 1.94225608016137e-07 |
| 37 | 0.999999439089218 | 1.12182156397282e-06 | 5.60910781986408e-07 |
| 38 | 0.999997748490339 | 4.50301932283994e-06 | 2.25150966141997e-06 |
| 39 | 0.999992379649404 | 1.52407011921703e-05 | 7.62035059608513e-06 |
| 40 | 0.99995744890651 | 8.51021869808447e-05 | 4.25510934904223e-05 |
| 41 | 0.99988780953477 | 0.000224380930460671 | 0.000112190465230336 |
| 42 | 0.999785319417124 | 0.000429361165752509 | 0.000214680582876255 |
| 43 | 0.999320921971202 | 0.00135815605759561 | 0.000679078028797807 |
| 44 | 0.995780306227428 | 0.00843938754514336 | 0.00421969377257168 |
| Meta Analysis of Goldfeld-Quandt test for Heteroskedasticity | |||
| Description | # significant tests | % significant tests | OK/NOK |
| 1% type I error level | 14 | 0.5 | NOK |
| 5% type I error level | 14 | 0.5 | NOK |
| 10% type I error level | 15 | 0.535714285714286 | NOK |