Free Statistics

of Irreproducible Research!

Author's title

Author*The author of this computation has been verified*
R Software Modulerwasp_multipleregression.wasp
Title produced by softwareMultiple Regression
Date of computationFri, 20 Nov 2009 00:55:13 -0700
Cite this page as followsStatistical Computations at FreeStatistics.org, Office for Research Development and Education, URL https://freestatistics.org/blog/index.php?v=date/2009/Nov/20/t1258706956axd0lmntberhas7.htm/, Retrieved Fri, 19 Apr 2024 19:16:51 +0000
Statistical Computations at FreeStatistics.org, Office for Research Development and Education, URL https://freestatistics.org/blog/index.php?pk=57984, Retrieved Fri, 19 Apr 2024 19:16:51 +0000
QR Codes:

Original text written by user:
IsPrivate?No (this computation is public)
User-defined keywords
Estimated Impact175
Family? (F = Feedback message, R = changed R code, M = changed R Module, P = changed Parameters, D = changed Data)
-       [Multiple Regression] [] [2009-11-20 07:55:13] [d5175f34d1f80375edd7cbd8232724fe] [Current]
Feedback Forum

Post a new message
Dataseries X:
8.2	267722
8	266003
7.9	262971
7.6	265521
7.6	264676
8.3	270223
8.4	269508
8.4	268457
8.4	265814
8.4	266680
8.6	263018
8.9	269285
8.8	269829
8.3	270911
7.5	266844
7.2	271244
7.4	269907
8.8	271296
9.3	270157
9.3	271322
8.7	267179
8.2	264101
8.3	265518
8.5	269419
8.6	268714
8.5	272482
8.2	268351
8.1	268175
7.9	270674
8.6	272764
8.7	272599
8.7	270333
8.5	270846
8.4	270491
8.5	269160
8.7	274027
8.7	273784
8.6	276663
8.5	274525
8.3	271344
8	271115
8.2	270798
8.1	273911
8.1	273985
8	271917
7.9	273338
7.9	270601
8	273547
8	275363
7.9	281229
8	277793
7.7	279913
7.2	282500
7.5	280041
7.3	282166
7	290304
7	283519
7	287816
7.2	285226
7.3	287595


Summary of computational transaction
Raw Inputview raw input (R code)
Raw Outputview raw output of R engine
Computing time4 seconds
R Server'Gwilym Jenkins' @ 72.249.127.135

\begin{tabular}{lllllllll}
\hline
Summary of computational transaction \tabularnewline
Raw Input & view raw input (R code)  \tabularnewline
Raw Output & view raw output of R engine  \tabularnewline
Computing time & 4 seconds \tabularnewline
R Server & 'Gwilym Jenkins' @ 72.249.127.135 \tabularnewline
\hline
\end{tabular}
%Source: https://freestatistics.org/blog/index.php?pk=57984&T=0

[TABLE]
[ROW][C]Summary of computational transaction[/C][/ROW]
[ROW][C]Raw Input[/C][C]view raw input (R code) [/C][/ROW]
[ROW][C]Raw Output[/C][C]view raw output of R engine [/C][/ROW]
[ROW][C]Computing time[/C][C]4 seconds[/C][/ROW]
[ROW][C]R Server[/C][C]'Gwilym Jenkins' @ 72.249.127.135[/C][/ROW]
[/TABLE]
Source: https://freestatistics.org/blog/index.php?pk=57984&T=0

Globally Unique Identifier (entire table): ba.freestatistics.org/blog/index.php?pk=57984&T=0

As an alternative you can also use a QR Code:  

The GUIDs for individual cells are displayed in the table below:

Summary of computational transaction
Raw Inputview raw input (R code)
Raw Outputview raw output of R engine
Computing time4 seconds
R Server'Gwilym Jenkins' @ 72.249.127.135


Multiple Linear Regression - Estimated Regression Equation
wkh[t] = + 29.0258358269593 -7.66040871202718e-05los[t] -0.0102476863359301M1[t] -0.0367149244378123M2[t] -0.542583206261581M3[t] -0.703472642147917M4[t] -0.83090672136853M5[t] -0.083568878298148M6[t] + 0.0373315671599241M7[t] + 0.0617584549197351M8[t] -0.35840149526647M9[t] -0.458542865393233M10[t] -0.483361368749547M11[t] + 0.00841726582995854t + e[t]

\begin{tabular}{lllllllll}
\hline
Multiple Linear Regression - Estimated Regression Equation \tabularnewline
wkh[t] =  +  29.0258358269593 -7.66040871202718e-05los[t] -0.0102476863359301M1[t] -0.0367149244378123M2[t] -0.542583206261581M3[t] -0.703472642147917M4[t] -0.83090672136853M5[t] -0.083568878298148M6[t] +  0.0373315671599241M7[t] +  0.0617584549197351M8[t] -0.35840149526647M9[t] -0.458542865393233M10[t] -0.483361368749547M11[t] +  0.00841726582995854t  + e[t] \tabularnewline
\hline
\end{tabular}
%Source: https://freestatistics.org/blog/index.php?pk=57984&T=1

[TABLE]
[ROW][C]Multiple Linear Regression - Estimated Regression Equation[/C][/ROW]
[ROW][C]wkh[t] =  +  29.0258358269593 -7.66040871202718e-05los[t] -0.0102476863359301M1[t] -0.0367149244378123M2[t] -0.542583206261581M3[t] -0.703472642147917M4[t] -0.83090672136853M5[t] -0.083568878298148M6[t] +  0.0373315671599241M7[t] +  0.0617584549197351M8[t] -0.35840149526647M9[t] -0.458542865393233M10[t] -0.483361368749547M11[t] +  0.00841726582995854t  + e[t][/C][/ROW]
[/TABLE]
Source: https://freestatistics.org/blog/index.php?pk=57984&T=1

Globally Unique Identifier (entire table): ba.freestatistics.org/blog/index.php?pk=57984&T=1

As an alternative you can also use a QR Code:  

The GUIDs for individual cells are displayed in the table below:

Multiple Linear Regression - Estimated Regression Equation
wkh[t] = + 29.0258358269593 -7.66040871202718e-05los[t] -0.0102476863359301M1[t] -0.0367149244378123M2[t] -0.542583206261581M3[t] -0.703472642147917M4[t] -0.83090672136853M5[t] -0.083568878298148M6[t] + 0.0373315671599241M7[t] + 0.0617584549197351M8[t] -0.35840149526647M9[t] -0.458542865393233M10[t] -0.483361368749547M11[t] + 0.00841726582995854t + e[t]


Multiple Linear Regression - Ordinary Least Squares
VariableParameterS.D.T-STATH0: parameter = 02-tail p-value1-tail p-value
(Intercept)29.02583582695934.4926256.460800
los-7.66040871202718e-051.7e-05-4.50494.5e-052.3e-05
M1-0.01024768633593010.260733-0.03930.9688190.484409
M2-0.03671492443781230.261875-0.14020.8891140.444557
M3-0.5425832062615810.262041-2.07060.0440350.022017
M4-0.7034726421479170.260294-2.70260.0096050.004803
M5-0.830906721368530.259756-3.19880.00250.00125
M6-0.0835688782981480.259079-0.32260.7484890.374245
M70.03733156715992410.2589630.14420.8860050.443003
M80.06175845491973510.2596670.23780.8130630.406532
M9-0.358401495266470.26083-1.37410.1760750.088037
M10-0.4585428653932330.260063-1.76320.0845090.042255
M11-0.4833613687495470.266248-1.81550.0759760.037988
t0.008417265829958540.0060041.4020.1676220.083811

\begin{tabular}{lllllllll}
\hline
Multiple Linear Regression - Ordinary Least Squares \tabularnewline
Variable & Parameter & S.D. & T-STATH0: parameter = 0 & 2-tail p-value & 1-tail p-value \tabularnewline
(Intercept) & 29.0258358269593 & 4.492625 & 6.4608 & 0 & 0 \tabularnewline
los & -7.66040871202718e-05 & 1.7e-05 & -4.5049 & 4.5e-05 & 2.3e-05 \tabularnewline
M1 & -0.0102476863359301 & 0.260733 & -0.0393 & 0.968819 & 0.484409 \tabularnewline
M2 & -0.0367149244378123 & 0.261875 & -0.1402 & 0.889114 & 0.444557 \tabularnewline
M3 & -0.542583206261581 & 0.262041 & -2.0706 & 0.044035 & 0.022017 \tabularnewline
M4 & -0.703472642147917 & 0.260294 & -2.7026 & 0.009605 & 0.004803 \tabularnewline
M5 & -0.83090672136853 & 0.259756 & -3.1988 & 0.0025 & 0.00125 \tabularnewline
M6 & -0.083568878298148 & 0.259079 & -0.3226 & 0.748489 & 0.374245 \tabularnewline
M7 & 0.0373315671599241 & 0.258963 & 0.1442 & 0.886005 & 0.443003 \tabularnewline
M8 & 0.0617584549197351 & 0.259667 & 0.2378 & 0.813063 & 0.406532 \tabularnewline
M9 & -0.35840149526647 & 0.26083 & -1.3741 & 0.176075 & 0.088037 \tabularnewline
M10 & -0.458542865393233 & 0.260063 & -1.7632 & 0.084509 & 0.042255 \tabularnewline
M11 & -0.483361368749547 & 0.266248 & -1.8155 & 0.075976 & 0.037988 \tabularnewline
t & 0.00841726582995854 & 0.006004 & 1.402 & 0.167622 & 0.083811 \tabularnewline
\hline
\end{tabular}
%Source: https://freestatistics.org/blog/index.php?pk=57984&T=2

[TABLE]
[ROW][C]Multiple Linear Regression - Ordinary Least Squares[/C][/ROW]
[ROW][C]Variable[/C][C]Parameter[/C][C]S.D.[/C][C]T-STATH0: parameter = 0[/C][C]2-tail p-value[/C][C]1-tail p-value[/C][/ROW]
[ROW][C](Intercept)[/C][C]29.0258358269593[/C][C]4.492625[/C][C]6.4608[/C][C]0[/C][C]0[/C][/ROW]
[ROW][C]los[/C][C]-7.66040871202718e-05[/C][C]1.7e-05[/C][C]-4.5049[/C][C]4.5e-05[/C][C]2.3e-05[/C][/ROW]
[ROW][C]M1[/C][C]-0.0102476863359301[/C][C]0.260733[/C][C]-0.0393[/C][C]0.968819[/C][C]0.484409[/C][/ROW]
[ROW][C]M2[/C][C]-0.0367149244378123[/C][C]0.261875[/C][C]-0.1402[/C][C]0.889114[/C][C]0.444557[/C][/ROW]
[ROW][C]M3[/C][C]-0.542583206261581[/C][C]0.262041[/C][C]-2.0706[/C][C]0.044035[/C][C]0.022017[/C][/ROW]
[ROW][C]M4[/C][C]-0.703472642147917[/C][C]0.260294[/C][C]-2.7026[/C][C]0.009605[/C][C]0.004803[/C][/ROW]
[ROW][C]M5[/C][C]-0.83090672136853[/C][C]0.259756[/C][C]-3.1988[/C][C]0.0025[/C][C]0.00125[/C][/ROW]
[ROW][C]M6[/C][C]-0.083568878298148[/C][C]0.259079[/C][C]-0.3226[/C][C]0.748489[/C][C]0.374245[/C][/ROW]
[ROW][C]M7[/C][C]0.0373315671599241[/C][C]0.258963[/C][C]0.1442[/C][C]0.886005[/C][C]0.443003[/C][/ROW]
[ROW][C]M8[/C][C]0.0617584549197351[/C][C]0.259667[/C][C]0.2378[/C][C]0.813063[/C][C]0.406532[/C][/ROW]
[ROW][C]M9[/C][C]-0.35840149526647[/C][C]0.26083[/C][C]-1.3741[/C][C]0.176075[/C][C]0.088037[/C][/ROW]
[ROW][C]M10[/C][C]-0.458542865393233[/C][C]0.260063[/C][C]-1.7632[/C][C]0.084509[/C][C]0.042255[/C][/ROW]
[ROW][C]M11[/C][C]-0.483361368749547[/C][C]0.266248[/C][C]-1.8155[/C][C]0.075976[/C][C]0.037988[/C][/ROW]
[ROW][C]t[/C][C]0.00841726582995854[/C][C]0.006004[/C][C]1.402[/C][C]0.167622[/C][C]0.083811[/C][/ROW]
[/TABLE]
Source: https://freestatistics.org/blog/index.php?pk=57984&T=2

Globally Unique Identifier (entire table): ba.freestatistics.org/blog/index.php?pk=57984&T=2

As an alternative you can also use a QR Code:  

The GUIDs for individual cells are displayed in the table below:

Multiple Linear Regression - Ordinary Least Squares
VariableParameterS.D.T-STATH0: parameter = 02-tail p-value1-tail p-value
(Intercept)29.02583582695934.4926256.460800
los-7.66040871202718e-051.7e-05-4.50494.5e-052.3e-05
M1-0.01024768633593010.260733-0.03930.9688190.484409
M2-0.03671492443781230.261875-0.14020.8891140.444557
M3-0.5425832062615810.262041-2.07060.0440350.022017
M4-0.7034726421479170.260294-2.70260.0096050.004803
M5-0.830906721368530.259756-3.19880.00250.00125
M6-0.0835688782981480.259079-0.32260.7484890.374245
M70.03733156715992410.2589630.14420.8860050.443003
M80.06175845491973510.2596670.23780.8130630.406532
M9-0.358401495266470.26083-1.37410.1760750.088037
M10-0.4585428653932330.260063-1.76320.0845090.042255
M11-0.4833613687495470.266248-1.81550.0759760.037988
t0.008417265829958540.0060041.4020.1676220.083811


Multiple Linear Regression - Regression Statistics
Multiple R0.759797768866946
R-squared0.577292649575189
Adjusted R-squared0.457831876629046
F-TEST (value)4.83248714484256
F-TEST (DF numerator)13
F-TEST (DF denominator)46
p-value3.19679927507366e-05
Multiple Linear Regression - Residual Statistics
Residual Standard Deviation0.408573917739366
Sum Squared Residuals7.67890172781713

\begin{tabular}{lllllllll}
\hline
Multiple Linear Regression - Regression Statistics \tabularnewline
Multiple R & 0.759797768866946 \tabularnewline
R-squared & 0.577292649575189 \tabularnewline
Adjusted R-squared & 0.457831876629046 \tabularnewline
F-TEST (value) & 4.83248714484256 \tabularnewline
F-TEST (DF numerator) & 13 \tabularnewline
F-TEST (DF denominator) & 46 \tabularnewline
p-value & 3.19679927507366e-05 \tabularnewline
Multiple Linear Regression - Residual Statistics \tabularnewline
Residual Standard Deviation & 0.408573917739366 \tabularnewline
Sum Squared Residuals & 7.67890172781713 \tabularnewline
\hline
\end{tabular}
%Source: https://freestatistics.org/blog/index.php?pk=57984&T=3

[TABLE]
[ROW][C]Multiple Linear Regression - Regression Statistics[/C][/ROW]
[ROW][C]Multiple R[/C][C]0.759797768866946[/C][/ROW]
[ROW][C]R-squared[/C][C]0.577292649575189[/C][/ROW]
[ROW][C]Adjusted R-squared[/C][C]0.457831876629046[/C][/ROW]
[ROW][C]F-TEST (value)[/C][C]4.83248714484256[/C][/ROW]
[ROW][C]F-TEST (DF numerator)[/C][C]13[/C][/ROW]
[ROW][C]F-TEST (DF denominator)[/C][C]46[/C][/ROW]
[ROW][C]p-value[/C][C]3.19679927507366e-05[/C][/ROW]
[ROW][C]Multiple Linear Regression - Residual Statistics[/C][/ROW]
[ROW][C]Residual Standard Deviation[/C][C]0.408573917739366[/C][/ROW]
[ROW][C]Sum Squared Residuals[/C][C]7.67890172781713[/C][/ROW]
[/TABLE]
Source: https://freestatistics.org/blog/index.php?pk=57984&T=3

Globally Unique Identifier (entire table): ba.freestatistics.org/blog/index.php?pk=57984&T=3

As an alternative you can also use a QR Code:  

The GUIDs for individual cells are displayed in the table below:

Multiple Linear Regression - Regression Statistics
Multiple R0.759797768866946
R-squared0.577292649575189
Adjusted R-squared0.457831876629046
F-TEST (value)4.83248714484256
F-TEST (DF numerator)13
F-TEST (DF denominator)46
p-value3.19679927507366e-05
Multiple Linear Regression - Residual Statistics
Residual Standard Deviation0.408573917739366
Sum Squared Residuals7.67890172781713


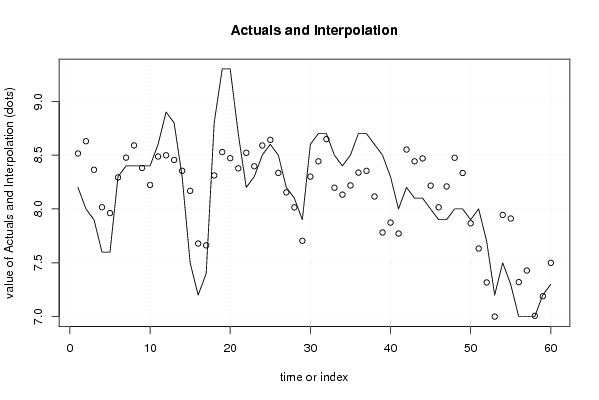
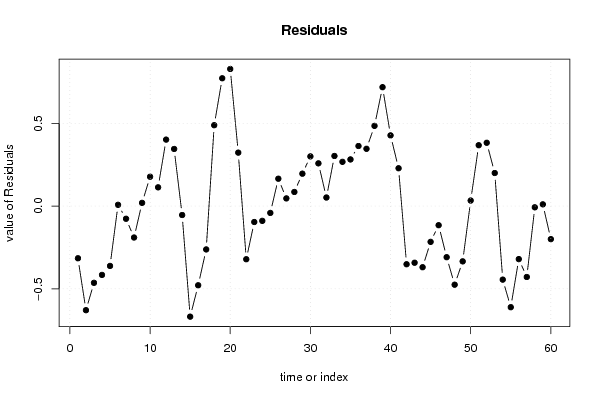
Multiple Linear Regression - Actuals, Interpolation, and Residuals
Time or IndexActualsInterpolationForecastResidualsPrediction Error
18.28.51540599443998-0.315405994439982
288.62903844792777-0.629038447927774
37.98.36385102408263-0.463851024082628
47.68.01603843186956-0.416038431869558
57.67.96175207209553-0.361752072095532
68.38.292584309739720.00741569026027663
78.48.47667394331875-0.0766739433187496
88.48.59002899247193-0.190028992471925
98.48.380750910374560.0192490896254434
108.48.22268766663160.177312333368403
118.68.486810596139680.113189403860323
128.98.498511416736440.401488583263561
138.88.455008372837040.344991627162961
148.38.35407277830098-0.054072778300981
157.58.16817058462532-0.668170584625318
167.27.67864043123974-0.478640431239744
177.47.6620432823289-0.262043282328893
188.88.311395314219180.488604685780825
199.38.52796508073720.772034919262805
209.38.471565472831850.828434527168152
218.78.377193521414890.322806478585111
228.28.52125679727428-0.321256797274281
238.38.3963075682985-0.0963075682984987
248.58.58925365902182-0.0892536590218252
258.68.64142911993565-0.0414291199356455
268.58.334734947394540.165265052605463
278.28.153735415294570.0462645847054288
288.18.014745564571360.0852544354286385
297.97.704295137467150.195704862532853
308.68.299947704286120.300052295713881
318.78.4419050899490.258094910051005
328.78.64833410495330.0516658950466994
338.58.197293523904350.302706476095646
348.48.132763870535250.267236129464754
358.58.218322672965970.281677327034028
368.78.337269215531120.362730784468884
378.78.354053588195370.34594641180463
388.68.115460449104180.484539550895816
398.57.781788971373510.718211028626485
408.37.872994402446720.427005597553279
4187.771519925006610.22848007499339
428.28.55155852952408-0.351558529524077
438.18.4424077176067-0.342407717606701
448.18.46958316874957-0.36958316874957
4588.21625773655805-0.216257736558046
467.98.01567922446334-0.115679224463335
477.98.20894337338516-0.308943373385162
4888.47504636730835-0.475046367308348
4988.33410292459196-0.334102924591963
507.97.866693377272520.0333066227274757
5187.632454004623970.367545995376031
527.77.317581169872620.382418830127385
537.27.000389583101820.199610416898182
547.57.9445141422309-0.444514142230906
557.37.91104816838836-0.611048168388359
5677.32048826099336-0.320488260993356
5777.42850430774815-0.428504307748154
5877.00761244109554-0.0076124410955417
597.27.189615789210690.0103842107893105
607.37.49991934140227-0.199919341402272

\begin{tabular}{lllllllll}
\hline
Multiple Linear Regression - Actuals, Interpolation, and Residuals \tabularnewline
Time or Index & Actuals & InterpolationForecast & ResidualsPrediction Error \tabularnewline
1 & 8.2 & 8.51540599443998 & -0.315405994439982 \tabularnewline
2 & 8 & 8.62903844792777 & -0.629038447927774 \tabularnewline
3 & 7.9 & 8.36385102408263 & -0.463851024082628 \tabularnewline
4 & 7.6 & 8.01603843186956 & -0.416038431869558 \tabularnewline
5 & 7.6 & 7.96175207209553 & -0.361752072095532 \tabularnewline
6 & 8.3 & 8.29258430973972 & 0.00741569026027663 \tabularnewline
7 & 8.4 & 8.47667394331875 & -0.0766739433187496 \tabularnewline
8 & 8.4 & 8.59002899247193 & -0.190028992471925 \tabularnewline
9 & 8.4 & 8.38075091037456 & 0.0192490896254434 \tabularnewline
10 & 8.4 & 8.2226876666316 & 0.177312333368403 \tabularnewline
11 & 8.6 & 8.48681059613968 & 0.113189403860323 \tabularnewline
12 & 8.9 & 8.49851141673644 & 0.401488583263561 \tabularnewline
13 & 8.8 & 8.45500837283704 & 0.344991627162961 \tabularnewline
14 & 8.3 & 8.35407277830098 & -0.054072778300981 \tabularnewline
15 & 7.5 & 8.16817058462532 & -0.668170584625318 \tabularnewline
16 & 7.2 & 7.67864043123974 & -0.478640431239744 \tabularnewline
17 & 7.4 & 7.6620432823289 & -0.262043282328893 \tabularnewline
18 & 8.8 & 8.31139531421918 & 0.488604685780825 \tabularnewline
19 & 9.3 & 8.5279650807372 & 0.772034919262805 \tabularnewline
20 & 9.3 & 8.47156547283185 & 0.828434527168152 \tabularnewline
21 & 8.7 & 8.37719352141489 & 0.322806478585111 \tabularnewline
22 & 8.2 & 8.52125679727428 & -0.321256797274281 \tabularnewline
23 & 8.3 & 8.3963075682985 & -0.0963075682984987 \tabularnewline
24 & 8.5 & 8.58925365902182 & -0.0892536590218252 \tabularnewline
25 & 8.6 & 8.64142911993565 & -0.0414291199356455 \tabularnewline
26 & 8.5 & 8.33473494739454 & 0.165265052605463 \tabularnewline
27 & 8.2 & 8.15373541529457 & 0.0462645847054288 \tabularnewline
28 & 8.1 & 8.01474556457136 & 0.0852544354286385 \tabularnewline
29 & 7.9 & 7.70429513746715 & 0.195704862532853 \tabularnewline
30 & 8.6 & 8.29994770428612 & 0.300052295713881 \tabularnewline
31 & 8.7 & 8.441905089949 & 0.258094910051005 \tabularnewline
32 & 8.7 & 8.6483341049533 & 0.0516658950466994 \tabularnewline
33 & 8.5 & 8.19729352390435 & 0.302706476095646 \tabularnewline
34 & 8.4 & 8.13276387053525 & 0.267236129464754 \tabularnewline
35 & 8.5 & 8.21832267296597 & 0.281677327034028 \tabularnewline
36 & 8.7 & 8.33726921553112 & 0.362730784468884 \tabularnewline
37 & 8.7 & 8.35405358819537 & 0.34594641180463 \tabularnewline
38 & 8.6 & 8.11546044910418 & 0.484539550895816 \tabularnewline
39 & 8.5 & 7.78178897137351 & 0.718211028626485 \tabularnewline
40 & 8.3 & 7.87299440244672 & 0.427005597553279 \tabularnewline
41 & 8 & 7.77151992500661 & 0.22848007499339 \tabularnewline
42 & 8.2 & 8.55155852952408 & -0.351558529524077 \tabularnewline
43 & 8.1 & 8.4424077176067 & -0.342407717606701 \tabularnewline
44 & 8.1 & 8.46958316874957 & -0.36958316874957 \tabularnewline
45 & 8 & 8.21625773655805 & -0.216257736558046 \tabularnewline
46 & 7.9 & 8.01567922446334 & -0.115679224463335 \tabularnewline
47 & 7.9 & 8.20894337338516 & -0.308943373385162 \tabularnewline
48 & 8 & 8.47504636730835 & -0.475046367308348 \tabularnewline
49 & 8 & 8.33410292459196 & -0.334102924591963 \tabularnewline
50 & 7.9 & 7.86669337727252 & 0.0333066227274757 \tabularnewline
51 & 8 & 7.63245400462397 & 0.367545995376031 \tabularnewline
52 & 7.7 & 7.31758116987262 & 0.382418830127385 \tabularnewline
53 & 7.2 & 7.00038958310182 & 0.199610416898182 \tabularnewline
54 & 7.5 & 7.9445141422309 & -0.444514142230906 \tabularnewline
55 & 7.3 & 7.91104816838836 & -0.611048168388359 \tabularnewline
56 & 7 & 7.32048826099336 & -0.320488260993356 \tabularnewline
57 & 7 & 7.42850430774815 & -0.428504307748154 \tabularnewline
58 & 7 & 7.00761244109554 & -0.0076124410955417 \tabularnewline
59 & 7.2 & 7.18961578921069 & 0.0103842107893105 \tabularnewline
60 & 7.3 & 7.49991934140227 & -0.199919341402272 \tabularnewline
\hline
\end{tabular}
%Source: https://freestatistics.org/blog/index.php?pk=57984&T=4

[TABLE]
[ROW][C]Multiple Linear Regression - Actuals, Interpolation, and Residuals[/C][/ROW]
[ROW][C]Time or Index[/C][C]Actuals[/C][C]InterpolationForecast[/C][C]ResidualsPrediction Error[/C][/ROW]
[ROW][C]1[/C][C]8.2[/C][C]8.51540599443998[/C][C]-0.315405994439982[/C][/ROW]
[ROW][C]2[/C][C]8[/C][C]8.62903844792777[/C][C]-0.629038447927774[/C][/ROW]
[ROW][C]3[/C][C]7.9[/C][C]8.36385102408263[/C][C]-0.463851024082628[/C][/ROW]
[ROW][C]4[/C][C]7.6[/C][C]8.01603843186956[/C][C]-0.416038431869558[/C][/ROW]
[ROW][C]5[/C][C]7.6[/C][C]7.96175207209553[/C][C]-0.361752072095532[/C][/ROW]
[ROW][C]6[/C][C]8.3[/C][C]8.29258430973972[/C][C]0.00741569026027663[/C][/ROW]
[ROW][C]7[/C][C]8.4[/C][C]8.47667394331875[/C][C]-0.0766739433187496[/C][/ROW]
[ROW][C]8[/C][C]8.4[/C][C]8.59002899247193[/C][C]-0.190028992471925[/C][/ROW]
[ROW][C]9[/C][C]8.4[/C][C]8.38075091037456[/C][C]0.0192490896254434[/C][/ROW]
[ROW][C]10[/C][C]8.4[/C][C]8.2226876666316[/C][C]0.177312333368403[/C][/ROW]
[ROW][C]11[/C][C]8.6[/C][C]8.48681059613968[/C][C]0.113189403860323[/C][/ROW]
[ROW][C]12[/C][C]8.9[/C][C]8.49851141673644[/C][C]0.401488583263561[/C][/ROW]
[ROW][C]13[/C][C]8.8[/C][C]8.45500837283704[/C][C]0.344991627162961[/C][/ROW]
[ROW][C]14[/C][C]8.3[/C][C]8.35407277830098[/C][C]-0.054072778300981[/C][/ROW]
[ROW][C]15[/C][C]7.5[/C][C]8.16817058462532[/C][C]-0.668170584625318[/C][/ROW]
[ROW][C]16[/C][C]7.2[/C][C]7.67864043123974[/C][C]-0.478640431239744[/C][/ROW]
[ROW][C]17[/C][C]7.4[/C][C]7.6620432823289[/C][C]-0.262043282328893[/C][/ROW]
[ROW][C]18[/C][C]8.8[/C][C]8.31139531421918[/C][C]0.488604685780825[/C][/ROW]
[ROW][C]19[/C][C]9.3[/C][C]8.5279650807372[/C][C]0.772034919262805[/C][/ROW]
[ROW][C]20[/C][C]9.3[/C][C]8.47156547283185[/C][C]0.828434527168152[/C][/ROW]
[ROW][C]21[/C][C]8.7[/C][C]8.37719352141489[/C][C]0.322806478585111[/C][/ROW]
[ROW][C]22[/C][C]8.2[/C][C]8.52125679727428[/C][C]-0.321256797274281[/C][/ROW]
[ROW][C]23[/C][C]8.3[/C][C]8.3963075682985[/C][C]-0.0963075682984987[/C][/ROW]
[ROW][C]24[/C][C]8.5[/C][C]8.58925365902182[/C][C]-0.0892536590218252[/C][/ROW]
[ROW][C]25[/C][C]8.6[/C][C]8.64142911993565[/C][C]-0.0414291199356455[/C][/ROW]
[ROW][C]26[/C][C]8.5[/C][C]8.33473494739454[/C][C]0.165265052605463[/C][/ROW]
[ROW][C]27[/C][C]8.2[/C][C]8.15373541529457[/C][C]0.0462645847054288[/C][/ROW]
[ROW][C]28[/C][C]8.1[/C][C]8.01474556457136[/C][C]0.0852544354286385[/C][/ROW]
[ROW][C]29[/C][C]7.9[/C][C]7.70429513746715[/C][C]0.195704862532853[/C][/ROW]
[ROW][C]30[/C][C]8.6[/C][C]8.29994770428612[/C][C]0.300052295713881[/C][/ROW]
[ROW][C]31[/C][C]8.7[/C][C]8.441905089949[/C][C]0.258094910051005[/C][/ROW]
[ROW][C]32[/C][C]8.7[/C][C]8.6483341049533[/C][C]0.0516658950466994[/C][/ROW]
[ROW][C]33[/C][C]8.5[/C][C]8.19729352390435[/C][C]0.302706476095646[/C][/ROW]
[ROW][C]34[/C][C]8.4[/C][C]8.13276387053525[/C][C]0.267236129464754[/C][/ROW]
[ROW][C]35[/C][C]8.5[/C][C]8.21832267296597[/C][C]0.281677327034028[/C][/ROW]
[ROW][C]36[/C][C]8.7[/C][C]8.33726921553112[/C][C]0.362730784468884[/C][/ROW]
[ROW][C]37[/C][C]8.7[/C][C]8.35405358819537[/C][C]0.34594641180463[/C][/ROW]
[ROW][C]38[/C][C]8.6[/C][C]8.11546044910418[/C][C]0.484539550895816[/C][/ROW]
[ROW][C]39[/C][C]8.5[/C][C]7.78178897137351[/C][C]0.718211028626485[/C][/ROW]
[ROW][C]40[/C][C]8.3[/C][C]7.87299440244672[/C][C]0.427005597553279[/C][/ROW]
[ROW][C]41[/C][C]8[/C][C]7.77151992500661[/C][C]0.22848007499339[/C][/ROW]
[ROW][C]42[/C][C]8.2[/C][C]8.55155852952408[/C][C]-0.351558529524077[/C][/ROW]
[ROW][C]43[/C][C]8.1[/C][C]8.4424077176067[/C][C]-0.342407717606701[/C][/ROW]
[ROW][C]44[/C][C]8.1[/C][C]8.46958316874957[/C][C]-0.36958316874957[/C][/ROW]
[ROW][C]45[/C][C]8[/C][C]8.21625773655805[/C][C]-0.216257736558046[/C][/ROW]
[ROW][C]46[/C][C]7.9[/C][C]8.01567922446334[/C][C]-0.115679224463335[/C][/ROW]
[ROW][C]47[/C][C]7.9[/C][C]8.20894337338516[/C][C]-0.308943373385162[/C][/ROW]
[ROW][C]48[/C][C]8[/C][C]8.47504636730835[/C][C]-0.475046367308348[/C][/ROW]
[ROW][C]49[/C][C]8[/C][C]8.33410292459196[/C][C]-0.334102924591963[/C][/ROW]
[ROW][C]50[/C][C]7.9[/C][C]7.86669337727252[/C][C]0.0333066227274757[/C][/ROW]
[ROW][C]51[/C][C]8[/C][C]7.63245400462397[/C][C]0.367545995376031[/C][/ROW]
[ROW][C]52[/C][C]7.7[/C][C]7.31758116987262[/C][C]0.382418830127385[/C][/ROW]
[ROW][C]53[/C][C]7.2[/C][C]7.00038958310182[/C][C]0.199610416898182[/C][/ROW]
[ROW][C]54[/C][C]7.5[/C][C]7.9445141422309[/C][C]-0.444514142230906[/C][/ROW]
[ROW][C]55[/C][C]7.3[/C][C]7.91104816838836[/C][C]-0.611048168388359[/C][/ROW]
[ROW][C]56[/C][C]7[/C][C]7.32048826099336[/C][C]-0.320488260993356[/C][/ROW]
[ROW][C]57[/C][C]7[/C][C]7.42850430774815[/C][C]-0.428504307748154[/C][/ROW]
[ROW][C]58[/C][C]7[/C][C]7.00761244109554[/C][C]-0.0076124410955417[/C][/ROW]
[ROW][C]59[/C][C]7.2[/C][C]7.18961578921069[/C][C]0.0103842107893105[/C][/ROW]
[ROW][C]60[/C][C]7.3[/C][C]7.49991934140227[/C][C]-0.199919341402272[/C][/ROW]
[/TABLE]
Source: https://freestatistics.org/blog/index.php?pk=57984&T=4

Globally Unique Identifier (entire table): ba.freestatistics.org/blog/index.php?pk=57984&T=4

As an alternative you can also use a QR Code:  

The GUIDs for individual cells are displayed in the table below:

Multiple Linear Regression - Actuals, Interpolation, and Residuals
Time or IndexActualsInterpolationForecastResidualsPrediction Error
18.28.51540599443998-0.315405994439982
288.62903844792777-0.629038447927774
37.98.36385102408263-0.463851024082628
47.68.01603843186956-0.416038431869558
57.67.96175207209553-0.361752072095532
68.38.292584309739720.00741569026027663
78.48.47667394331875-0.0766739433187496
88.48.59002899247193-0.190028992471925
98.48.380750910374560.0192490896254434
108.48.22268766663160.177312333368403
118.68.486810596139680.113189403860323
128.98.498511416736440.401488583263561
138.88.455008372837040.344991627162961
148.38.35407277830098-0.054072778300981
157.58.16817058462532-0.668170584625318
167.27.67864043123974-0.478640431239744
177.47.6620432823289-0.262043282328893
188.88.311395314219180.488604685780825
199.38.52796508073720.772034919262805
209.38.471565472831850.828434527168152
218.78.377193521414890.322806478585111
228.28.52125679727428-0.321256797274281
238.38.3963075682985-0.0963075682984987
248.58.58925365902182-0.0892536590218252
258.68.64142911993565-0.0414291199356455
268.58.334734947394540.165265052605463
278.28.153735415294570.0462645847054288
288.18.014745564571360.0852544354286385
297.97.704295137467150.195704862532853
308.68.299947704286120.300052295713881
318.78.4419050899490.258094910051005
328.78.64833410495330.0516658950466994
338.58.197293523904350.302706476095646
348.48.132763870535250.267236129464754
358.58.218322672965970.281677327034028
368.78.337269215531120.362730784468884
378.78.354053588195370.34594641180463
388.68.115460449104180.484539550895816
398.57.781788971373510.718211028626485
408.37.872994402446720.427005597553279
4187.771519925006610.22848007499339
428.28.55155852952408-0.351558529524077
438.18.4424077176067-0.342407717606701
448.18.46958316874957-0.36958316874957
4588.21625773655805-0.216257736558046
467.98.01567922446334-0.115679224463335
477.98.20894337338516-0.308943373385162
4888.47504636730835-0.475046367308348
4988.33410292459196-0.334102924591963
507.97.866693377272520.0333066227274757
5187.632454004623970.367545995376031
527.77.317581169872620.382418830127385
537.27.000389583101820.199610416898182
547.57.9445141422309-0.444514142230906
557.37.91104816838836-0.611048168388359
5677.32048826099336-0.320488260993356
5777.42850430774815-0.428504307748154
5877.00761244109554-0.0076124410955417
597.27.189615789210690.0103842107893105
607.37.49991934140227-0.199919341402272


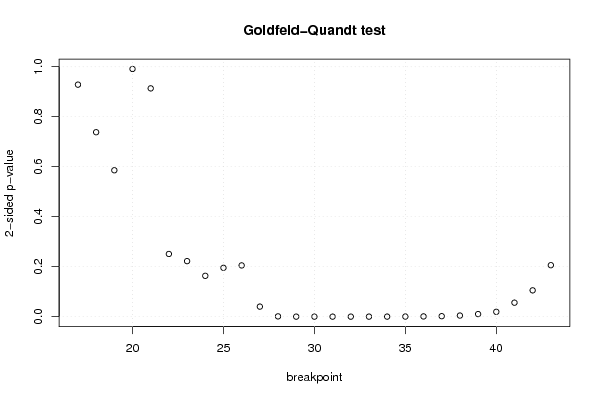
Goldfeld-Quandt test for Heteroskedasticity
p-valuesAlternative Hypothesis
breakpoint indexgreater2-sidedless
170.5359532505827280.9280934988345450.464046749417272
180.3689085669556460.7378171339112930.631091433044354
190.2928300640712530.5856601281425070.707169935928747
200.4954732306470170.9909464612940350.504526769352983
210.4566453321082150.9132906642164290.543354667891786
220.8746213366231860.2507573267536290.125378663376814
230.8889201575604510.2221596848790980.111079842439549
240.9183396774987190.1633206450025630.0816603225012813
250.9023246113869430.1953507772261150.0976753886130575
260.8974801261433230.2050397477133540.102519873856677
270.9799267123597930.0401465752804130.0200732876402065
280.9994303523678630.001139295264273120.000569647632136559
290.999999173874411.65225118084142e-068.26125590420712e-07
300.9999987148721762.57025564715519e-061.28512782357759e-06
310.999997025703575.94859286175864e-062.97429643087932e-06
320.9999937230547741.25538904512686e-056.27694522563431e-06
330.9999790095381954.19809236100496e-052.09904618050248e-05
340.999943615818920.0001127683621622555.63841810811277e-05
350.9998450085711630.0003099828576745760.000154991428837288
360.9995474883487590.0009050233024817460.000452511651240873
370.999060680330510.001878639338980510.000939319669490256
380.9978057444498840.004388511100231020.00219425555011551
390.9948267154865950.01034656902680920.00517328451340461
400.9903596103889140.01928077922217290.00964038961108646
410.9720789927962150.05584201440756930.0279210072037847
420.9473682046993940.1052635906012120.0526317953006059
430.8970774151426760.2058451697146480.102922584857324

\begin{tabular}{lllllllll}
\hline
Goldfeld-Quandt test for Heteroskedasticity \tabularnewline
p-values & Alternative Hypothesis \tabularnewline
breakpoint index & greater & 2-sided & less \tabularnewline
17 & 0.535953250582728 & 0.928093498834545 & 0.464046749417272 \tabularnewline
18 & 0.368908566955646 & 0.737817133911293 & 0.631091433044354 \tabularnewline
19 & 0.292830064071253 & 0.585660128142507 & 0.707169935928747 \tabularnewline
20 & 0.495473230647017 & 0.990946461294035 & 0.504526769352983 \tabularnewline
21 & 0.456645332108215 & 0.913290664216429 & 0.543354667891786 \tabularnewline
22 & 0.874621336623186 & 0.250757326753629 & 0.125378663376814 \tabularnewline
23 & 0.888920157560451 & 0.222159684879098 & 0.111079842439549 \tabularnewline
24 & 0.918339677498719 & 0.163320645002563 & 0.0816603225012813 \tabularnewline
25 & 0.902324611386943 & 0.195350777226115 & 0.0976753886130575 \tabularnewline
26 & 0.897480126143323 & 0.205039747713354 & 0.102519873856677 \tabularnewline
27 & 0.979926712359793 & 0.040146575280413 & 0.0200732876402065 \tabularnewline
28 & 0.999430352367863 & 0.00113929526427312 & 0.000569647632136559 \tabularnewline
29 & 0.99999917387441 & 1.65225118084142e-06 & 8.26125590420712e-07 \tabularnewline
30 & 0.999998714872176 & 2.57025564715519e-06 & 1.28512782357759e-06 \tabularnewline
31 & 0.99999702570357 & 5.94859286175864e-06 & 2.97429643087932e-06 \tabularnewline
32 & 0.999993723054774 & 1.25538904512686e-05 & 6.27694522563431e-06 \tabularnewline
33 & 0.999979009538195 & 4.19809236100496e-05 & 2.09904618050248e-05 \tabularnewline
34 & 0.99994361581892 & 0.000112768362162255 & 5.63841810811277e-05 \tabularnewline
35 & 0.999845008571163 & 0.000309982857674576 & 0.000154991428837288 \tabularnewline
36 & 0.999547488348759 & 0.000905023302481746 & 0.000452511651240873 \tabularnewline
37 & 0.99906068033051 & 0.00187863933898051 & 0.000939319669490256 \tabularnewline
38 & 0.997805744449884 & 0.00438851110023102 & 0.00219425555011551 \tabularnewline
39 & 0.994826715486595 & 0.0103465690268092 & 0.00517328451340461 \tabularnewline
40 & 0.990359610388914 & 0.0192807792221729 & 0.00964038961108646 \tabularnewline
41 & 0.972078992796215 & 0.0558420144075693 & 0.0279210072037847 \tabularnewline
42 & 0.947368204699394 & 0.105263590601212 & 0.0526317953006059 \tabularnewline
43 & 0.897077415142676 & 0.205845169714648 & 0.102922584857324 \tabularnewline
\hline
\end{tabular}
%Source: https://freestatistics.org/blog/index.php?pk=57984&T=5

[TABLE]
[ROW][C]Goldfeld-Quandt test for Heteroskedasticity[/C][/ROW]
[ROW][C]p-values[/C][C]Alternative Hypothesis[/C][/ROW]
[ROW][C]breakpoint index[/C][C]greater[/C][C]2-sided[/C][C]less[/C][/ROW]
[ROW][C]17[/C][C]0.535953250582728[/C][C]0.928093498834545[/C][C]0.464046749417272[/C][/ROW]
[ROW][C]18[/C][C]0.368908566955646[/C][C]0.737817133911293[/C][C]0.631091433044354[/C][/ROW]
[ROW][C]19[/C][C]0.292830064071253[/C][C]0.585660128142507[/C][C]0.707169935928747[/C][/ROW]
[ROW][C]20[/C][C]0.495473230647017[/C][C]0.990946461294035[/C][C]0.504526769352983[/C][/ROW]
[ROW][C]21[/C][C]0.456645332108215[/C][C]0.913290664216429[/C][C]0.543354667891786[/C][/ROW]
[ROW][C]22[/C][C]0.874621336623186[/C][C]0.250757326753629[/C][C]0.125378663376814[/C][/ROW]
[ROW][C]23[/C][C]0.888920157560451[/C][C]0.222159684879098[/C][C]0.111079842439549[/C][/ROW]
[ROW][C]24[/C][C]0.918339677498719[/C][C]0.163320645002563[/C][C]0.0816603225012813[/C][/ROW]
[ROW][C]25[/C][C]0.902324611386943[/C][C]0.195350777226115[/C][C]0.0976753886130575[/C][/ROW]
[ROW][C]26[/C][C]0.897480126143323[/C][C]0.205039747713354[/C][C]0.102519873856677[/C][/ROW]
[ROW][C]27[/C][C]0.979926712359793[/C][C]0.040146575280413[/C][C]0.0200732876402065[/C][/ROW]
[ROW][C]28[/C][C]0.999430352367863[/C][C]0.00113929526427312[/C][C]0.000569647632136559[/C][/ROW]
[ROW][C]29[/C][C]0.99999917387441[/C][C]1.65225118084142e-06[/C][C]8.26125590420712e-07[/C][/ROW]
[ROW][C]30[/C][C]0.999998714872176[/C][C]2.57025564715519e-06[/C][C]1.28512782357759e-06[/C][/ROW]
[ROW][C]31[/C][C]0.99999702570357[/C][C]5.94859286175864e-06[/C][C]2.97429643087932e-06[/C][/ROW]
[ROW][C]32[/C][C]0.999993723054774[/C][C]1.25538904512686e-05[/C][C]6.27694522563431e-06[/C][/ROW]
[ROW][C]33[/C][C]0.999979009538195[/C][C]4.19809236100496e-05[/C][C]2.09904618050248e-05[/C][/ROW]
[ROW][C]34[/C][C]0.99994361581892[/C][C]0.000112768362162255[/C][C]5.63841810811277e-05[/C][/ROW]
[ROW][C]35[/C][C]0.999845008571163[/C][C]0.000309982857674576[/C][C]0.000154991428837288[/C][/ROW]
[ROW][C]36[/C][C]0.999547488348759[/C][C]0.000905023302481746[/C][C]0.000452511651240873[/C][/ROW]
[ROW][C]37[/C][C]0.99906068033051[/C][C]0.00187863933898051[/C][C]0.000939319669490256[/C][/ROW]
[ROW][C]38[/C][C]0.997805744449884[/C][C]0.00438851110023102[/C][C]0.00219425555011551[/C][/ROW]
[ROW][C]39[/C][C]0.994826715486595[/C][C]0.0103465690268092[/C][C]0.00517328451340461[/C][/ROW]
[ROW][C]40[/C][C]0.990359610388914[/C][C]0.0192807792221729[/C][C]0.00964038961108646[/C][/ROW]
[ROW][C]41[/C][C]0.972078992796215[/C][C]0.0558420144075693[/C][C]0.0279210072037847[/C][/ROW]
[ROW][C]42[/C][C]0.947368204699394[/C][C]0.105263590601212[/C][C]0.0526317953006059[/C][/ROW]
[ROW][C]43[/C][C]0.897077415142676[/C][C]0.205845169714648[/C][C]0.102922584857324[/C][/ROW]
[/TABLE]
Source: https://freestatistics.org/blog/index.php?pk=57984&T=5

Globally Unique Identifier (entire table): ba.freestatistics.org/blog/index.php?pk=57984&T=5

As an alternative you can also use a QR Code:  

The GUIDs for individual cells are displayed in the table below:

Goldfeld-Quandt test for Heteroskedasticity
p-valuesAlternative Hypothesis
breakpoint indexgreater2-sidedless
170.5359532505827280.9280934988345450.464046749417272
180.3689085669556460.7378171339112930.631091433044354
190.2928300640712530.5856601281425070.707169935928747
200.4954732306470170.9909464612940350.504526769352983
210.4566453321082150.9132906642164290.543354667891786
220.8746213366231860.2507573267536290.125378663376814
230.8889201575604510.2221596848790980.111079842439549
240.9183396774987190.1633206450025630.0816603225012813
250.9023246113869430.1953507772261150.0976753886130575
260.8974801261433230.2050397477133540.102519873856677
270.9799267123597930.0401465752804130.0200732876402065
280.9994303523678630.001139295264273120.000569647632136559
290.999999173874411.65225118084142e-068.26125590420712e-07
300.9999987148721762.57025564715519e-061.28512782357759e-06
310.999997025703575.94859286175864e-062.97429643087932e-06
320.9999937230547741.25538904512686e-056.27694522563431e-06
330.9999790095381954.19809236100496e-052.09904618050248e-05
340.999943615818920.0001127683621622555.63841810811277e-05
350.9998450085711630.0003099828576745760.000154991428837288
360.9995474883487590.0009050233024817460.000452511651240873
370.999060680330510.001878639338980510.000939319669490256
380.9978057444498840.004388511100231020.00219425555011551
390.9948267154865950.01034656902680920.00517328451340461
400.9903596103889140.01928077922217290.00964038961108646
410.9720789927962150.05584201440756930.0279210072037847
420.9473682046993940.1052635906012120.0526317953006059
430.8970774151426760.2058451697146480.102922584857324


Meta Analysis of Goldfeld-Quandt test for Heteroskedasticity
Description# significant tests% significant testsOK/NOK
1% type I error level110.407407407407407NOK
5% type I error level140.518518518518518NOK
10% type I error level150.555555555555556NOK

\begin{tabular}{lllllllll}
\hline
Meta Analysis of Goldfeld-Quandt test for Heteroskedasticity \tabularnewline
Description & # significant tests & % significant tests & OK/NOK \tabularnewline
1% type I error level & 11 & 0.407407407407407 & NOK \tabularnewline
5% type I error level & 14 & 0.518518518518518 & NOK \tabularnewline
10% type I error level & 15 & 0.555555555555556 & NOK \tabularnewline
\hline
\end{tabular}
%Source: https://freestatistics.org/blog/index.php?pk=57984&T=6

[TABLE]
[ROW][C]Meta Analysis of Goldfeld-Quandt test for Heteroskedasticity[/C][/ROW]
[ROW][C]Description[/C][C]# significant tests[/C][C]% significant tests[/C][C]OK/NOK[/C][/ROW]
[ROW][C]1% type I error level[/C][C]11[/C][C]0.407407407407407[/C][C]NOK[/C][/ROW]
[ROW][C]5% type I error level[/C][C]14[/C][C]0.518518518518518[/C][C]NOK[/C][/ROW]
[ROW][C]10% type I error level[/C][C]15[/C][C]0.555555555555556[/C][C]NOK[/C][/ROW]
[/TABLE]
Source: https://freestatistics.org/blog/index.php?pk=57984&T=6

Globally Unique Identifier (entire table): ba.freestatistics.org/blog/index.php?pk=57984&T=6

As an alternative you can also use a QR Code:  

The GUIDs for individual cells are displayed in the table below:

Meta Analysis of Goldfeld-Quandt test for Heteroskedasticity
Description# significant tests% significant testsOK/NOK
1% type I error level110.407407407407407NOK
5% type I error level140.518518518518518NOK
10% type I error level150.555555555555556NOK


Parameters (Session):
par1 = 1 ; par2 = Include Monthly Dummies ; par3 = Linear Trend ;
Parameters (R input):
par1 = 1 ; par2 = Include Monthly Dummies ; par3 = Linear Trend ;
R code (references can be found in the software module):
library(lattice)
library(lmtest)
n25 <- 25 #minimum number of obs. for Goldfeld-Quandt test
par1 <- as.numeric(par1)
x <- t(y)
k <- length(x[1,])
n <- length(x[,1])
x1 <- cbind(x[,par1], x[,1:k!=par1])
mycolnames <- c(colnames(x)[par1], colnames(x)[1:k!=par1])
colnames(x1) <- mycolnames #colnames(x)[par1]
x <- x1
if (par3 == 'First Differences'){
x2 <- array(0, dim=c(n-1,k), dimnames=list(1:(n-1), paste('(1-B)',colnames(x),sep='')))
for (i in 1:n-1) {
for (j in 1:k) {
x2[i,j] <- x[i+1,j] - x[i,j]
}
}
x <- x2
}
if (par2 == 'Include Monthly Dummies'){
x2 <- array(0, dim=c(n,11), dimnames=list(1:n, paste('M', seq(1:11), sep ='')))
for (i in 1:11){
x2[seq(i,n,12),i] <- 1
}
x <- cbind(x, x2)
}
if (par2 == 'Include Quarterly Dummies'){
x2 <- array(0, dim=c(n,3), dimnames=list(1:n, paste('Q', seq(1:3), sep ='')))
for (i in 1:3){
x2[seq(i,n,4),i] <- 1
}
x <- cbind(x, x2)
}
k <- length(x[1,])
if (par3 == 'Linear Trend'){
x <- cbind(x, c(1:n))
colnames(x)[k+1] <- 't'
}
x
k <- length(x[1,])
df <- as.data.frame(x)
(mylm <- lm(df))
(mysum <- summary(mylm))
if (n > n25) {
kp3 <- k + 3
nmkm3 <- n - k - 3
gqarr <- array(NA, dim=c(nmkm3-kp3+1,3))
numgqtests <- 0
numsignificant1 <- 0
numsignificant5 <- 0
numsignificant10 <- 0
for (mypoint in kp3:nmkm3) {
j <- 0
numgqtests <- numgqtests + 1
for (myalt in c('greater', 'two.sided', 'less')) {
j <- j + 1
gqarr[mypoint-kp3+1,j] <- gqtest(mylm, point=mypoint, alternative=myalt)$p.value
}
if (gqarr[mypoint-kp3+1,2] < 0.01) numsignificant1 <- numsignificant1 + 1
if (gqarr[mypoint-kp3+1,2] < 0.05) numsignificant5 <- numsignificant5 + 1
if (gqarr[mypoint-kp3+1,2] < 0.10) numsignificant10 <- numsignificant10 + 1
}
gqarr
}
bitmap(file='test0.png')
plot(x[,1], type='l', main='Actuals and Interpolation', ylab='value of Actuals and Interpolation (dots)', xlab='time or index')
points(x[,1]-mysum$resid)
grid()
dev.off()
bitmap(file='test1.png')
plot(mysum$resid, type='b', pch=19, main='Residuals', ylab='value of Residuals', xlab='time or index')
grid()
dev.off()
bitmap(file='test2.png')
hist(mysum$resid, main='Residual Histogram', xlab='values of Residuals')
grid()
dev.off()
bitmap(file='test3.png')
densityplot(~mysum$resid,col='black',main='Residual Density Plot', xlab='values of Residuals')
dev.off()
bitmap(file='test4.png')
qqnorm(mysum$resid, main='Residual Normal Q-Q Plot')
qqline(mysum$resid)
grid()
dev.off()
(myerror <- as.ts(mysum$resid))
bitmap(file='test5.png')
dum <- cbind(lag(myerror,k=1),myerror)
dum
dum1 <- dum[2:length(myerror),]
dum1
z <- as.data.frame(dum1)
z
plot(z,main=paste('Residual Lag plot, lowess, and regression line'), ylab='values of Residuals', xlab='lagged values of Residuals')
lines(lowess(z))
abline(lm(z))
grid()
dev.off()
bitmap(file='test6.png')
acf(mysum$resid, lag.max=length(mysum$resid)/2, main='Residual Autocorrelation Function')
grid()
dev.off()
bitmap(file='test7.png')
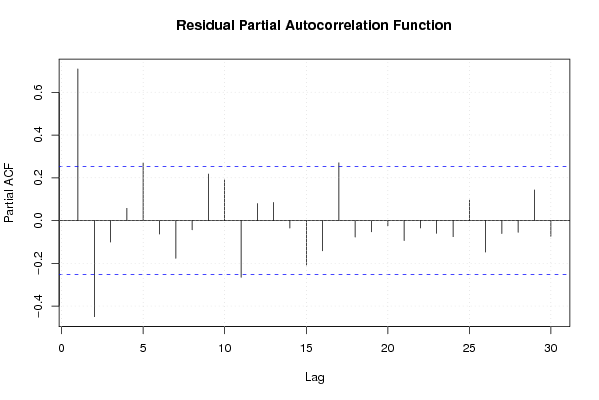
pacf(mysum$resid, lag.max=length(mysum$resid)/2, main='Residual Partial Autocorrelation Function')
grid()
dev.off()
bitmap(file='test8.png')
opar <- par(mfrow = c(2,2), oma = c(0, 0, 1.1, 0))
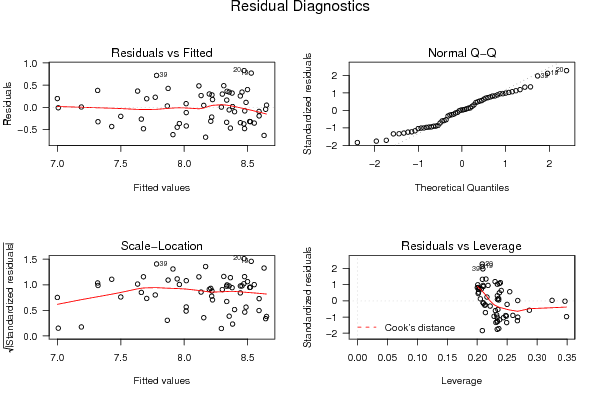
plot(mylm, las = 1, sub='Residual Diagnostics')
par(opar)
dev.off()
if (n > n25) {
bitmap(file='test9.png')
plot(kp3:nmkm3,gqarr[,2], main='Goldfeld-Quandt test',ylab='2-sided p-value',xlab='breakpoint')
grid()
dev.off()
}
load(file='createtable')
a<-table.start()
a<-table.row.start(a)
a<-table.element(a, 'Multiple Linear Regression - Estimated Regression Equation', 1, TRUE)
a<-table.row.end(a)
myeq <- colnames(x)[1]
myeq <- paste(myeq, '[t] = ', sep='')
for (i in 1:k){
if (mysum$coefficients[i,1] > 0) myeq <- paste(myeq, '+', '')
myeq <- paste(myeq, mysum$coefficients[i,1], sep=' ')
if (rownames(mysum$coefficients)[i] != '(Intercept)') {
myeq <- paste(myeq, rownames(mysum$coefficients)[i], sep='')
if (rownames(mysum$coefficients)[i] != 't') myeq <- paste(myeq, '[t]', sep='')
}
}
myeq <- paste(myeq, ' + e[t]')
a<-table.row.start(a)
a<-table.element(a, myeq)
a<-table.row.end(a)
a<-table.end(a)
table.save(a,file='mytable1.tab')
a<-table.start()
a<-table.row.start(a)
a<-table.element(a,hyperlink('ols1.htm','Multiple Linear Regression - Ordinary Least Squares',''), 6, TRUE)
a<-table.row.end(a)
a<-table.row.start(a)
a<-table.element(a,'Variable',header=TRUE)
a<-table.element(a,'Parameter',header=TRUE)
a<-table.element(a,'S.D.',header=TRUE)
a<-table.element(a,'T-STAT
H0: parameter = 0',header=TRUE)
a<-table.element(a,'2-tail p-value',header=TRUE)
a<-table.element(a,'1-tail p-value',header=TRUE)
a<-table.row.end(a)
for (i in 1:k){
a<-table.row.start(a)
a<-table.element(a,rownames(mysum$coefficients)[i],header=TRUE)
a<-table.element(a,mysum$coefficients[i,1])
a<-table.element(a, round(mysum$coefficients[i,2],6))
a<-table.element(a, round(mysum$coefficients[i,3],4))
a<-table.element(a, round(mysum$coefficients[i,4],6))
a<-table.element(a, round(mysum$coefficients[i,4]/2,6))
a<-table.row.end(a)
}
a<-table.end(a)
table.save(a,file='mytable2.tab')
a<-table.start()
a<-table.row.start(a)
a<-table.element(a, 'Multiple Linear Regression - Regression Statistics', 2, TRUE)
a<-table.row.end(a)
a<-table.row.start(a)
a<-table.element(a, 'Multiple R',1,TRUE)
a<-table.element(a, sqrt(mysum$r.squared))
a<-table.row.end(a)
a<-table.row.start(a)
a<-table.element(a, 'R-squared',1,TRUE)
a<-table.element(a, mysum$r.squared)
a<-table.row.end(a)
a<-table.row.start(a)
a<-table.element(a, 'Adjusted R-squared',1,TRUE)
a<-table.element(a, mysum$adj.r.squared)
a<-table.row.end(a)
a<-table.row.start(a)
a<-table.element(a, 'F-TEST (value)',1,TRUE)
a<-table.element(a, mysum$fstatistic[1])
a<-table.row.end(a)
a<-table.row.start(a)
a<-table.element(a, 'F-TEST (DF numerator)',1,TRUE)
a<-table.element(a, mysum$fstatistic[2])
a<-table.row.end(a)
a<-table.row.start(a)
a<-table.element(a, 'F-TEST (DF denominator)',1,TRUE)
a<-table.element(a, mysum$fstatistic[3])
a<-table.row.end(a)
a<-table.row.start(a)
a<-table.element(a, 'p-value',1,TRUE)
a<-table.element(a, 1-pf(mysum$fstatistic[1],mysum$fstatistic[2],mysum$fstatistic[3]))
a<-table.row.end(a)
a<-table.row.start(a)
a<-table.element(a, 'Multiple Linear Regression - Residual Statistics', 2, TRUE)
a<-table.row.end(a)
a<-table.row.start(a)
a<-table.element(a, 'Residual Standard Deviation',1,TRUE)
a<-table.element(a, mysum$sigma)
a<-table.row.end(a)
a<-table.row.start(a)
a<-table.element(a, 'Sum Squared Residuals',1,TRUE)
a<-table.element(a, sum(myerror*myerror))
a<-table.row.end(a)
a<-table.end(a)
table.save(a,file='mytable3.tab')
a<-table.start()
a<-table.row.start(a)
a<-table.element(a, 'Multiple Linear Regression - Actuals, Interpolation, and Residuals', 4, TRUE)
a<-table.row.end(a)
a<-table.row.start(a)
a<-table.element(a, 'Time or Index', 1, TRUE)
a<-table.element(a, 'Actuals', 1, TRUE)
a<-table.element(a, 'Interpolation
Forecast', 1, TRUE)
a<-table.element(a, 'Residuals
Prediction Error', 1, TRUE)
a<-table.row.end(a)
for (i in 1:n) {
a<-table.row.start(a)
a<-table.element(a,i, 1, TRUE)
a<-table.element(a,x[i])
a<-table.element(a,x[i]-mysum$resid[i])
a<-table.element(a,mysum$resid[i])
a<-table.row.end(a)
}
a<-table.end(a)
table.save(a,file='mytable4.tab')
if (n > n25) {
a<-table.start()
a<-table.row.start(a)
a<-table.element(a,'Goldfeld-Quandt test for Heteroskedasticity',4,TRUE)
a<-table.row.end(a)
a<-table.row.start(a)
a<-table.element(a,'p-values',header=TRUE)
a<-table.element(a,'Alternative Hypothesis',3,header=TRUE)
a<-table.row.end(a)
a<-table.row.start(a)
a<-table.element(a,'breakpoint index',header=TRUE)
a<-table.element(a,'greater',header=TRUE)
a<-table.element(a,'2-sided',header=TRUE)
a<-table.element(a,'less',header=TRUE)
a<-table.row.end(a)
for (mypoint in kp3:nmkm3) {
a<-table.row.start(a)
a<-table.element(a,mypoint,header=TRUE)
a<-table.element(a,gqarr[mypoint-kp3+1,1])
a<-table.element(a,gqarr[mypoint-kp3+1,2])
a<-table.element(a,gqarr[mypoint-kp3+1,3])
a<-table.row.end(a)
}
a<-table.end(a)
table.save(a,file='mytable5.tab')
a<-table.start()
a<-table.row.start(a)
a<-table.element(a,'Meta Analysis of Goldfeld-Quandt test for Heteroskedasticity',4,TRUE)
a<-table.row.end(a)
a<-table.row.start(a)
a<-table.element(a,'Description',header=TRUE)
a<-table.element(a,'# significant tests',header=TRUE)
a<-table.element(a,'% significant tests',header=TRUE)
a<-table.element(a,'OK/NOK',header=TRUE)
a<-table.row.end(a)
a<-table.row.start(a)
a<-table.element(a,'1% type I error level',header=TRUE)
a<-table.element(a,numsignificant1)
a<-table.element(a,numsignificant1/numgqtests)
if (numsignificant1/numgqtests < 0.01) dum <- 'OK' else dum <- 'NOK'
a<-table.element(a,dum)
a<-table.row.end(a)
a<-table.row.start(a)
a<-table.element(a,'5% type I error level',header=TRUE)
a<-table.element(a,numsignificant5)
a<-table.element(a,numsignificant5/numgqtests)
if (numsignificant5/numgqtests < 0.05) dum <- 'OK' else dum <- 'NOK'
a<-table.element(a,dum)
a<-table.row.end(a)
a<-table.row.start(a)
a<-table.element(a,'10% type I error level',header=TRUE)
a<-table.element(a,numsignificant10)
a<-table.element(a,numsignificant10/numgqtests)
if (numsignificant10/numgqtests < 0.1) dum <- 'OK' else dum <- 'NOK'
a<-table.element(a,dum)
a<-table.row.end(a)
a<-table.end(a)
table.save(a,file='mytable6.tab')
}