| Multiple Linear Regression - Estimated Regression Equation |
| wkh[t] = + 29.0258358269593 -7.66040871202718e-05los[t] -0.0102476863359301M1[t] -0.0367149244378123M2[t] -0.542583206261581M3[t] -0.703472642147917M4[t] -0.83090672136853M5[t] -0.083568878298148M6[t] + 0.0373315671599241M7[t] + 0.0617584549197351M8[t] -0.35840149526647M9[t] -0.458542865393233M10[t] -0.483361368749547M11[t] + 0.00841726582995854t + e[t] |
| Multiple Linear Regression - Ordinary Least Squares | |||||
| Variable | Parameter | S.D. | T-STAT H0: parameter = 0 | 2-tail p-value | 1-tail p-value |
| (Intercept) | 29.0258358269593 | 4.492625 | 6.4608 | 0 | 0 |
| los | -7.66040871202718e-05 | 1.7e-05 | -4.5049 | 4.5e-05 | 2.3e-05 |
| M1 | -0.0102476863359301 | 0.260733 | -0.0393 | 0.968819 | 0.484409 |
| M2 | -0.0367149244378123 | 0.261875 | -0.1402 | 0.889114 | 0.444557 |
| M3 | -0.542583206261581 | 0.262041 | -2.0706 | 0.044035 | 0.022017 |
| M4 | -0.703472642147917 | 0.260294 | -2.7026 | 0.009605 | 0.004803 |
| M5 | -0.83090672136853 | 0.259756 | -3.1988 | 0.0025 | 0.00125 |
| M6 | -0.083568878298148 | 0.259079 | -0.3226 | 0.748489 | 0.374245 |
| M7 | 0.0373315671599241 | 0.258963 | 0.1442 | 0.886005 | 0.443003 |
| M8 | 0.0617584549197351 | 0.259667 | 0.2378 | 0.813063 | 0.406532 |
| M9 | -0.35840149526647 | 0.26083 | -1.3741 | 0.176075 | 0.088037 |
| M10 | -0.458542865393233 | 0.260063 | -1.7632 | 0.084509 | 0.042255 |
| M11 | -0.483361368749547 | 0.266248 | -1.8155 | 0.075976 | 0.037988 |
| t | 0.00841726582995854 | 0.006004 | 1.402 | 0.167622 | 0.083811 |
| Multiple Linear Regression - Regression Statistics | |
| Multiple R | 0.759797768866946 |
| R-squared | 0.577292649575189 |
| Adjusted R-squared | 0.457831876629046 |
| F-TEST (value) | 4.83248714484256 |
| F-TEST (DF numerator) | 13 |
| F-TEST (DF denominator) | 46 |
| p-value | 3.19679927507366e-05 |
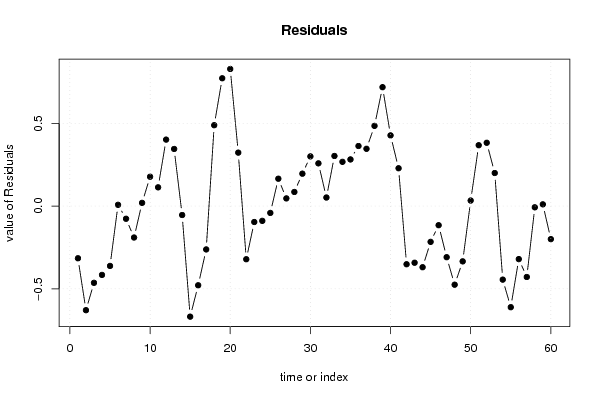
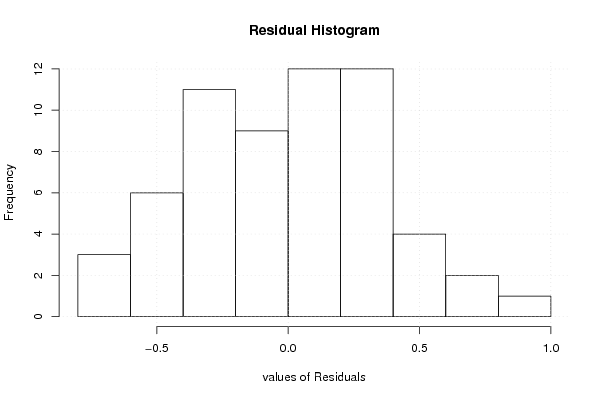
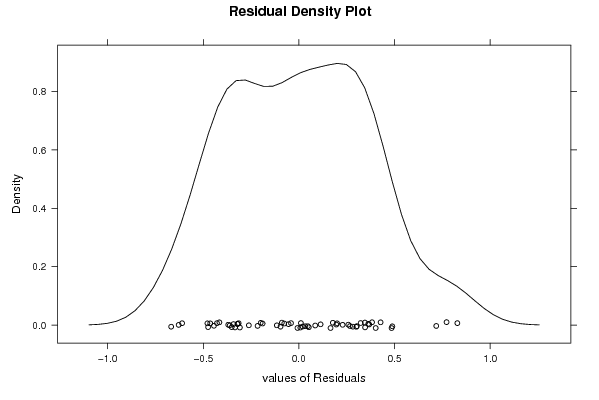
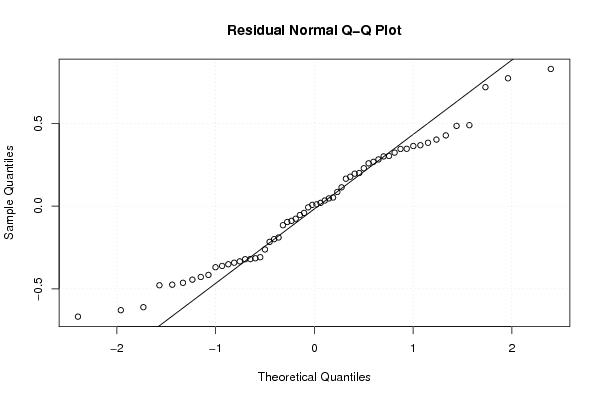
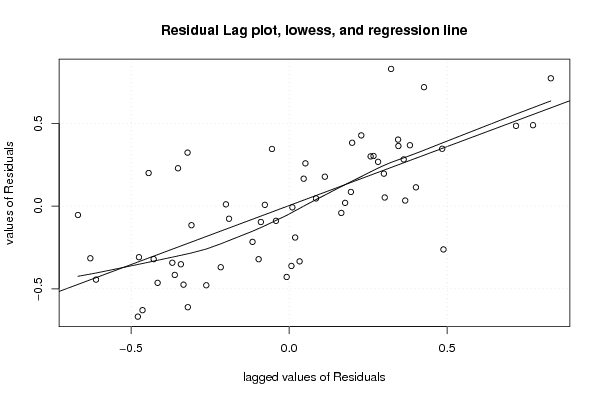
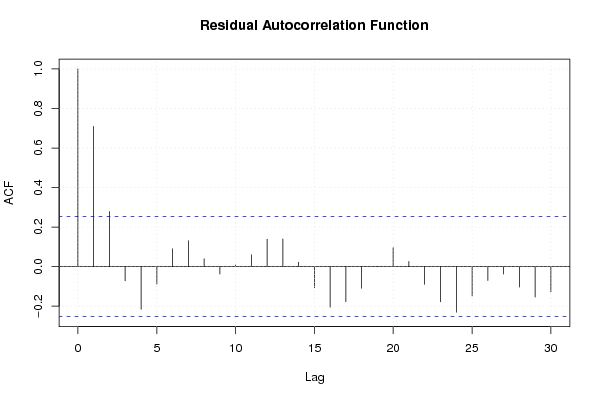
| Multiple Linear Regression - Residual Statistics | |
| Residual Standard Deviation | 0.408573917739366 |
| Sum Squared Residuals | 7.67890172781713 |
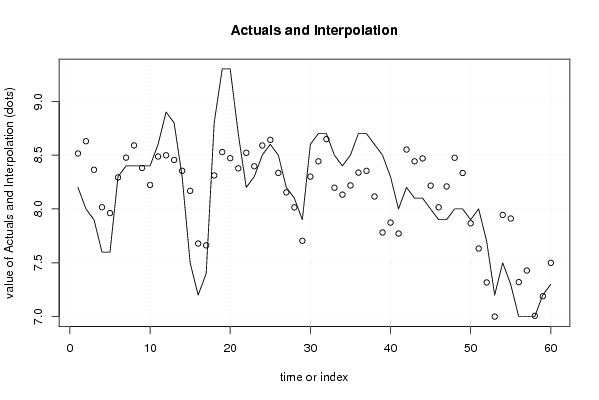
| Multiple Linear Regression - Actuals, Interpolation, and Residuals | |||
| Time or Index | Actuals | Interpolation Forecast | Residuals Prediction Error |
| 1 | 8.2 | 8.51540599443998 | -0.315405994439982 |
| 2 | 8 | 8.62903844792777 | -0.629038447927774 |
| 3 | 7.9 | 8.36385102408263 | -0.463851024082628 |
| 4 | 7.6 | 8.01603843186956 | -0.416038431869558 |
| 5 | 7.6 | 7.96175207209553 | -0.361752072095532 |
| 6 | 8.3 | 8.29258430973972 | 0.00741569026027663 |
| 7 | 8.4 | 8.47667394331875 | -0.0766739433187496 |
| 8 | 8.4 | 8.59002899247193 | -0.190028992471925 |
| 9 | 8.4 | 8.38075091037456 | 0.0192490896254434 |
| 10 | 8.4 | 8.2226876666316 | 0.177312333368403 |
| 11 | 8.6 | 8.48681059613968 | 0.113189403860323 |
| 12 | 8.9 | 8.49851141673644 | 0.401488583263561 |
| 13 | 8.8 | 8.45500837283704 | 0.344991627162961 |
| 14 | 8.3 | 8.35407277830098 | -0.054072778300981 |
| 15 | 7.5 | 8.16817058462532 | -0.668170584625318 |
| 16 | 7.2 | 7.67864043123974 | -0.478640431239744 |
| 17 | 7.4 | 7.6620432823289 | -0.262043282328893 |
| 18 | 8.8 | 8.31139531421918 | 0.488604685780825 |
| 19 | 9.3 | 8.5279650807372 | 0.772034919262805 |
| 20 | 9.3 | 8.47156547283185 | 0.828434527168152 |
| 21 | 8.7 | 8.37719352141489 | 0.322806478585111 |
| 22 | 8.2 | 8.52125679727428 | -0.321256797274281 |
| 23 | 8.3 | 8.3963075682985 | -0.0963075682984987 |
| 24 | 8.5 | 8.58925365902182 | -0.0892536590218252 |
| 25 | 8.6 | 8.64142911993565 | -0.0414291199356455 |
| 26 | 8.5 | 8.33473494739454 | 0.165265052605463 |
| 27 | 8.2 | 8.15373541529457 | 0.0462645847054288 |
| 28 | 8.1 | 8.01474556457136 | 0.0852544354286385 |
| 29 | 7.9 | 7.70429513746715 | 0.195704862532853 |
| 30 | 8.6 | 8.29994770428612 | 0.300052295713881 |
| 31 | 8.7 | 8.441905089949 | 0.258094910051005 |
| 32 | 8.7 | 8.6483341049533 | 0.0516658950466994 |
| 33 | 8.5 | 8.19729352390435 | 0.302706476095646 |
| 34 | 8.4 | 8.13276387053525 | 0.267236129464754 |
| 35 | 8.5 | 8.21832267296597 | 0.281677327034028 |
| 36 | 8.7 | 8.33726921553112 | 0.362730784468884 |
| 37 | 8.7 | 8.35405358819537 | 0.34594641180463 |
| 38 | 8.6 | 8.11546044910418 | 0.484539550895816 |
| 39 | 8.5 | 7.78178897137351 | 0.718211028626485 |
| 40 | 8.3 | 7.87299440244672 | 0.427005597553279 |
| 41 | 8 | 7.77151992500661 | 0.22848007499339 |
| 42 | 8.2 | 8.55155852952408 | -0.351558529524077 |
| 43 | 8.1 | 8.4424077176067 | -0.342407717606701 |
| 44 | 8.1 | 8.46958316874957 | -0.36958316874957 |
| 45 | 8 | 8.21625773655805 | -0.216257736558046 |
| 46 | 7.9 | 8.01567922446334 | -0.115679224463335 |
| 47 | 7.9 | 8.20894337338516 | -0.308943373385162 |
| 48 | 8 | 8.47504636730835 | -0.475046367308348 |
| 49 | 8 | 8.33410292459196 | -0.334102924591963 |
| 50 | 7.9 | 7.86669337727252 | 0.0333066227274757 |
| 51 | 8 | 7.63245400462397 | 0.367545995376031 |
| 52 | 7.7 | 7.31758116987262 | 0.382418830127385 |
| 53 | 7.2 | 7.00038958310182 | 0.199610416898182 |
| 54 | 7.5 | 7.9445141422309 | -0.444514142230906 |
| 55 | 7.3 | 7.91104816838836 | -0.611048168388359 |
| 56 | 7 | 7.32048826099336 | -0.320488260993356 |
| 57 | 7 | 7.42850430774815 | -0.428504307748154 |
| 58 | 7 | 7.00761244109554 | -0.0076124410955417 |
| 59 | 7.2 | 7.18961578921069 | 0.0103842107893105 |
| 60 | 7.3 | 7.49991934140227 | -0.199919341402272 |
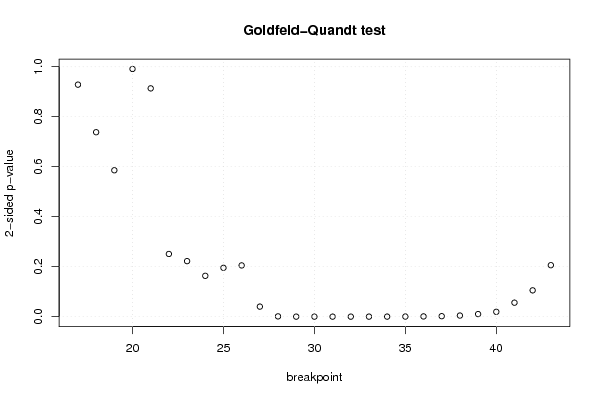
| Goldfeld-Quandt test for Heteroskedasticity | |||
| p-values | Alternative Hypothesis | ||
| breakpoint index | greater | 2-sided | less |
| 17 | 0.535953250582728 | 0.928093498834545 | 0.464046749417272 |
| 18 | 0.368908566955646 | 0.737817133911293 | 0.631091433044354 |
| 19 | 0.292830064071253 | 0.585660128142507 | 0.707169935928747 |
| 20 | 0.495473230647017 | 0.990946461294035 | 0.504526769352983 |
| 21 | 0.456645332108215 | 0.913290664216429 | 0.543354667891786 |
| 22 | 0.874621336623186 | 0.250757326753629 | 0.125378663376814 |
| 23 | 0.888920157560451 | 0.222159684879098 | 0.111079842439549 |
| 24 | 0.918339677498719 | 0.163320645002563 | 0.0816603225012813 |
| 25 | 0.902324611386943 | 0.195350777226115 | 0.0976753886130575 |
| 26 | 0.897480126143323 | 0.205039747713354 | 0.102519873856677 |
| 27 | 0.979926712359793 | 0.040146575280413 | 0.0200732876402065 |
| 28 | 0.999430352367863 | 0.00113929526427312 | 0.000569647632136559 |
| 29 | 0.99999917387441 | 1.65225118084142e-06 | 8.26125590420712e-07 |
| 30 | 0.999998714872176 | 2.57025564715519e-06 | 1.28512782357759e-06 |
| 31 | 0.99999702570357 | 5.94859286175864e-06 | 2.97429643087932e-06 |
| 32 | 0.999993723054774 | 1.25538904512686e-05 | 6.27694522563431e-06 |
| 33 | 0.999979009538195 | 4.19809236100496e-05 | 2.09904618050248e-05 |
| 34 | 0.99994361581892 | 0.000112768362162255 | 5.63841810811277e-05 |
| 35 | 0.999845008571163 | 0.000309982857674576 | 0.000154991428837288 |
| 36 | 0.999547488348759 | 0.000905023302481746 | 0.000452511651240873 |
| 37 | 0.99906068033051 | 0.00187863933898051 | 0.000939319669490256 |
| 38 | 0.997805744449884 | 0.00438851110023102 | 0.00219425555011551 |
| 39 | 0.994826715486595 | 0.0103465690268092 | 0.00517328451340461 |
| 40 | 0.990359610388914 | 0.0192807792221729 | 0.00964038961108646 |
| 41 | 0.972078992796215 | 0.0558420144075693 | 0.0279210072037847 |
| 42 | 0.947368204699394 | 0.105263590601212 | 0.0526317953006059 |
| 43 | 0.897077415142676 | 0.205845169714648 | 0.102922584857324 |
| Meta Analysis of Goldfeld-Quandt test for Heteroskedasticity | |||
| Description | # significant tests | % significant tests | OK/NOK |
| 1% type I error level | 11 | 0.407407407407407 | NOK |
| 5% type I error level | 14 | 0.518518518518518 | NOK |
| 10% type I error level | 15 | 0.555555555555556 | NOK |