| Multiple Linear Regression - Estimated Regression Equation |
| Werkl[t] = + 91.491378559978 + 0.153267237582525Infl[t] + 0.0739357297362894M1[t] -0.0975590909259045M2[t] -0.235867431137875M3[t] -0.331874013777070M4[t] -0.22297054679554M5[t] -0.224489251969629M6[t] -0.261953247870372M7[t] -0.446548293832267M8[t] -0.365388945862221M9[t] -0.293576150375666M10[t] -0.0235218046077498M11[t] -0.0802397445445542t + e[t] |
| Multiple Linear Regression - Ordinary Least Squares | |||||
| Variable | Parameter | S.D. | T-STAT H0: parameter = 0 | 2-tail p-value | 1-tail p-value |
| (Intercept) | 91.491378559978 | 12.231892 | 7.4797 | 0 | 0 |
| Infl | 0.153267237582525 | 0.12668 | 1.2099 | 0.232645 | 0.116322 |
| M1 | 0.0739357297362894 | 0.215315 | 0.3434 | 0.732909 | 0.366454 |
| M2 | -0.0975590909259045 | 0.276681 | -0.3526 | 0.72603 | 0.363015 |
| M3 | -0.235867431137875 | 0.298492 | -0.7902 | 0.433557 | 0.216778 |
| M4 | -0.331874013777070 | 0.294718 | -1.1261 | 0.266104 | 0.133052 |
| M5 | -0.22297054679554 | 0.243827 | -0.9145 | 0.365349 | 0.182675 |
| M6 | -0.224489251969629 | 0.211245 | -1.0627 | 0.29359 | 0.146795 |
| M7 | -0.261953247870372 | 0.216299 | -1.2111 | 0.23219 | 0.116095 |
| M8 | -0.446548293832267 | 0.252702 | -1.7671 | 0.083994 | 0.041997 |
| M9 | -0.365388945862221 | 0.241149 | -1.5152 | 0.136716 | 0.068358 |
| M10 | -0.293576150375666 | 0.218438 | -1.344 | 0.185692 | 0.092846 |
| M11 | -0.0235218046077498 | 0.196627 | -0.1196 | 0.905311 | 0.452656 |
| t | -0.0802397445445542 | 0.018546 | -4.3266 | 8.3e-05 | 4.2e-05 |
| Multiple Linear Regression - Regression Statistics | |
| Multiple R | 0.969649892450111 |
| R-squared | 0.940220913928512 |
| Adjusted R-squared | 0.922951400174526 |
| F-TEST (value) | 54.4439714587521 |
| F-TEST (DF numerator) | 13 |
| F-TEST (DF denominator) | 45 |
| p-value | 0 |
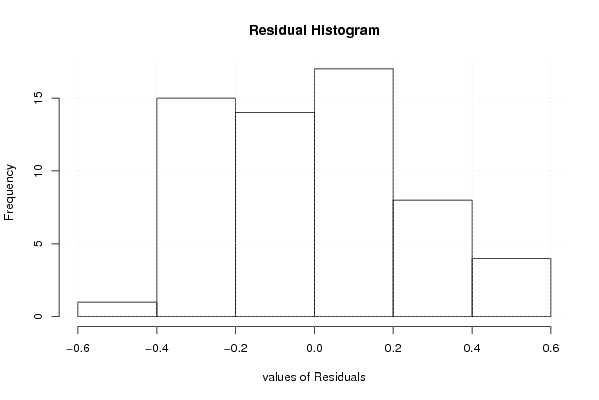
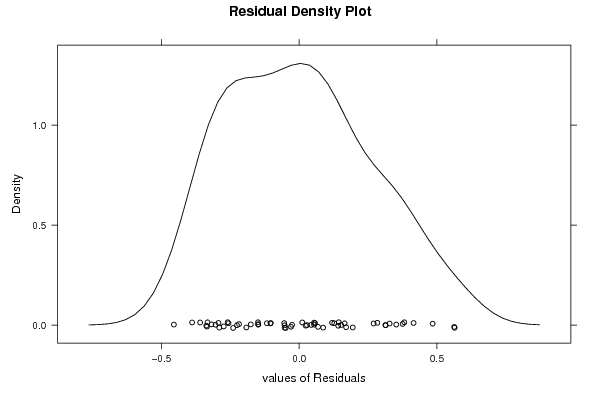
| Multiple Linear Regression - Residual Statistics | |
| Residual Standard Deviation | 0.292594098675783 |
| Sum Squared Residuals | 3.85250879609523 |
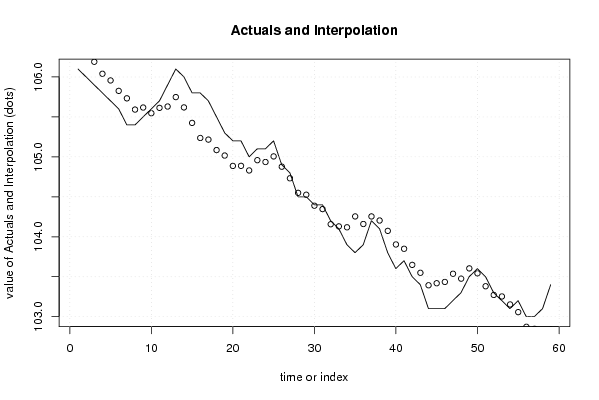
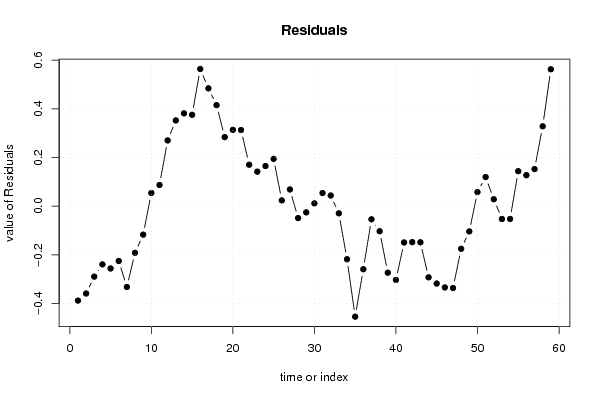
| Multiple Linear Regression - Actuals, Interpolation, and Residuals | |||
| Time or Index | Actuals | Interpolation Forecast | Residuals Prediction Error |
| 1 | 106.1 | 106.488404432123 | -0.388404432122857 |
| 2 | 106 | 106.359283656982 | -0.359283656982363 |
| 3 | 105.9 | 106.189781088252 | -0.289781088252242 |
| 4 | 105.8 | 106.039590191458 | -0.239590191457530 |
| 5 | 105.7 | 105.956368830459 | -0.256368830459257 |
| 6 | 105.6 | 105.825564864714 | -0.225564864714213 |
| 7 | 105.4 | 105.732383882282 | -0.33238388228211 |
| 8 | 105.4 | 105.591695554218 | -0.191695554217505 |
| 9 | 105.5 | 105.617137915656 | -0.117137915656208 |
| 10 | 105.6 | 105.545871399189 | 0.0541286008106235 |
| 11 | 105.7 | 105.613072210347 | 0.0869277896532885 |
| 12 | 105.9 | 105.629922544450 | 0.270077455550484 |
| 13 | 106.1 | 105.747764992083 | 0.352235007916891 |
| 14 | 106 | 105.618644216942 | 0.381355783057624 |
| 15 | 105.8 | 105.424618890199 | 0.375381109800943 |
| 16 | 105.8 | 105.236111184009 | 0.563888815991294 |
| 17 | 105.7 | 105.215729390419 | 0.484270609580731 |
| 18 | 105.5 | 105.084925424674 | 0.41507457532578 |
| 19 | 105.3 | 105.016267200255 | 0.283732799744666 |
| 20 | 105.2 | 104.886307578822 | 0.313692421178498 |
| 21 | 105.2 | 104.887227182247 | 0.312772817753007 |
| 22 | 105 | 104.829754717163 | 0.170245282837413 |
| 23 | 105.1 | 104.958262423353 | 0.141737576647053 |
| 24 | 105.1 | 104.935263275684 | 0.164736724315702 |
| 25 | 105.2 | 105.005592879667 | 0.194407120332713 |
| 26 | 104.9 | 104.876472104527 | 0.0235278954734443 |
| 27 | 104.8 | 104.731492293810 | 0.0685077061903472 |
| 28 | 104.5 | 104.549115277123 | -0.0491152771225977 |
| 29 | 104.5 | 104.525668138782 | -0.0256681387815173 |
| 30 | 104.4 | 104.388733483533 | 0.0112665164668423 |
| 31 | 104.4 | 104.346130689503 | 0.0538693104967011 |
| 32 | 104.2 | 104.156396845412 | 0.0436031545877104 |
| 33 | 104.1 | 104.129728346073 | -0.0297283460729360 |
| 34 | 103.9 | 104.118236052263 | -0.218236052263273 |
| 35 | 103.8 | 104.254407120333 | -0.454407120332761 |
| 36 | 103.9 | 104.159372371000 | -0.259372371000317 |
| 37 | 104.2 | 104.254224732997 | -0.054224732996521 |
| 38 | 104.1 | 104.203270249023 | -0.10327024902289 |
| 39 | 103.8 | 104.073617162064 | -0.273617162064228 |
| 40 | 103.6 | 103.903501524384 | -0.303501524383782 |
| 41 | 103.7 | 103.849400938526 | -0.149400938526185 |
| 42 | 103.5 | 103.648094043493 | -0.148094043493175 |
| 43 | 103.4 | 103.548782371558 | -0.148782371557775 |
| 44 | 103.1 | 103.392767319735 | -0.292767319734931 |
| 45 | 103.1 | 103.418209681174 | -0.318209681173628 |
| 46 | 103.1 | 103.434305490129 | -0.334305490128832 |
| 47 | 103.2 | 103.536757765930 | -0.336757765930146 |
| 48 | 103.3 | 103.475441808866 | -0.175441808865870 |
| 49 | 103.5 | 103.604012963130 | -0.104012963130227 |
| 50 | 103.6 | 103.542329772526 | 0.0576702274741849 |
| 51 | 103.5 | 103.380490565675 | 0.11950943432518 |
| 52 | 103.3 | 103.271681823027 | 0.0283181769726160 |
| 53 | 103.2 | 103.252832701814 | -0.0528327018137714 |
| 54 | 103.1 | 103.152682183585 | -0.0526821835852335 |
| 55 | 103.2 | 103.056435856401 | 0.143564143598519 |
| 56 | 103 | 102.872832701814 | 0.127167298186226 |
| 57 | 103 | 102.847696874850 | 0.152303125149765 |
| 58 | 103.1 | 102.771832341256 | 0.328167658744069 |
| 59 | 103.4 | 102.837500480037 | 0.562499519962565 |
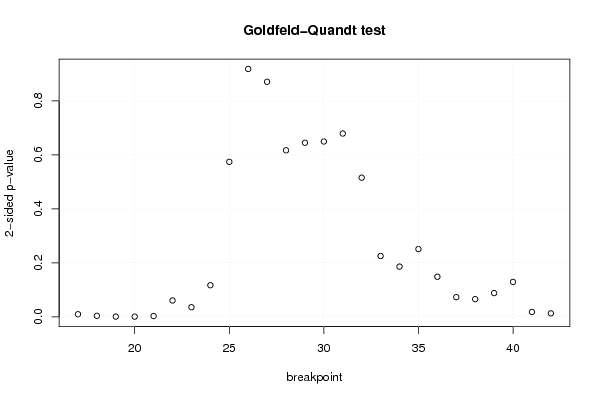
| Goldfeld-Quandt test for Heteroskedasticity | |||
| p-values | Alternative Hypothesis | ||
| breakpoint index | greater | 2-sided | less |
| 17 | 0.00475826936044502 | 0.00951653872089004 | 0.995241730639555 |
| 18 | 0.00189385854555843 | 0.00378771709111686 | 0.998106141454442 |
| 19 | 0.000426111327040718 | 0.000852222654081436 | 0.99957388867296 |
| 20 | 0.000312593041501181 | 0.000625186083002361 | 0.999687406958499 |
| 21 | 0.00135732426594403 | 0.00271464853188806 | 0.998642675734056 |
| 22 | 0.0303172593554905 | 0.060634518710981 | 0.96968274064451 |
| 23 | 0.0177926153806101 | 0.0355852307612201 | 0.98220738461939 |
| 24 | 0.0585337692293472 | 0.117067538458694 | 0.941466230770653 |
| 25 | 0.287185452589496 | 0.574370905178991 | 0.712814547410505 |
| 26 | 0.540667724348018 | 0.918664551303964 | 0.459332275651982 |
| 27 | 0.564497545663184 | 0.871004908673631 | 0.435502454336816 |
| 28 | 0.69142496012081 | 0.617150079758379 | 0.308575039879190 |
| 29 | 0.677448217804985 | 0.645103564390029 | 0.322551782195015 |
| 30 | 0.675101136058609 | 0.649797727882783 | 0.324898863941392 |
| 31 | 0.660380555172001 | 0.679238889655998 | 0.339619444827999 |
| 32 | 0.742145860473345 | 0.51570827905331 | 0.257854139526655 |
| 33 | 0.887318666488898 | 0.225362667022204 | 0.112681333511102 |
| 34 | 0.90693431141704 | 0.18613137716592 | 0.09306568858296 |
| 35 | 0.87452889705197 | 0.250942205896058 | 0.125471102948029 |
| 36 | 0.925742891921038 | 0.148514216157924 | 0.0742571080789618 |
| 37 | 0.963557214435686 | 0.072885571128628 | 0.036442785564314 |
| 38 | 0.967271821113423 | 0.0654563577731549 | 0.0327281788865775 |
| 39 | 0.95598716092845 | 0.0880256781431009 | 0.0440128390715504 |
| 40 | 0.935336605583656 | 0.129326788832688 | 0.0646633944163438 |
| 41 | 0.991021455007308 | 0.0179570899853831 | 0.00897854499269157 |
| 42 | 0.993578091727347 | 0.0128438165453064 | 0.00642190827265319 |
| Meta Analysis of Goldfeld-Quandt test for Heteroskedasticity | |||
| Description | # significant tests | % significant tests | OK/NOK |
| 1% type I error level | 5 | 0.192307692307692 | NOK |
| 5% type I error level | 8 | 0.307692307692308 | NOK |
| 10% type I error level | 12 | 0.461538461538462 | NOK |