| Multiple Linear Regression - Estimated Regression Equation |
| Y[t] = + 6.31542137271935 + 0.362417773364777X[t] -0.263814178147375M1[t] -0.264809689297091M2[t] -0.245805200446816M3[t] -0.252304000661949M4[t] -0.195044578213561M5[t] -0.176040089363286M6[t] -0.200525733316784M7[t] -0.176017955401100M8[t] -0.149765111083529M9[t] -0.0635122667659586M10[t] -0.0300110669810927M11[t] -0.024507777915684t + e[t] |
| Multiple Linear Regression - Ordinary Least Squares | |||||
| Variable | Parameter | S.D. | T-STAT H0: parameter = 0 | 2-tail p-value | 1-tail p-value |
| (Intercept) | 6.31542137271935 | 0.969361 | 6.515 | 0 | 0 |
| X | 0.362417773364777 | 0.107132 | 3.3829 | 0.001474 | 0.000737 |
| M1 | -0.263814178147375 | 0.194209 | -1.3584 | 0.18096 | 0.09048 |
| M2 | -0.264809689297091 | 0.193965 | -1.3652 | 0.178816 | 0.089408 |
| M3 | -0.245805200446816 | 0.193753 | -1.2687 | 0.210947 | 0.105474 |
| M4 | -0.252304000661949 | 0.193881 | -1.3013 | 0.199624 | 0.099812 |
| M5 | -0.195044578213561 | 0.193296 | -1.009 | 0.31823 | 0.159115 |
| M6 | -0.176040089363286 | 0.193169 | -0.9113 | 0.366875 | 0.183437 |
| M7 | -0.200525733316784 | 0.192673 | -1.0408 | 0.303429 | 0.151714 |
| M8 | -0.176017955401100 | 0.192584 | -0.914 | 0.365494 | 0.182747 |
| M9 | -0.149765111083529 | 0.192452 | -0.7782 | 0.440438 | 0.220219 |
| M10 | -0.0635122667659586 | 0.192396 | -0.3301 | 0.742814 | 0.371407 |
| M11 | -0.0300110669810927 | 0.192491 | -0.1559 | 0.876787 | 0.438393 |
| t | -0.024507777915684 | 0.004069 | -6.0225 | 0 | 0 |
| Multiple Linear Regression - Regression Statistics | |
| Multiple R | 0.919685918816145 |
| R-squared | 0.845822189268697 |
| Adjusted R-squared | 0.802250199279415 |
| F-TEST (value) | 19.4120624161707 |
| F-TEST (DF numerator) | 13 |
| F-TEST (DF denominator) | 46 |
| p-value | 1.93178806284777e-14 |
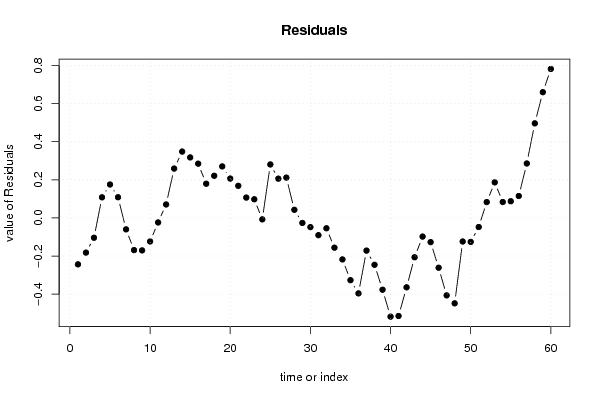
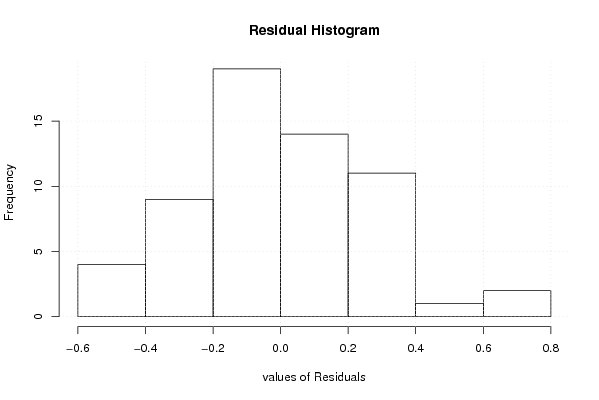
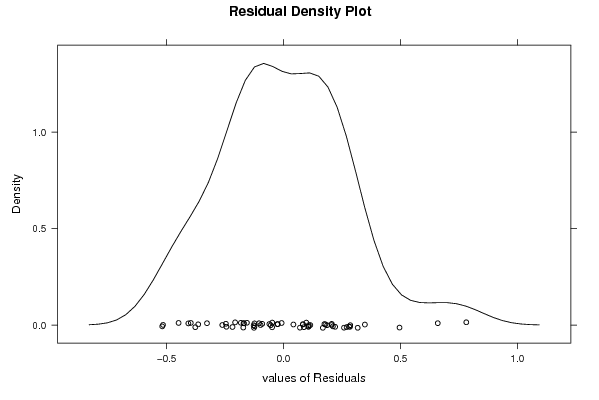
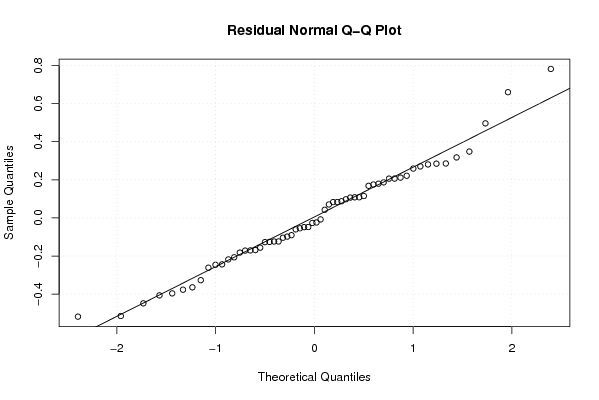
| Multiple Linear Regression - Residual Statistics | |
| Residual Standard Deviation | 0.30409309579165 |
| Sum Squared Residuals | 4.25374010177488 |
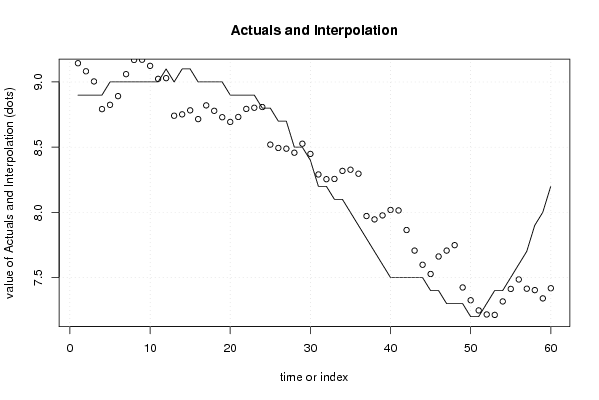
| Multiple Linear Regression - Actuals, Interpolation, and Residuals | |||
| Time or Index | Actuals | Interpolation Forecast | Residuals Prediction Error |
| 1 | 8.9 | 9.14389226759343 | -0.243892267593432 |
| 2 | 8.9 | 9.0821472011915 | -0.182147201191508 |
| 3 | 8.9 | 9.00416035745315 | -0.104160357453144 |
| 4 | 8.9 | 8.79194489263994 | 0.108055107360063 |
| 5 | 9 | 8.82469653717264 | 0.175303462827358 |
| 6 | 9 | 8.89167680278019 | 0.108323197219811 |
| 7 | 9 | 9.06013404492987 | -0.0601340449298727 |
| 8 | 9 | 9.1688593769393 | -0.168859376939306 |
| 9 | 9 | 9.1706044433412 | -0.170604443341193 |
| 10 | 9 | 9.12362417773365 | -0.123624177733646 |
| 11 | 9 | 9.0238922675934 | -0.0238922675933955 |
| 12 | 9.1 | 9.0293955566588 | 0.0706044433411955 |
| 13 | 9 | 8.74107360059575 | 0.258926399404254 |
| 14 | 9.1 | 8.75181208886682 | 0.348187911133177 |
| 15 | 9.1 | 8.7825505771379 | 0.317449422862108 |
| 16 | 9 | 8.7153022216706 | 0.284697778329403 |
| 17 | 9 | 8.82053742087626 | 0.179462579123744 |
| 18 | 9 | 8.77879235447437 | 0.22120764552563 |
| 19 | 9 | 8.72979893260519 | 0.270201067394813 |
| 20 | 8.9 | 8.69355715526871 | 0.206442844731291 |
| 21 | 8.9 | 8.73154399900707 | 0.168456000992926 |
| 22 | 8.9 | 8.79328906540896 | 0.106710934591039 |
| 23 | 8.9 | 8.80228248727814 | 0.0977175127218574 |
| 24 | 8.8 | 8.80778577634355 | -0.00778577634355094 |
| 25 | 8.8 | 8.5194638202805 | 0.280536179719508 |
| 26 | 8.7 | 8.4939605312151 | 0.206039468784906 |
| 27 | 8.7 | 8.48845724214968 | 0.211542757850315 |
| 28 | 8.5 | 8.45745066401887 | 0.0425493359811334 |
| 29 | 8.5 | 8.52644408588805 | -0.0264440858880486 |
| 30 | 8.4 | 8.44845724214968 | -0.0484572421496844 |
| 31 | 8.2 | 8.29073848827107 | -0.0907384882710694 |
| 32 | 8.2 | 8.2544967109346 | -0.0544967109345916 |
| 33 | 8.1 | 8.25624177733648 | -0.156241777336478 |
| 34 | 8.1 | 8.31798684373836 | -0.217986843738365 |
| 35 | 8 | 8.32698026560755 | -0.326980265607547 |
| 36 | 7.9 | 8.29624177733648 | -0.396241777336477 |
| 37 | 7.8 | 7.97167804393694 | -0.171678043936941 |
| 38 | 7.7 | 7.94617475487154 | -0.246174754871541 |
| 39 | 7.6 | 7.97691324314261 | -0.37691324314261 |
| 40 | 7.5 | 8.01839021968475 | -0.518390219684748 |
| 41 | 7.5 | 8.01490008688097 | -0.514900086880975 |
| 42 | 7.5 | 7.86442968846965 | -0.364429688469655 |
| 43 | 7.5 | 7.70671093459104 | -0.206710934591039 |
| 44 | 7.5 | 7.5979856025816 | -0.0979856025816057 |
| 45 | 7.4 | 7.52724711431054 | -0.127247114310537 |
| 46 | 7.4 | 7.66147573538538 | -0.261475735385379 |
| 47 | 7.3 | 7.70671093459104 | -0.406710934591039 |
| 48 | 7.3 | 7.74845600099293 | -0.448456000992926 |
| 49 | 7.3 | 7.42389226759339 | -0.123892267593389 |
| 50 | 7.2 | 7.32590542385503 | -0.125905423855034 |
| 51 | 7.2 | 7.24791858011667 | -0.0479185801166692 |
| 52 | 7.3 | 7.21691200198585 | 0.0830879980141479 |
| 53 | 7.4 | 7.21342186918208 | 0.186578130817922 |
| 54 | 7.4 | 7.3166439121261 | 0.0833560878738974 |
| 55 | 7.5 | 7.41261759960283 | 0.0873824003971687 |
| 56 | 7.6 | 7.48510115427579 | 0.114898845724213 |
| 57 | 7.7 | 7.41436266600472 | 0.285637333995282 |
| 58 | 7.9 | 7.40362417773365 | 0.496375822266351 |
| 59 | 8 | 7.34013404492988 | 0.659865955070124 |
| 60 | 8.2 | 7.41812088866824 | 0.78187911133176 |
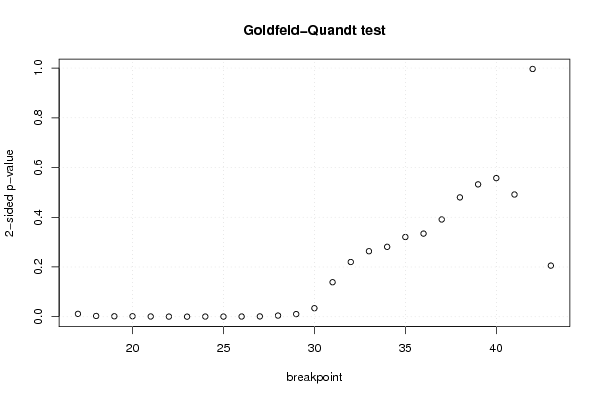
| Goldfeld-Quandt test for Heteroskedasticity | |||
| p-values | Alternative Hypothesis | ||
| breakpoint index | greater | 2-sided | less |
| 17 | 0.00565460448496671 | 0.0113092089699334 | 0.994345395515033 |
| 18 | 0.00145592059501245 | 0.00291184119002491 | 0.998544079404988 |
| 19 | 0.000833493231213192 | 0.00166698646242638 | 0.999166506768787 |
| 20 | 0.000976725365942209 | 0.00195345073188442 | 0.999023274634058 |
| 21 | 0.000440009225778258 | 0.000880018451556515 | 0.999559990774222 |
| 22 | 0.000185747453728755 | 0.000371494907457511 | 0.999814252546271 |
| 23 | 8.73473722526964e-05 | 0.000174694744505393 | 0.999912652627747 |
| 24 | 0.000282244111715783 | 0.000564488223431566 | 0.999717755888284 |
| 25 | 0.00018982728945381 | 0.00037965457890762 | 0.999810172710546 |
| 26 | 0.000357756886603298 | 0.000715513773206595 | 0.999642243113397 |
| 27 | 0.000585736337716173 | 0.00117147267543235 | 0.999414263662284 |
| 28 | 0.0022549326805241 | 0.0045098653610482 | 0.997745067319476 |
| 29 | 0.00523385313879767 | 0.0104677062775953 | 0.994766146861202 |
| 30 | 0.0170639590296748 | 0.0341279180593495 | 0.982936040970325 |
| 31 | 0.069330552562558 | 0.138661105125116 | 0.930669447437442 |
| 32 | 0.109968379496179 | 0.219936758992358 | 0.890031620503821 |
| 33 | 0.131691913266340 | 0.263383826532680 | 0.86830808673366 |
| 34 | 0.140534285982337 | 0.281068571964674 | 0.859465714017663 |
| 35 | 0.160277270778364 | 0.320554541556729 | 0.839722729221636 |
| 36 | 0.167107229679937 | 0.334214459359873 | 0.832892770320063 |
| 37 | 0.19554857406917 | 0.39109714813834 | 0.80445142593083 |
| 38 | 0.23994984950541 | 0.47989969901082 | 0.76005015049459 |
| 39 | 0.266112843511326 | 0.532225687022653 | 0.733887156488674 |
| 40 | 0.278705616048358 | 0.557411232096716 | 0.721294383951642 |
| 41 | 0.245722523997096 | 0.491445047994192 | 0.754277476002904 |
| 42 | 0.501761727022931 | 0.996476545954138 | 0.498238272977069 |
| 43 | 0.89729295927418 | 0.205414081451641 | 0.102707040725820 |
| Meta Analysis of Goldfeld-Quandt test for Heteroskedasticity | |||
| Description | # significant tests | % significant tests | OK/NOK |
| 1% type I error level | 11 | 0.407407407407407 | NOK |
| 5% type I error level | 14 | 0.518518518518518 | NOK |
| 10% type I error level | 14 | 0.518518518518518 | NOK |