| Multiple Linear Regression - Estimated Regression Equation |
| Y[t] = + 161.73125 + 3.70312500000001X[t] -3.91874999999995M1[t] -14.040625M2[t] -22.1625000000000M3[t] -24.4843750000000M4[t] -26.3468750000000M5[t] -28.66875M6[t] -32.790625M7[t] -34.9125000000001M8[t] -40.634375M9[t] -38.55625M10[t] -6.67812500000001M11[t] -0.678125t + e[t] |
| Multiple Linear Regression - Ordinary Least Squares | |||||
| Variable | Parameter | S.D. | T-STAT H0: parameter = 0 | 2-tail p-value | 1-tail p-value |
| (Intercept) | 161.73125 | 4.49667 | 35.9669 | 0 | 0 |
| X | 3.70312500000001 | 3.894231 | 0.9509 | 0.346612 | 0.173306 |
| M1 | -3.91874999999995 | 5.134656 | -0.7632 | 0.449243 | 0.224621 |
| M2 | -14.040625 | 5.124802 | -2.7397 | 0.008722 | 0.004361 |
| M3 | -22.1625000000000 | 5.117124 | -4.331 | 8e-05 | 4e-05 |
| M4 | -24.4843750000000 | 5.111633 | -4.7899 | 1.8e-05 | 9e-06 |
| M5 | -26.3468750000000 | 5.141215 | -5.1246 | 6e-06 | 3e-06 |
| M6 | -28.66875 | 5.126993 | -5.5917 | 1e-06 | 1e-06 |
| M7 | -32.790625 | 5.114928 | -6.4108 | 0 | 0 |
| M8 | -34.9125000000001 | 5.105036 | -6.8388 | 0 | 0 |
| M9 | -40.634375 | 5.097328 | -7.9717 | 0 | 0 |
| M10 | -38.55625 | 5.091816 | -7.5722 | 0 | 0 |
| M11 | -6.67812500000001 | 5.088506 | -1.3124 | 0.195898 | 0.097949 |
| t | -0.678125 | 0.105988 | -6.3982 | 0 | 0 |
| Multiple Linear Regression - Regression Statistics | |
| Multiple R | 0.922606451501705 |
| R-squared | 0.851202664352567 |
| Adjusted R-squared | 0.809151243408728 |
| F-TEST (value) | 20.2419477213234 |
| F-TEST (DF numerator) | 13 |
| F-TEST (DF denominator) | 46 |
| p-value | 8.77076189453874e-15 |
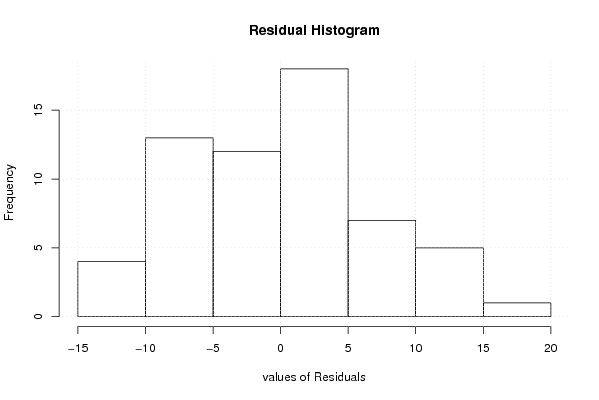
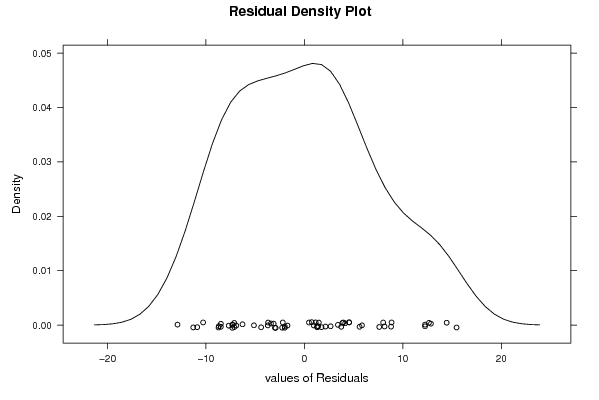
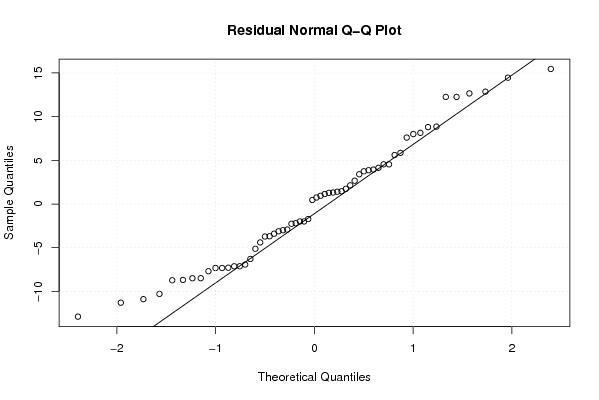
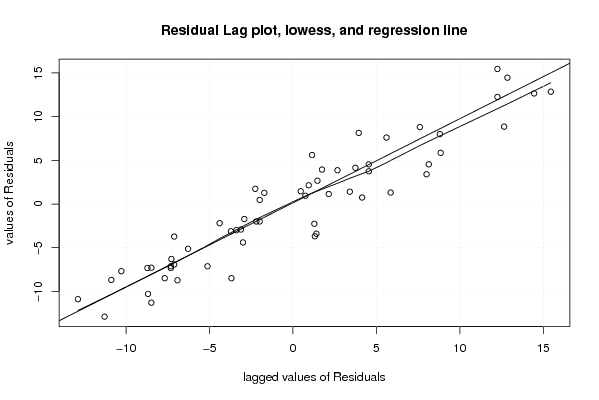
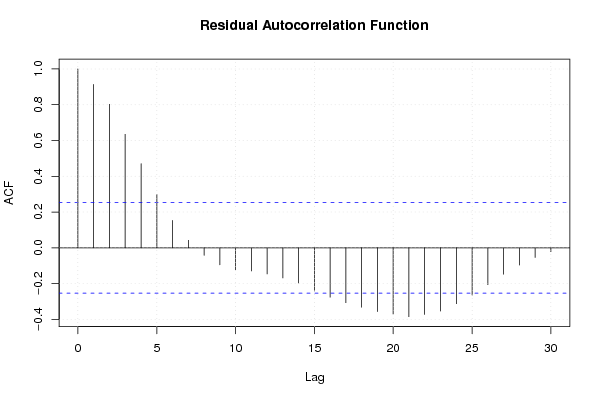
| Multiple Linear Regression - Residual Statistics | |
| Residual Standard Deviation | 8.0438886132106 |
| Sum Squared Residuals | 2976.390625 |
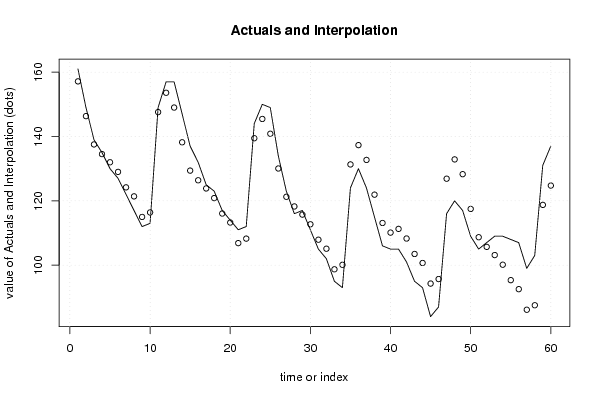
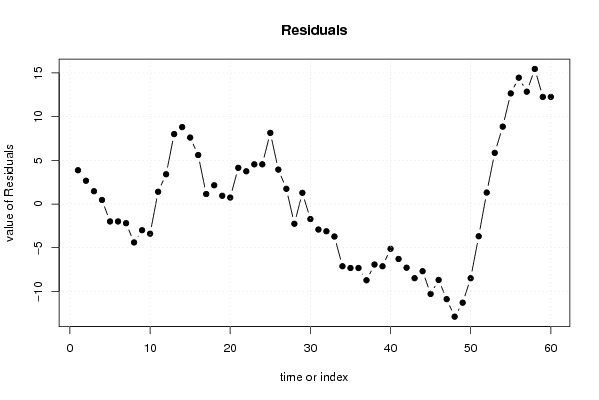
| Multiple Linear Regression - Actuals, Interpolation, and Residuals | |||
| Time or Index | Actuals | Interpolation Forecast | Residuals Prediction Error |
| 1 | 161 | 157.134375000000 | 3.86562500000017 |
| 2 | 149 | 146.334375 | 2.665625 |
| 3 | 139 | 137.534375 | 1.46562499999998 |
| 4 | 135 | 134.534375 | 0.465624999999968 |
| 5 | 130 | 131.99375 | -1.99374999999998 |
| 6 | 127 | 128.99375 | -1.99374999999997 |
| 7 | 122 | 124.19375 | -2.19375000000008 |
| 8 | 117 | 121.39375 | -4.39375000000006 |
| 9 | 112 | 114.99375 | -2.99375000000002 |
| 10 | 113 | 116.39375 | -3.39374999999994 |
| 11 | 149 | 147.59375 | 1.40624999999998 |
| 12 | 157 | 153.59375 | 3.40625000000001 |
| 13 | 157 | 148.996875 | 8.00312499999996 |
| 14 | 147 | 138.196875 | 8.803125 |
| 15 | 137 | 129.396875 | 7.603125 |
| 16 | 132 | 126.396875 | 5.603125 |
| 17 | 125 | 123.85625 | 1.14374999999999 |
| 18 | 123 | 120.85625 | 2.14374999999999 |
| 19 | 117 | 116.05625 | 0.94375000000002 |
| 20 | 114 | 113.25625 | 0.743750000000013 |
| 21 | 111 | 106.85625 | 4.14375000000001 |
| 22 | 112 | 108.25625 | 3.74374999999999 |
| 23 | 144 | 139.45625 | 4.54375 |
| 24 | 150 | 145.45625 | 4.54374999999999 |
| 25 | 149 | 140.859375 | 8.14062499999996 |
| 26 | 134 | 130.059375 | 3.940625 |
| 27 | 123 | 121.259375 | 1.74062500000001 |
| 28 | 116 | 118.259375 | -2.25937499999999 |
| 29 | 117 | 115.71875 | 1.28124999999999 |
| 30 | 111 | 112.71875 | -1.71875000000000 |
| 31 | 105 | 107.91875 | -2.91874999999997 |
| 32 | 102 | 105.11875 | -3.11874999999999 |
| 33 | 95 | 98.71875 | -3.71874999999999 |
| 34 | 93 | 100.11875 | -7.11875 |
| 35 | 124 | 131.31875 | -7.31874999999998 |
| 36 | 130 | 137.31875 | -7.31875 |
| 37 | 124 | 132.721875 | -8.72187500000004 |
| 38 | 115 | 121.921875 | -6.921875 |
| 39 | 106 | 113.121875 | -7.12187499999998 |
| 40 | 105 | 110.121875 | -5.12187499999999 |
| 41 | 105 | 111.284375 | -6.28437500000001 |
| 42 | 101 | 108.284375 | -7.28437500000001 |
| 43 | 95 | 103.484375 | -8.48437499999998 |
| 44 | 93 | 100.684375 | -7.68437499999999 |
| 45 | 84 | 94.284375 | -10.284375 |
| 46 | 87 | 95.684375 | -8.68437500000002 |
| 47 | 116 | 126.884375 | -10.884375 |
| 48 | 120 | 132.884375 | -12.884375 |
| 49 | 117 | 128.2875 | -11.2875000000000 |
| 50 | 109 | 117.4875 | -8.4875 |
| 51 | 105 | 108.6875 | -3.68749999999999 |
| 52 | 107 | 105.6875 | 1.31250000000001 |
| 53 | 109 | 103.146875 | 5.853125 |
| 54 | 109 | 100.146875 | 8.853125 |
| 55 | 108 | 95.346875 | 12.6531250000000 |
| 56 | 107 | 92.546875 | 14.4531250000000 |
| 57 | 99 | 86.146875 | 12.853125 |
| 58 | 103 | 87.546875 | 15.4531250000000 |
| 59 | 131 | 118.746875 | 12.253125 |
| 60 | 137 | 124.746875 | 12.253125 |
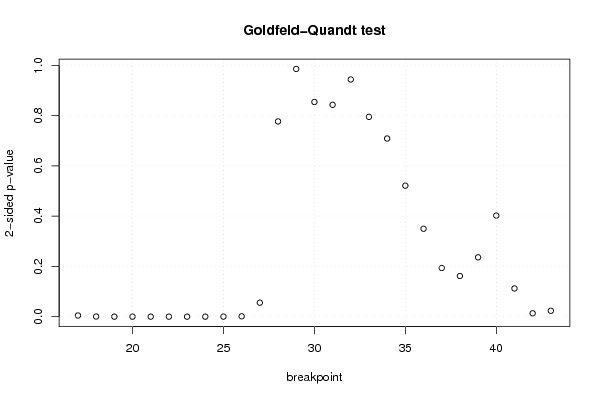
| Goldfeld-Quandt test for Heteroskedasticity | |||
| p-values | Alternative Hypothesis | ||
| breakpoint index | greater | 2-sided | less |
| 17 | 0.00235999754142147 | 0.00471999508284294 | 0.997640002458579 |
| 18 | 0.000264928712250751 | 0.000529857424501501 | 0.99973507128775 |
| 19 | 4.75498500139823e-05 | 9.50997000279646e-05 | 0.999952450149986 |
| 20 | 4.8299956388852e-06 | 9.6599912777704e-06 | 0.999995170004361 |
| 21 | 2.14177406416343e-06 | 4.28354812832686e-06 | 0.999997858225936 |
| 22 | 6.71133508482571e-07 | 1.34226701696514e-06 | 0.999999328866491 |
| 23 | 2.16464806705663e-07 | 4.32929613411326e-07 | 0.999999783535193 |
| 24 | 4.19736007423164e-07 | 8.39472014846329e-07 | 0.999999580263993 |
| 25 | 6.41118728715735e-06 | 1.28223745743147e-05 | 0.999993588812713 |
| 26 | 0.000702097625081705 | 0.00140419525016341 | 0.999297902374918 |
| 27 | 0.0277905704973603 | 0.0555811409947205 | 0.97220942950264 |
| 28 | 0.388348184478839 | 0.776696368957677 | 0.611651815521161 |
| 29 | 0.507273360250059 | 0.985453279499881 | 0.492726639749941 |
| 30 | 0.572916305231527 | 0.854167389536945 | 0.427083694768473 |
| 31 | 0.5786358838364 | 0.8427282323272 | 0.4213641161636 |
| 32 | 0.528154763712839 | 0.943690472574321 | 0.471845236287161 |
| 33 | 0.602587769205207 | 0.794824461589586 | 0.397412230794793 |
| 34 | 0.645631234640811 | 0.708737530718378 | 0.354368765359189 |
| 35 | 0.739445575522662 | 0.521108848954676 | 0.260554424477338 |
| 36 | 0.825087619153324 | 0.349824761693353 | 0.174912380846677 |
| 37 | 0.90319656551168 | 0.193606868976642 | 0.0968034344883208 |
| 38 | 0.919179513812177 | 0.161640972375647 | 0.0808204861878233 |
| 39 | 0.881976667666389 | 0.236046664667222 | 0.118023332333611 |
| 40 | 0.798943426061765 | 0.40211314787647 | 0.201056573938235 |
| 41 | 0.943909276186814 | 0.112181447626371 | 0.0560907238131857 |
| 42 | 0.993296251828141 | 0.0134074963437176 | 0.00670374817185878 |
| 43 | 0.988308432792182 | 0.0233831344156364 | 0.0116915672078182 |
| Meta Analysis of Goldfeld-Quandt test for Heteroskedasticity | |||
| Description | # significant tests | % significant tests | OK/NOK |
| 1% type I error level | 10 | 0.370370370370370 | NOK |
| 5% type I error level | 12 | 0.444444444444444 | NOK |
| 10% type I error level | 13 | 0.481481481481481 | NOK |