| Multiple Linear Regression - Estimated Regression Equation |
| Y[t] = + 13.0765375758616 -0.0275289865833972X[t] + 0.115053294379473M1[t] + 0.127692998894482M2[t] -0.212602095341469M3[t] -0.248532123979495M4[t] -0.235294617590926M5[t] -0.206229856388522M6[t] -0.326883209944381M7[t] -0.301619743856429M8[t] -0.708740496787767M9[t] -0.661148345120413M10[t] + 0.455677295332566M11[t] -0.0430083841540564t + e[t] |
| Multiple Linear Regression - Ordinary Least Squares | |||||
| Variable | Parameter | S.D. | T-STAT H0: parameter = 0 | 2-tail p-value | 1-tail p-value |
| (Intercept) | 13.0765375758616 | 1.018147 | 12.8435 | 0 | 0 |
| X | -0.0275289865833972 | 0.011268 | -2.4431 | 0.018461 | 0.00923 |
| M1 | 0.115053294379473 | 0.345397 | 0.3331 | 0.740569 | 0.370285 |
| M2 | 0.127692998894482 | 0.43852 | 0.2912 | 0.772215 | 0.386107 |
| M3 | -0.212602095341469 | 0.437244 | -0.4862 | 0.629111 | 0.314555 |
| M4 | -0.248532123979495 | 0.390101 | -0.6371 | 0.52722 | 0.26361 |
| M5 | -0.235294617590926 | 0.346709 | -0.6787 | 0.500758 | 0.250379 |
| M6 | -0.206229856388522 | 0.347442 | -0.5936 | 0.555709 | 0.277855 |
| M7 | -0.326883209944381 | 0.353633 | -0.9244 | 0.360124 | 0.180062 |
| M8 | -0.301619743856429 | 0.407789 | -0.7396 | 0.463272 | 0.231636 |
| M9 | -0.708740496787767 | 0.367501 | -1.9285 | 0.059973 | 0.029986 |
| M10 | -0.661148345120413 | 0.364181 | -1.8154 | 0.075979 | 0.037989 |
| M11 | 0.455677295332566 | 0.425685 | 1.0705 | 0.289998 | 0.144999 |
| t | -0.0430083841540564 | 0.003792 | -11.3417 | 0 | 0 |
| Multiple Linear Regression - Regression Statistics | |
| Multiple R | 0.886512797926374 |
| R-squared | 0.785904940887249 |
| Adjusted R-squared | 0.725399815485819 |
| F-TEST (value) | 12.9890639127355 |
| F-TEST (DF numerator) | 13 |
| F-TEST (DF denominator) | 46 |
| p-value | 2.49942289087812e-11 |
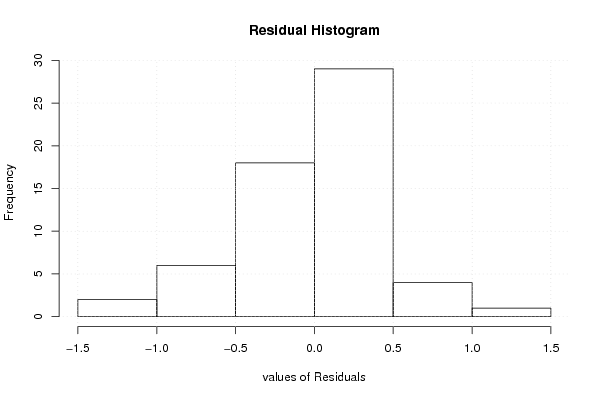
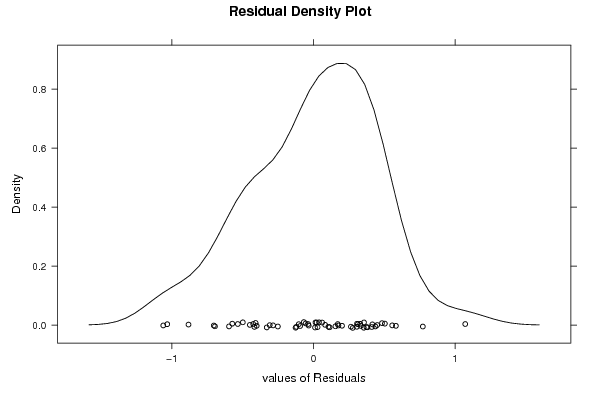
| Multiple Linear Regression - Residual Statistics | |
| Residual Standard Deviation | 0.49844092265694 |
| Sum Squared Residuals | 11.4283942554387 |
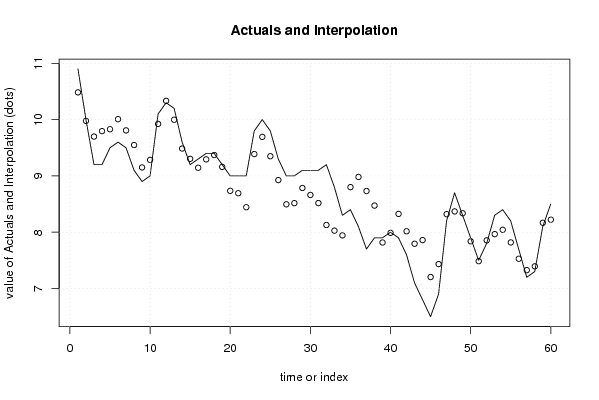
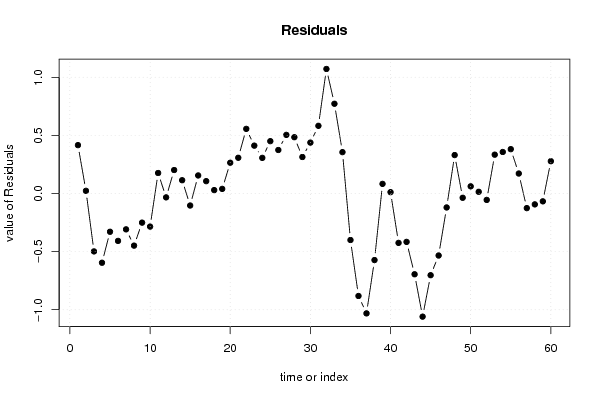
| Multiple Linear Regression - Actuals, Interpolation, and Residuals | |||
| Time or Index | Actuals | Interpolation Forecast | Residuals Prediction Error |
| 1 | 10.9 | 10.4837765848142 | 0.416223415185806 |
| 2 | 10 | 9.97715643728237 | 0.0228435627176335 |
| 3 | 9.2 | 9.69846310790927 | -0.498463107909269 |
| 4 | 9.2 | 9.79571020925093 | -0.595710209250928 |
| 5 | 9.5 | 9.82925600062725 | -0.329256000627255 |
| 6 | 9.6 | 10.0080152837594 | -0.408015283759383 |
| 7 | 9.5 | 9.80856586349105 | -0.30856586349105 |
| 8 | 9.1 | 9.54856586349105 | -0.44856586349105 |
| 9 | 8.9 | 9.15074180091411 | -0.250741800914110 |
| 10 | 9 | 9.28471180536937 | -0.284711805369375 |
| 11 | 10.1 | 9.92357107365062 | 0.176428926349378 |
| 12 | 10.3 | 10.3333419514161 | -0.0333419514161077 |
| 13 | 10.2 | 9.99795786020725 | 0.202042139792754 |
| 14 | 9.6 | 9.48583191535875 | 0.114168084641254 |
| 15 | 9.2 | 9.30349003902754 | -0.103490039027539 |
| 16 | 9.3 | 9.1447175651436 | 0.155282434856397 |
| 17 | 9.4 | 9.2938851001702 | 0.106114899829801 |
| 18 | 9.4 | 9.37078713294376 | 0.0292128670562426 |
| 19 | 9.2 | 9.16032611804207 | 0.0396738819579330 |
| 20 | 9 | 8.73515219854168 | 0.264847801458317 |
| 21 | 9 | 8.69245206289057 | 0.307547937109433 |
| 22 | 9 | 8.44376915383661 | 0.55623084616339 |
| 23 | 9.8 | 9.38820017319357 | 0.411799826806435 |
| 24 | 10 | 9.69336090194214 | 0.306639098057856 |
| 25 | 9.8 | 9.34971811475826 | 0.450281885241739 |
| 26 | 9.3 | 8.92568492697663 | 0.374315073023367 |
| 27 | 9 | 8.49558217139485 | 0.50441782860515 |
| 28 | 9 | 8.515748110303 | 0.484251889697002 |
| 29 | 9.1 | 8.78604318629654 | 0.313956813703458 |
| 30 | 9.1 | 8.6619836170113 | 0.4380163829887 |
| 31 | 9.1 | 8.51759216990976 | 0.582407830090238 |
| 32 | 9.2 | 8.1282059329678 | 1.07179406703220 |
| 33 | 8.8 | 8.02769492549155 | 0.772305074508455 |
| 34 | 8.3 | 7.94418593593797 | 0.355814064062029 |
| 35 | 8.4 | 8.80052419822806 | -0.400524198228056 |
| 36 | 8.1 | 8.98180448735135 | -0.881804487351346 |
| 37 | 7.7 | 8.73176025455101 | -1.03176025455101 |
| 38 | 7.9 | 8.47290098626977 | -0.57290098626977 |
| 39 | 7.9 | 7.81706054070413 | 0.082939459295871 |
| 40 | 8 | 7.98863590582096 | 0.0113640941790377 |
| 41 | 7.9 | 8.32500054961466 | -0.425000549614658 |
| 42 | 7.6 | 8.01649677022066 | -0.416496770220656 |
| 43 | 7.1 | 7.7950241606856 | -0.695024160685606 |
| 44 | 6.8 | 7.85986620236969 | -1.05986620236969 |
| 45 | 6.5 | 7.20326966590882 | -0.70326966590882 |
| 46 | 6.9 | 7.43359112340597 | -0.533591123405974 |
| 47 | 8.2 | 8.3202112709378 | -0.120211270937795 |
| 48 | 8.7 | 8.36935242446078 | 0.330647575539221 |
| 49 | 8.3 | 8.33678718566929 | -0.0367871856692847 |
| 50 | 7.9 | 7.83842573411248 | 0.0615742658875157 |
| 51 | 7.5 | 7.48540414096421 | 0.0145958590357862 |
| 52 | 7.8 | 7.8551882094815 | -0.0551882094815067 |
| 53 | 8.3 | 7.96581516329135 | 0.334184836708655 |
| 54 | 8.4 | 8.0427171960649 | 0.357282803935096 |
| 55 | 8.2 | 7.81849168787151 | 0.381508312128485 |
| 56 | 7.7 | 7.52820980262978 | 0.171790197370222 |
| 57 | 7.2 | 7.32584154479496 | -0.125841544794958 |
| 58 | 7.3 | 7.39374198145007 | -0.0937419814500695 |
| 59 | 8.1 | 8.16749328398996 | -0.0674932839899622 |
| 60 | 8.5 | 8.22214023482963 | 0.277859765170375 |
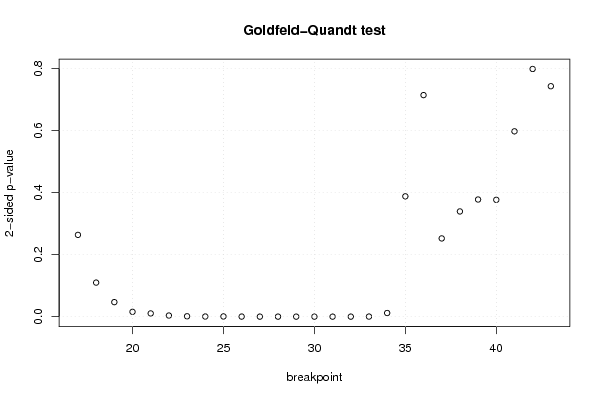
| Goldfeld-Quandt test for Heteroskedasticity | |||
| p-values | Alternative Hypothesis | ||
| breakpoint index | greater | 2-sided | less |
| 17 | 0.131821620429921 | 0.263643240859841 | 0.868178379570079 |
| 18 | 0.0548989592604984 | 0.109797918520997 | 0.945101040739502 |
| 19 | 0.0234169157104874 | 0.0468338314209748 | 0.976583084289513 |
| 20 | 0.00778036287872543 | 0.0155607257574509 | 0.992219637121275 |
| 21 | 0.00520277760397223 | 0.0104055552079445 | 0.994797222396028 |
| 22 | 0.00180822041859268 | 0.00361644083718537 | 0.998191779581407 |
| 23 | 0.00059630766252669 | 0.00119261532505338 | 0.999403692337473 |
| 24 | 0.000206521653317427 | 0.000413043306634853 | 0.999793478346683 |
| 25 | 0.000345960517228180 | 0.000691921034456359 | 0.999654039482772 |
| 26 | 0.000115956139604839 | 0.000231912279209678 | 0.999884043860395 |
| 27 | 3.83293123885556e-05 | 7.66586247771113e-05 | 0.999961670687611 |
| 28 | 1.21134342252718e-05 | 2.42268684505436e-05 | 0.999987886565775 |
| 29 | 3.34858185479907e-06 | 6.69716370959814e-06 | 0.999996651418145 |
| 30 | 1.01384278104190e-06 | 2.02768556208381e-06 | 0.99999898615722 |
| 31 | 3.44329216142565e-07 | 6.88658432285131e-07 | 0.999999655670784 |
| 32 | 1.18912711119798e-05 | 2.37825422239597e-05 | 0.999988108728888 |
| 33 | 0.000113180031414471 | 0.000226360062828942 | 0.999886819968586 |
| 34 | 0.00589311520670311 | 0.0117862304134062 | 0.994106884793297 |
| 35 | 0.194023999763752 | 0.388047999527504 | 0.805976000236248 |
| 36 | 0.642749262764452 | 0.714501474471097 | 0.357250737235548 |
| 37 | 0.87384945369573 | 0.25230109260854 | 0.12615054630427 |
| 38 | 0.83033091492909 | 0.339338170141818 | 0.169669085070909 |
| 39 | 0.811103773713688 | 0.377792452572624 | 0.188896226286312 |
| 40 | 0.811628431480496 | 0.376743137039008 | 0.188371568519504 |
| 41 | 0.70114855803153 | 0.59770288393694 | 0.29885144196847 |
| 42 | 0.600576267747825 | 0.79884746450435 | 0.399423732252175 |
| 43 | 0.628431086712463 | 0.743137826575074 | 0.371568913287537 |
| Meta Analysis of Goldfeld-Quandt test for Heteroskedasticity | |||
| Description | # significant tests | % significant tests | OK/NOK |
| 1% type I error level | 12 | 0.444444444444444 | NOK |
| 5% type I error level | 16 | 0.592592592592593 | NOK |
| 10% type I error level | 16 | 0.592592592592593 | NOK |