| Multiple Linear Regression - Estimated Regression Equation |
| Y[t] = + 8.14375 -1.13541666666667X[t] + e[t] |
| Multiple Linear Regression - Ordinary Least Squares | |||||
| Variable | Parameter | S.D. | T-STAT H0: parameter = 0 | 2-tail p-value | 1-tail p-value |
| (Intercept) | 8.14375 | 0.068563 | 118.7775 | 0 | 0 |
| X | -1.13541666666667 | 0.153312 | -7.4059 | 0 | 0 |
| Multiple Linear Regression - Regression Statistics | |
| Multiple R | 0.697161272237485 |
| R-squared | 0.486033839507789 |
| Adjusted R-squared | 0.477172353982061 |
| F-TEST (value) | 54.8478963370955 |
| F-TEST (DF numerator) | 1 |
| F-TEST (DF denominator) | 58 |
| p-value | 6.0921212519105e-10 |
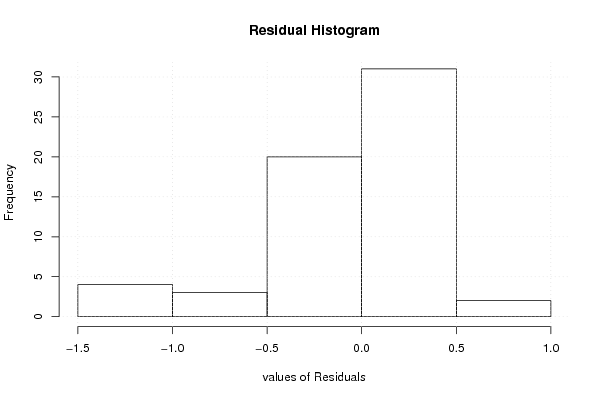
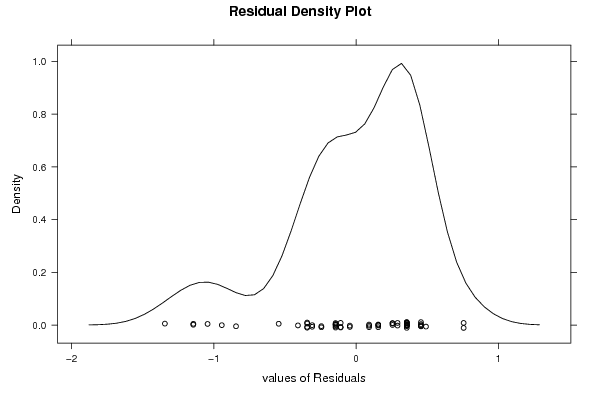
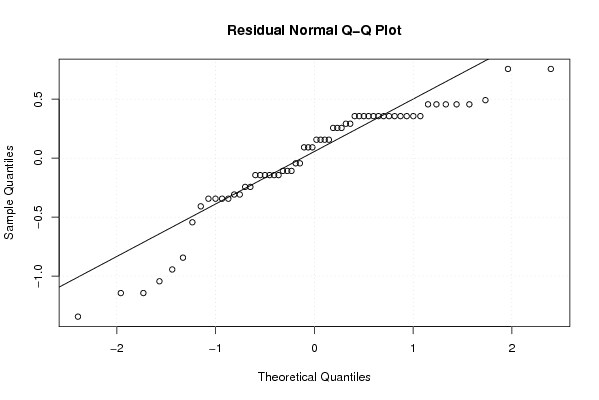
| Multiple Linear Regression - Residual Statistics | |
| Residual Standard Deviation | 0.475018904644978 |
| Sum Squared Residuals | 13.0872916666667 |
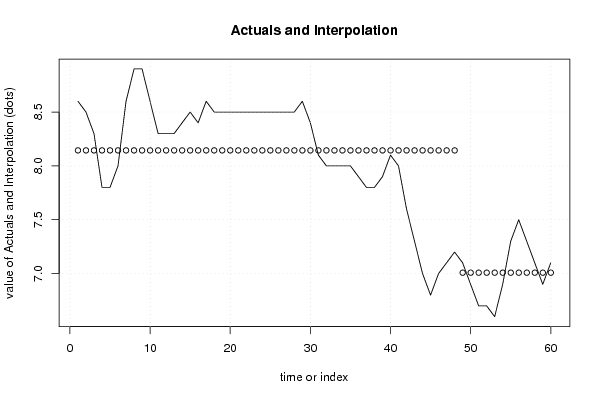
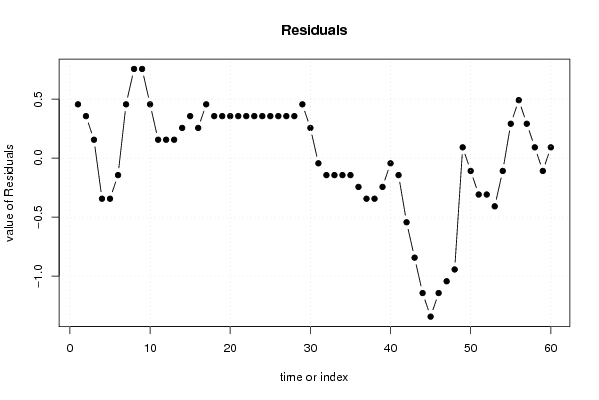
| Multiple Linear Regression - Actuals, Interpolation, and Residuals | |||
| Time or Index | Actuals | Interpolation Forecast | Residuals Prediction Error |
| 1 | 8.6 | 8.14375000000002 | 0.456249999999984 |
| 2 | 8.5 | 8.14375 | 0.356250000000003 |
| 3 | 8.3 | 8.14375 | 0.156250000000001 |
| 4 | 7.8 | 8.14375 | -0.34375 |
| 5 | 7.8 | 8.14375 | -0.34375 |
| 6 | 8 | 8.14375 | -0.143750000000000 |
| 7 | 8.6 | 8.14375 | 0.45625 |
| 8 | 8.9 | 8.14375 | 0.75625 |
| 9 | 8.9 | 8.14375 | 0.75625 |
| 10 | 8.6 | 8.14375 | 0.45625 |
| 11 | 8.3 | 8.14375 | 0.156250000000001 |
| 12 | 8.3 | 8.14375 | 0.156250000000001 |
| 13 | 8.3 | 8.14375 | 0.156250000000001 |
| 14 | 8.4 | 8.14375 | 0.256250000000001 |
| 15 | 8.5 | 8.14375 | 0.35625 |
| 16 | 8.4 | 8.14375 | 0.256250000000001 |
| 17 | 8.6 | 8.14375 | 0.45625 |
| 18 | 8.5 | 8.14375 | 0.35625 |
| 19 | 8.5 | 8.14375 | 0.35625 |
| 20 | 8.5 | 8.14375 | 0.35625 |
| 21 | 8.5 | 8.14375 | 0.35625 |
| 22 | 8.5 | 8.14375 | 0.35625 |
| 23 | 8.5 | 8.14375 | 0.35625 |
| 24 | 8.5 | 8.14375 | 0.35625 |
| 25 | 8.5 | 8.14375 | 0.35625 |
| 26 | 8.5 | 8.14375 | 0.35625 |
| 27 | 8.5 | 8.14375 | 0.35625 |
| 28 | 8.5 | 8.14375 | 0.35625 |
| 29 | 8.6 | 8.14375 | 0.45625 |
| 30 | 8.4 | 8.14375 | 0.256250000000001 |
| 31 | 8.1 | 8.14375 | -0.0437500000000001 |
| 32 | 8 | 8.14375 | -0.143750000000000 |
| 33 | 8 | 8.14375 | -0.143750000000000 |
| 34 | 8 | 8.14375 | -0.143750000000000 |
| 35 | 8 | 8.14375 | -0.143750000000000 |
| 36 | 7.9 | 8.14375 | -0.243749999999999 |
| 37 | 7.8 | 8.14375 | -0.34375 |
| 38 | 7.8 | 8.14375 | -0.34375 |
| 39 | 7.9 | 8.14375 | -0.243749999999999 |
| 40 | 8.1 | 8.14375 | -0.0437500000000001 |
| 41 | 8 | 8.14375 | -0.143750000000000 |
| 42 | 7.6 | 8.14375 | -0.54375 |
| 43 | 7.3 | 8.14375 | -0.84375 |
| 44 | 7 | 8.14375 | -1.14375 |
| 45 | 6.8 | 8.14375 | -1.34375 |
| 46 | 7 | 8.14375 | -1.14375 |
| 47 | 7.1 | 8.14375 | -1.04375 |
| 48 | 7.2 | 8.14375 | -0.94375 |
| 49 | 7.1 | 7.00833333333333 | 0.0916666666666664 |
| 50 | 6.9 | 7.00833333333333 | -0.108333333333333 |
| 51 | 6.7 | 7.00833333333333 | -0.308333333333333 |
| 52 | 6.7 | 7.00833333333333 | -0.308333333333333 |
| 53 | 6.6 | 7.00833333333333 | -0.408333333333334 |
| 54 | 6.9 | 7.00833333333333 | -0.108333333333333 |
| 55 | 7.3 | 7.00833333333333 | 0.291666666666667 |
| 56 | 7.5 | 7.00833333333333 | 0.491666666666667 |
| 57 | 7.3 | 7.00833333333333 | 0.291666666666667 |
| 58 | 7.1 | 7.00833333333333 | 0.0916666666666664 |
| 59 | 6.9 | 7.00833333333333 | -0.108333333333333 |
| 60 | 7.1 | 7.00833333333333 | 0.0916666666666664 |
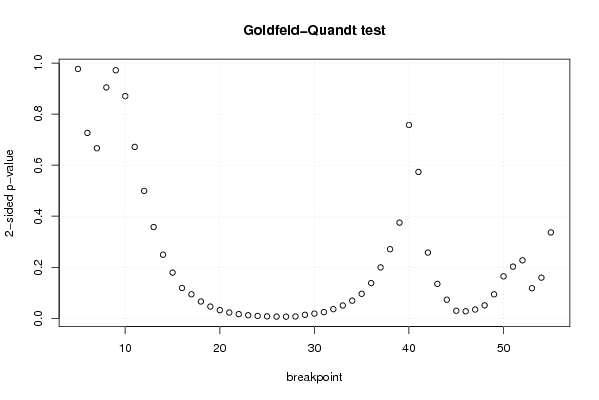
| Goldfeld-Quandt test for Heteroskedasticity | |||
| p-values | Alternative Hypothesis | ||
| breakpoint index | greater | 2-sided | less |
| 5 | 0.51160000178527 | 0.97679999642946 | 0.48839999821473 |
| 6 | 0.363224269999252 | 0.726448539998505 | 0.636775730000748 |
| 7 | 0.333151710557348 | 0.666303421114696 | 0.666848289442652 |
| 8 | 0.452247713156941 | 0.904495426313883 | 0.547752286843059 |
| 9 | 0.51415307872714 | 0.97169384254572 | 0.48584692127286 |
| 10 | 0.435193415959257 | 0.870386831918514 | 0.564806584040743 |
| 11 | 0.335806122238497 | 0.671612244476993 | 0.664193877761504 |
| 12 | 0.249591268221266 | 0.499182536442532 | 0.750408731778734 |
| 13 | 0.178858883745672 | 0.357717767491345 | 0.821141116254328 |
| 14 | 0.12469836067383 | 0.24939672134766 | 0.87530163932617 |
| 15 | 0.0895642760226075 | 0.179128552045215 | 0.910435723977392 |
| 16 | 0.0595570366010637 | 0.119114073202127 | 0.940442963398936 |
| 17 | 0.0472257754246319 | 0.0944515508492638 | 0.952774224575368 |
| 18 | 0.0330415809180044 | 0.0660831618360087 | 0.966958419081996 |
| 19 | 0.0230863298592111 | 0.0461726597184222 | 0.976913670140789 |
| 20 | 0.0162014827860769 | 0.0324029655721538 | 0.983798517213923 |
| 21 | 0.0114970995069190 | 0.0229941990138379 | 0.988502900493081 |
| 22 | 0.00831654652751608 | 0.0166330930550322 | 0.991683453472484 |
| 23 | 0.00619207567012026 | 0.0123841513402405 | 0.99380792432988 |
| 24 | 0.00480229504966894 | 0.00960459009933788 | 0.995197704950331 |
| 25 | 0.00393777937997768 | 0.00787555875995535 | 0.996062220620022 |
| 26 | 0.00347909825566418 | 0.00695819651132836 | 0.996520901744336 |
| 27 | 0.00339418322373752 | 0.00678836644747505 | 0.996605816776262 |
| 28 | 0.00377643531336636 | 0.00755287062673273 | 0.996223564686634 |
| 29 | 0.00700452904333759 | 0.0140090580866752 | 0.992995470956662 |
| 30 | 0.00936664952961359 | 0.0187332990592272 | 0.990633350470386 |
| 31 | 0.0123329038441341 | 0.0246658076882681 | 0.987667096155866 |
| 32 | 0.0180526126725443 | 0.0361052253450886 | 0.981947387327456 |
| 33 | 0.0252210580364163 | 0.0504421160728326 | 0.974778941963584 |
| 34 | 0.0346595376745959 | 0.0693190753491918 | 0.965340462325404 |
| 35 | 0.0481197654646686 | 0.0962395309293373 | 0.951880234535331 |
| 36 | 0.0690620583392573 | 0.138124116678515 | 0.930937941660743 |
| 37 | 0.0998031317827769 | 0.199606263565554 | 0.900196868217223 |
| 38 | 0.135438517292546 | 0.270877034585093 | 0.864561482707454 |
| 39 | 0.187441836780236 | 0.374883673560473 | 0.812558163219764 |
| 40 | 0.378628353483253 | 0.757256706966506 | 0.621371646516747 |
| 41 | 0.713247590918721 | 0.573504818162558 | 0.286752409081279 |
| 42 | 0.871122367205516 | 0.257755265588969 | 0.128877632794485 |
| 43 | 0.93238730314995 | 0.135225393700100 | 0.0676126968500502 |
| 44 | 0.963438813248428 | 0.0731223735031431 | 0.0365611867515716 |
| 45 | 0.985024126533375 | 0.0299517469332498 | 0.0149758734666249 |
| 46 | 0.986110327046495 | 0.0277793459070089 | 0.0138896729535044 |
| 47 | 0.982706947925111 | 0.0345861041497785 | 0.0172930520748892 |
| 48 | 0.974454319788982 | 0.0510913604220368 | 0.0255456802110184 |
| 49 | 0.952872703749508 | 0.0942545925009834 | 0.0471272962504917 |
| 50 | 0.91769303437152 | 0.164613931256959 | 0.0823069656284795 |
| 51 | 0.898691162019863 | 0.202617675960273 | 0.101308837980137 |
| 52 | 0.886310509019147 | 0.227378981961706 | 0.113689490980853 |
| 53 | 0.940886975597941 | 0.118226048804118 | 0.0591130244020589 |
| 54 | 0.920229629623733 | 0.159540740752534 | 0.079770370376267 |
| 55 | 0.831684607495008 | 0.336630785009983 | 0.168315392504992 |
| Meta Analysis of Goldfeld-Quandt test for Heteroskedasticity | |||
| Description | # significant tests | % significant tests | OK/NOK |
| 1% type I error level | 5 | 0.0980392156862745 | NOK |
| 5% type I error level | 17 | 0.333333333333333 | NOK |
| 10% type I error level | 25 | 0.490196078431373 | NOK |