| Multiple Linear Regression - Estimated Regression Equation |
| I[t] = -25.1447875446987 + 0.730220332179792U[t] + 0.0643404999581819m1[t] + 0.194820257073925m2[t] + 0.170133757972612m3[t] + 0.046402945892129m4[t] -3.23374546523884M1[t] + 2.95184473503329M2[t] -10.5575350599474M3[t] -2.0182951502947M4[t] + 6.81571807814321M5[t] -1.63565124828532M6[t] -6.03568977932192M7[t] + 7.71868122050343M8[t] -24.0107549608620M9[t] -21.4349262435542M10[t] -1.73157334236155M11[t] -0.152079578124883t + e[t] |
| Multiple Linear Regression - Ordinary Least Squares | |||||
| Variable | Parameter | S.D. | T-STAT H0: parameter = 0 | 2-tail p-value | 1-tail p-value |
| (Intercept) | -25.1447875446987 | 10.733265 | -2.3427 | 0.024483 | 0.012241 |
| U | 0.730220332179792 | 0.078983 | 9.2453 | 0 | 0 |
| m1 | 0.0643404999581819 | 0.094311 | 0.6822 | 0.49924 | 0.24962 |
| m2 | 0.194820257073925 | 0.099556 | 1.9569 | 0.057736 | 0.028868 |
| m3 | 0.170133757972612 | 0.098832 | 1.7214 | 0.093303 | 0.046652 |
| m4 | 0.046402945892129 | 0.108066 | 0.4294 | 0.670062 | 0.335031 |
| M1 | -3.23374546523884 | 7.362942 | -0.4392 | 0.66301 | 0.331505 |
| M2 | 2.95184473503329 | 8.497245 | 0.3474 | 0.730216 | 0.365108 |
| M3 | -10.5575350599474 | 5.519921 | -1.9126 | 0.063355 | 0.031678 |
| M4 | -2.0182951502947 | 5.641557 | -0.3578 | 0.722506 | 0.361253 |
| M5 | 6.81571807814321 | 4.867396 | 1.4003 | 0.169542 | 0.084771 |
| M6 | -1.63565124828532 | 5.41332 | -0.3022 | 0.764183 | 0.382092 |
| M7 | -6.03568977932192 | 7.446678 | -0.8105 | 0.422688 | 0.211344 |
| M8 | 7.71868122050343 | 6.132789 | 1.2586 | 0.215855 | 0.107928 |
| M9 | -24.0107549608620 | 4.966142 | -4.8349 | 2.2e-05 | 1.1e-05 |
| M10 | -21.4349262435542 | 8.439853 | -2.5397 | 0.015306 | 0.007653 |
| M11 | -1.73157334236155 | 6.847911 | -0.2529 | 0.801738 | 0.400869 |
| t | -0.152079578124883 | 0.053864 | -2.8234 | 0.007524 | 0.003762 |
| Multiple Linear Regression - Regression Statistics | |
| Multiple R | 0.980509202308032 |
| R-squared | 0.961398295810733 |
| Adjusted R-squared | 0.94412911235764 |
| F-TEST (value) | 55.6713233385993 |
| F-TEST (DF numerator) | 17 |
| F-TEST (DF denominator) | 38 |
| p-value | 0 |
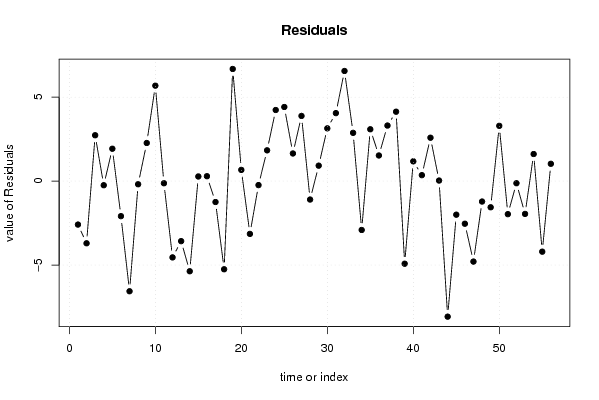
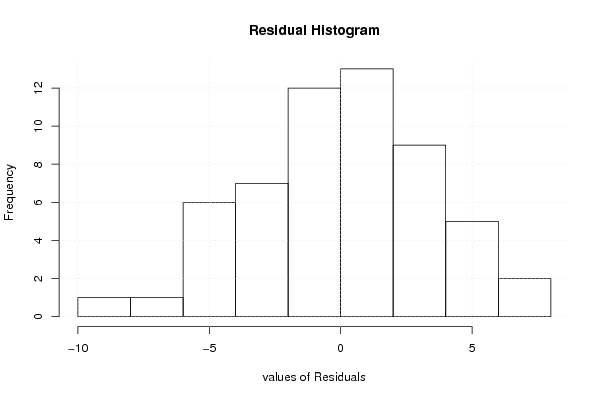
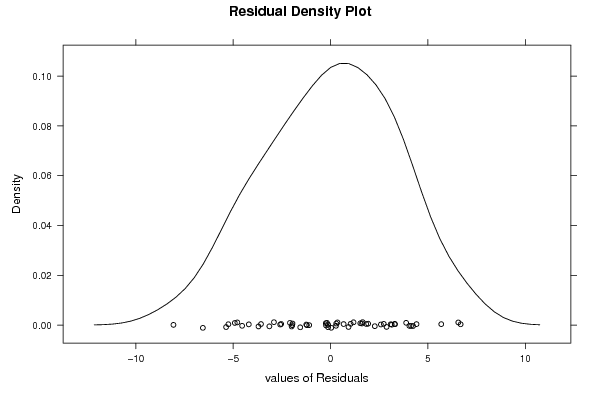
| Multiple Linear Regression - Residual Statistics | |
| Residual Standard Deviation | 4.05308389685655 |
| Sum Squared Residuals | 624.244584848399 |
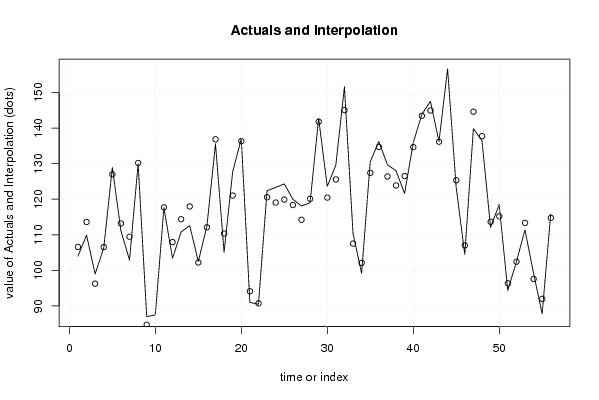
| Multiple Linear Regression - Actuals, Interpolation, and Residuals | |||
| Time or Index | Actuals | Interpolation Forecast | Residuals Prediction Error |
| 1 | 104 | 106.588023112507 | -2.5880231125075 |
| 2 | 109.9 | 113.603028556769 | -3.70302855676944 |
| 3 | 99 | 96.2695669431744 | 2.73043305682563 |
| 4 | 106.3 | 106.544783992429 | -0.244783992428747 |
| 5 | 128.9 | 126.971730070363 | 1.92826992963728 |
| 6 | 111.1 | 113.186829413931 | -2.08682941393122 |
| 7 | 102.9 | 109.459416296700 | -6.55941629670036 |
| 8 | 130 | 130.187172633729 | -0.187172633729466 |
| 9 | 87 | 84.7301410588982 | 2.26985894110176 |
| 10 | 87.5 | 81.8158096532213 | 5.68419034677873 |
| 11 | 117.6 | 117.727480971153 | -0.127480971152990 |
| 12 | 103.4 | 107.944087815115 | -4.54408781511537 |
| 13 | 110.8 | 114.374902298524 | -3.57490229852384 |
| 14 | 112.6 | 117.96821514953 | -5.3682151495301 |
| 15 | 102.5 | 102.223576894313 | 0.27642310568715 |
| 16 | 112.4 | 112.1092039611 | 0.290796038899986 |
| 17 | 135.6 | 136.846696542066 | -1.24669654206571 |
| 18 | 105.1 | 110.350404176411 | -5.25040417641103 |
| 19 | 127.7 | 121.021240041638 | 6.67875995836246 |
| 20 | 137 | 136.331141084775 | 0.668858915224647 |
| 21 | 91 | 94.1441208189833 | -3.14412081898335 |
| 22 | 90.5 | 90.7374223959174 | -0.237422395917378 |
| 23 | 122.4 | 120.567465540290 | 1.83253445970969 |
| 24 | 123.3 | 119.066017327653 | 4.23398267234656 |
| 25 | 124.3 | 119.886608814644 | 4.41339118535619 |
| 26 | 120 | 118.354177765364 | 1.64582223463643 |
| 27 | 118.1 | 114.218254883049 | 3.88174511695064 |
| 28 | 119 | 120.097506567961 | -1.09750656796095 |
| 29 | 142.7 | 141.780339734292 | 0.919660265707606 |
| 30 | 123.6 | 120.458219181249 | 3.14178081875114 |
| 31 | 129.6 | 125.551660817403 | 4.04833918259692 |
| 32 | 151.6 | 145.040914385862 | 6.55908561413800 |
| 33 | 110.4 | 107.525875247848 | 2.8741247521523 |
| 34 | 99.2 | 102.10964815419 | -2.90964815418991 |
| 35 | 130.5 | 127.413735403811 | 3.08626459618946 |
| 36 | 136.2 | 134.6733255033 | 1.5266744967 |
| 37 | 129.7 | 126.391639864646 | 3.30836013535443 |
| 38 | 128 | 123.866144938476 | 4.13385506152412 |
| 39 | 121.6 | 126.520056817208 | -4.92005681720789 |
| 40 | 135.8 | 134.622663068021 | 1.17733693197917 |
| 41 | 143.8 | 143.446657320597 | 0.35334267940286 |
| 42 | 147.5 | 144.916040627877 | 2.58395937212268 |
| 43 | 136.2 | 136.166717044136 | 0.033282955863508 |
| 44 | 156.6 | 164.671176525905 | -8.0711765259055 |
| 45 | 123.3 | 125.299862874271 | -1.99986287427072 |
| 46 | 104.5 | 107.037119796671 | -2.53711979667143 |
| 47 | 139.8 | 144.591318084746 | -4.79131808474616 |
| 48 | 136.5 | 137.716569353931 | -1.2165693539312 |
| 49 | 112.1 | 113.658825909679 | -1.55882590967928 |
| 50 | 118.5 | 115.208433589861 | 3.291566410139 |
| 51 | 94.4 | 96.3685444622555 | -1.96854446225553 |
| 52 | 102.3 | 102.425842410489 | -0.125842410489466 |
| 53 | 111.4 | 113.354576332682 | -1.95457633268204 |
| 54 | 99.2 | 97.5885066005316 | 1.61149339946844 |
| 55 | 87.8 | 92.0009658001225 | -4.20096580012253 |
| 56 | 115.8 | 114.769595369728 | 1.03040463027231 |
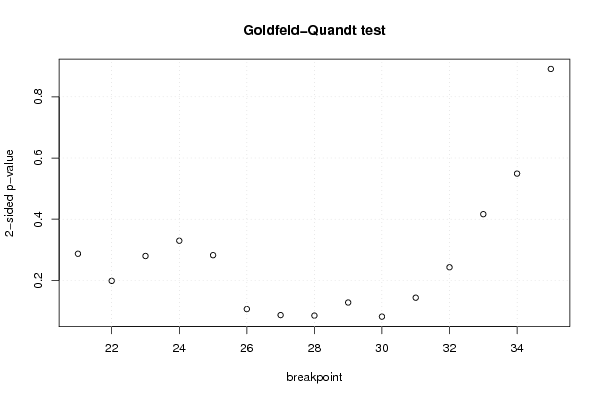
| Goldfeld-Quandt test for Heteroskedasticity | |||
| p-values | Alternative Hypothesis | ||
| breakpoint index | greater | 2-sided | less |
| 21 | 0.856414727521685 | 0.287170544956629 | 0.143585272478315 |
| 22 | 0.900705038209417 | 0.198589923581166 | 0.0992949617905828 |
| 23 | 0.860096039398146 | 0.279807921203708 | 0.139903960601854 |
| 24 | 0.835143834636266 | 0.329712330727467 | 0.164856165363734 |
| 25 | 0.858744623367108 | 0.282510753265784 | 0.141255376632892 |
| 26 | 0.94678225993733 | 0.106435480125339 | 0.0532177400626696 |
| 27 | 0.956659776393093 | 0.0866804472138135 | 0.0433402236069068 |
| 28 | 0.95746143168005 | 0.085077136639899 | 0.0425385683199495 |
| 29 | 0.936089062099625 | 0.127821875800751 | 0.0639109379003754 |
| 30 | 0.95918263660974 | 0.081634726780518 | 0.040817363390259 |
| 31 | 0.92821979931457 | 0.143560401370859 | 0.0717802006854293 |
| 32 | 0.878505547338121 | 0.242988905323758 | 0.121494452661879 |
| 33 | 0.791774060662984 | 0.416451878674031 | 0.208225939337016 |
| 34 | 0.725468147052283 | 0.549063705895433 | 0.274531852947717 |
| 35 | 0.554495772308269 | 0.891008455383463 | 0.445504227691731 |
| Meta Analysis of Goldfeld-Quandt test for Heteroskedasticity | |||
| Description | # significant tests | % significant tests | OK/NOK |
| 1% type I error level | 0 | 0 | OK |
| 5% type I error level | 0 | 0 | OK |
| 10% type I error level | 3 | 0.2 | NOK |