| Multiple Linear Regression - Estimated Regression Equation |
| Y[t] = + 2.22376675354193 -0.0079494985633593X[t] + 1.43718399412033Y1[t] -0.559931494666128Y2[t] -0.368554988553163Y3[t] + 0.368298781202975Y4[t] -0.276786896503478M1[t] -0.470758496794736M2[t] -0.348945862635600M3[t] -0.228263175107274M4[t] -0.364395505657626M5[t] -0.153384005778434M6[t] + 0.537200243224335M7[t] -0.634309077860441M8[t] -0.512368949548809M9[t] + 0.0643622420032612M10[t] -0.134758856878862M11[t] -0.00497891142074613t + e[t] |
| Multiple Linear Regression - Ordinary Least Squares | |||||
| Variable | Parameter | S.D. | T-STAT H0: parameter = 0 | 2-tail p-value | 1-tail p-value |
| (Intercept) | 2.22376675354193 | 0.985077 | 2.2575 | 0.029808 | 0.014904 |
| X | -0.0079494985633593 | 0.004484 | -1.773 | 0.084248 | 0.042124 |
| Y1 | 1.43718399412033 | 0.147512 | 9.7428 | 0 | 0 |
| Y2 | -0.559931494666128 | 0.27011 | -2.073 | 0.045006 | 0.022503 |
| Y3 | -0.368554988553163 | 0.267209 | -1.3793 | 0.175874 | 0.087937 |
| Y4 | 0.368298781202975 | 0.14153 | 2.6023 | 0.013131 | 0.006565 |
| M1 | -0.276786896503478 | 0.13933 | -1.9866 | 0.054217 | 0.027109 |
| M2 | -0.470758496794736 | 0.14209 | -3.3131 | 0.002033 | 0.001017 |
| M3 | -0.348945862635600 | 0.13989 | -2.4944 | 0.017081 | 0.008541 |
| M4 | -0.228263175107274 | 0.13444 | -1.6979 | 0.097707 | 0.048853 |
| M5 | -0.364395505657626 | 0.130901 | -2.7838 | 0.008327 | 0.004164 |
| M6 | -0.153384005778434 | 0.130524 | -1.1751 | 0.247249 | 0.123624 |
| M7 | 0.537200243224335 | 0.131918 | 4.0722 | 0.000228 | 0.000114 |
| M8 | -0.634309077860441 | 0.195992 | -3.2364 | 0.002511 | 0.001255 |
| M9 | -0.512368949548809 | 0.188841 | -2.7132 | 0.009958 | 0.004979 |
| M10 | 0.0643622420032612 | 0.175997 | 0.3657 | 0.716617 | 0.358309 |
| M11 | -0.134758856878862 | 0.142327 | -0.9468 | 0.34971 | 0.174855 |
| t | -0.00497891142074613 | 0.003513 | -1.4173 | 0.164548 | 0.082274 |
| Multiple Linear Regression - Regression Statistics | |
| Multiple R | 0.985830567255625 |
| R-squared | 0.971861907335547 |
| Adjusted R-squared | 0.959273813248818 |
| F-TEST (value) | 77.2048493314117 |
| F-TEST (DF numerator) | 17 |
| F-TEST (DF denominator) | 38 |
| p-value | 0 |
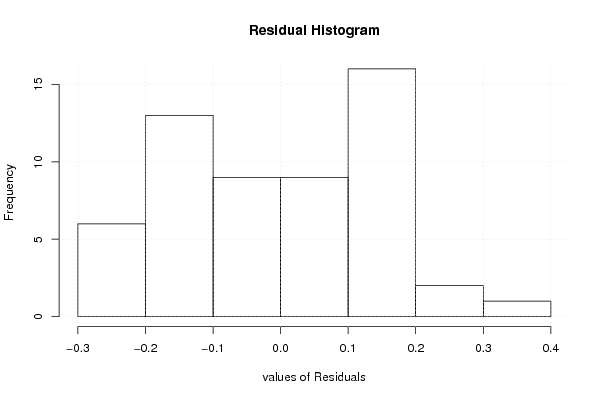
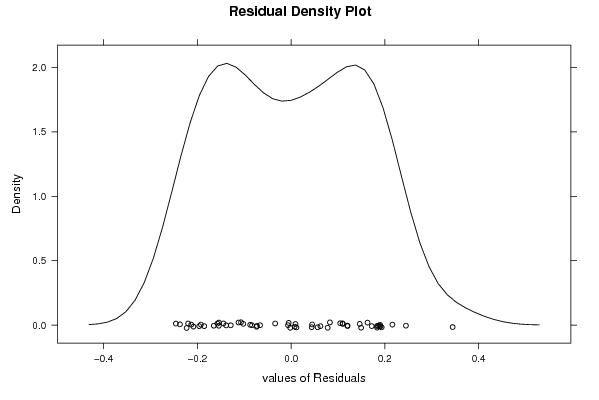
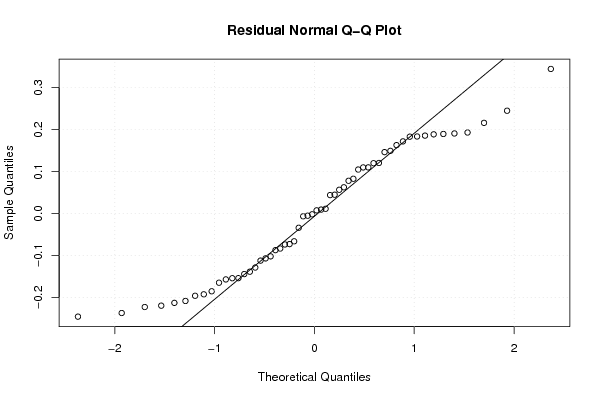
| Multiple Linear Regression - Residual Statistics | |
| Residual Standard Deviation | 0.184535380982358 |
| Sum Squared Residuals | 1.29402565970356 |
| Multiple Linear Regression - Actuals, Interpolation, and Residuals | |||
| Time or Index | Actuals | Interpolation Forecast | Residuals Prediction Error |
| 1 | 9.5 | 9.53396171613988 | -0.0339617161398841 |
| 2 | 9.6 | 9.78518798036736 | -0.185187980367362 |
| 3 | 9.5 | 9.5727872810232 | -0.0727872810232039 |
| 4 | 9.1 | 9.30825742432862 | -0.208257424328622 |
| 5 | 8.9 | 8.73700391695196 | 0.162996083048038 |
| 6 | 9 | 8.9906203246762 | 0.00937967532380436 |
| 7 | 10.1 | 9.91692040060337 | 0.183079599396632 |
| 8 | 10.3 | 10.4540663499839 | -0.154066349983899 |
| 9 | 10.2 | 10.0143718877325 | 0.185628112267515 |
| 10 | 9.6 | 9.82272263537158 | -0.222722635371578 |
| 11 | 9.2 | 9.20175437918828 | -0.00175437918828520 |
| 12 | 9.3 | 9.18008133306011 | 0.119918666939888 |
| 13 | 9.4 | 9.5019813780878 | -0.101981378087810 |
| 14 | 9.4 | 9.3434321882798 | 0.0565678117202089 |
| 15 | 9.2 | 9.20658360265735 | -0.0065836026573519 |
| 16 | 9 | 8.91717238046813 | 0.0828276195318734 |
| 17 | 9 | 8.7550930954642 | 0.244906904535796 |
| 18 | 9 | 9.0736875937836 | -0.073687593783602 |
| 19 | 9.8 | 9.72198152958787 | 0.0780184704121272 |
| 20 | 10 | 9.85370609418812 | 0.146293905811884 |
| 21 | 9.8 | 9.69012148586344 | 0.109878514136560 |
| 22 | 9.3 | 9.4539288479389 | -0.153928847938904 |
| 23 | 9 | 8.85063701920313 | 0.149362980796870 |
| 24 | 9 | 9.00521646253753 | -0.0052164625375295 |
| 25 | 9.1 | 9.08869737538975 | 0.0113026246102521 |
| 26 | 9.1 | 8.9280843748008 | 0.171915625199199 |
| 27 | 9.1 | 8.88399996270604 | 0.216000037293963 |
| 28 | 9.2 | 8.85553000935295 | 0.34446999064705 |
| 29 | 8.8 | 8.99592567666885 | -0.195925676668844 |
| 30 | 8.3 | 8.5456531226098 | -0.245653122609795 |
| 31 | 8.4 | 8.63698252349225 | -0.236982523492247 |
| 32 | 8.1 | 8.26478292578836 | -0.164782925788359 |
| 33 | 7.7 | 7.83854464358062 | -0.138544643580618 |
| 34 | 7.9 | 7.71641704693096 | 0.183582953069038 |
| 35 | 7.9 | 8.0924227722276 | -0.192422772227601 |
| 36 | 8 | 8.21948921673943 | -0.219489216739433 |
| 37 | 7.9 | 7.9661396289281 | -0.0661396289280972 |
| 38 | 7.6 | 7.5560776899501 | 0.0439223100499016 |
| 39 | 7.1 | 7.24419991808063 | -0.144199918080629 |
| 40 | 6.8 | 6.90682501819357 | -0.106825018193571 |
| 41 | 6.5 | 6.6286397045399 | -0.128639704539894 |
| 42 | 6.9 | 6.71047029129731 | 0.189529708702688 |
| 43 | 8.2 | 8.01128919066093 | 0.188710809339073 |
| 44 | 8.7 | 8.6374394362613 | 0.062560563738707 |
| 45 | 8.3 | 8.45696198282346 | -0.156961982823456 |
| 46 | 7.9 | 7.70693146975856 | 0.193068530241444 |
| 47 | 7.5 | 7.45518582938098 | 0.0448141706190159 |
| 48 | 7.8 | 7.69521298766293 | 0.104787012337074 |
| 49 | 8.3 | 8.10921990145446 | 0.190780098545540 |
| 50 | 8.4 | 8.48721776660195 | -0.0872177666019477 |
| 51 | 8.2 | 8.19242923553278 | 0.00757076446722211 |
| 52 | 7.7 | 7.81221516765673 | -0.112215167656729 |
| 53 | 7.2 | 7.2833376063751 | -0.0833376063750966 |
| 54 | 7.3 | 7.1795686676331 | 0.120431332366905 |
| 55 | 8.1 | 8.31282635565558 | -0.212826355655585 |
| 56 | 8.5 | 8.39000519377833 | 0.109994806221667 |
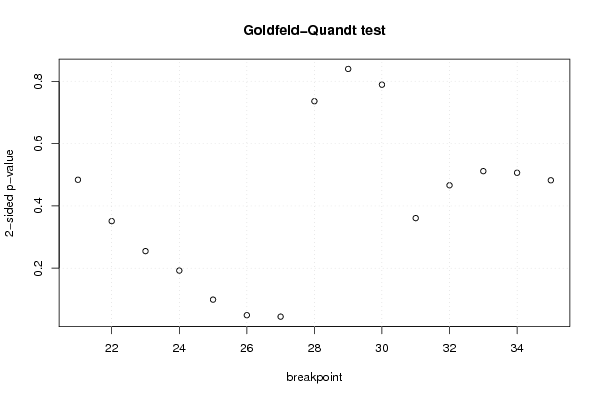
| Goldfeld-Quandt test for Heteroskedasticity | |||
| p-values | Alternative Hypothesis | ||
| breakpoint index | greater | 2-sided | less |
| 21 | 0.241882390412166 | 0.483764780824333 | 0.758117609587834 |
| 22 | 0.17554594220179 | 0.35109188440358 | 0.82445405779821 |
| 23 | 0.127396435491555 | 0.254792870983109 | 0.872603564508445 |
| 24 | 0.0962173068693836 | 0.192434613738767 | 0.903782693130616 |
| 25 | 0.0496126086543224 | 0.0992252173086449 | 0.950387391345678 |
| 26 | 0.024613896375093 | 0.049227792750186 | 0.975386103624907 |
| 27 | 0.0222856860722953 | 0.0445713721445907 | 0.977714313927705 |
| 28 | 0.367942932834228 | 0.735885865668456 | 0.632057067165772 |
| 29 | 0.419734473304647 | 0.839468946609295 | 0.580265526695352 |
| 30 | 0.394482249343766 | 0.788964498687532 | 0.605517750656234 |
| 31 | 0.819593464751866 | 0.360813070496268 | 0.180406535248134 |
| 32 | 0.766954234423433 | 0.466091531153134 | 0.233045765576567 |
| 33 | 0.74424653225016 | 0.51150693549968 | 0.25575346774984 |
| 34 | 0.746861183292919 | 0.506277633414162 | 0.253138816707081 |
| 35 | 0.758907988698053 | 0.482184022603894 | 0.241092011301947 |
| Meta Analysis of Goldfeld-Quandt test for Heteroskedasticity | |||
| Description | # significant tests | % significant tests | OK/NOK |
| 1% type I error level | 0 | 0 | OK |
| 5% type I error level | 2 | 0.133333333333333 | NOK |
| 10% type I error level | 3 | 0.2 | NOK |