| Multiple Linear Regression - Estimated Regression Equation |
| bouw[t] = -70.0162864747521 -1.81003827719032mannen[t] + 4.08858284192562vrouwen[t] + 0.77967992895012voeding[t] + 41.0588701858582M1[t] + 50.1872660447502M2[t] + 46.6574823541635M3[t] + 40.2621729669653M4[t] + 22.5006585403526M5[t] + 33.2821430817369M6[t] + 47.0327937744364M7[t] + 45.9679281108619M8[t] + 48.5163017701577M9[t] + 46.6145544649861M10[t] + 49.7862179431847M11[t] + e[t] |
| Multiple Linear Regression - Ordinary Least Squares | |||||
| Variable | Parameter | S.D. | T-STAT H0: parameter = 0 | 2-tail p-value | 1-tail p-value |
| (Intercept) | -70.0162864747521 | 23.621808 | -2.9641 | 0.004797 | 0.002398 |
| mannen | -1.81003827719032 | 1.174195 | -1.5415 | 0.130044 | 0.065022 |
| vrouwen | 4.08858284192562 | 1.020707 | 4.0056 | 0.000224 | 0.000112 |
| voeding | 0.77967992895012 | 0.127917 | 6.0952 | 0 | 0 |
| M1 | 41.0588701858582 | 2.759092 | 14.8813 | 0 | 0 |
| M2 | 50.1872660447502 | 3.05342 | 16.4364 | 0 | 0 |
| M3 | 46.6574823541635 | 3.148458 | 14.8192 | 0 | 0 |
| M4 | 40.2621729669653 | 2.980952 | 13.5065 | 0 | 0 |
| M5 | 22.5006585403526 | 2.97585 | 7.5611 | 0 | 0 |
| M6 | 33.2821430817369 | 2.926093 | 11.3743 | 0 | 0 |
| M7 | 47.0327937744364 | 3.129464 | 15.029 | 0 | 0 |
| M8 | 45.9679281108619 | 2.983979 | 15.4049 | 0 | 0 |
| M9 | 48.5163017701577 | 2.990879 | 16.2214 | 0 | 0 |
| M10 | 46.6145544649861 | 2.970682 | 15.6915 | 0 | 0 |
| M11 | 49.7862179431847 | 3.060389 | 16.2679 | 0 | 0 |
| Multiple Linear Regression - Regression Statistics | |
| Multiple R | 0.9697721793007 |
| R-squared | 0.940458079745629 |
| Adjusted R-squared | 0.922336625755168 |
| F-TEST (value) | 51.8974956557398 |
| F-TEST (DF numerator) | 14 |
| F-TEST (DF denominator) | 46 |
| p-value | 0 |
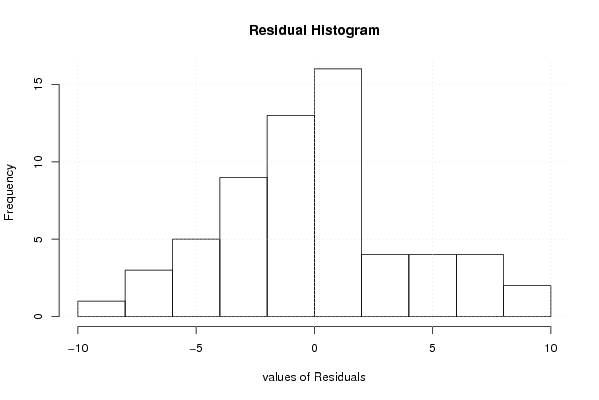
| Multiple Linear Regression - Residual Statistics | |
| Residual Standard Deviation | 4.53557743700298 |
| Sum Squared Residuals | 946.287283604322 |
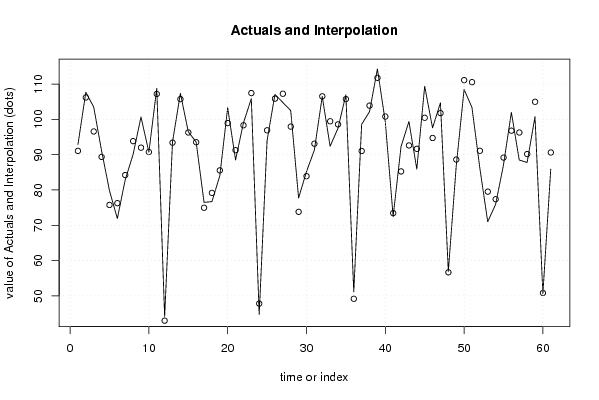
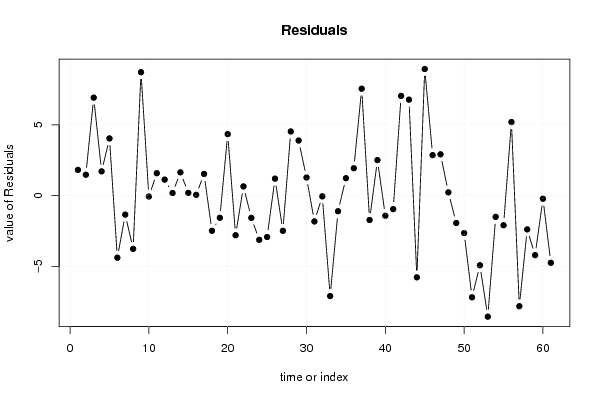
| Multiple Linear Regression - Actuals, Interpolation, and Residuals | |||
| Time or Index | Actuals | Interpolation Forecast | Residuals Prediction Error |
| 1 | 92.9 | 91.0778264294876 | 1.82217357051245 |
| 2 | 107.7 | 106.216832224449 | 1.48316777555099 |
| 3 | 103.5 | 96.5815022070644 | 6.91849779293564 |
| 4 | 91.1 | 89.3814450489871 | 1.71855495101289 |
| 5 | 79.8 | 75.7591535211046 | 4.04084647889543 |
| 6 | 71.9 | 76.2678813200646 | -4.36788132006464 |
| 7 | 82.9 | 84.2298822188159 | -1.32988221881588 |
| 8 | 90.1 | 93.8457618287749 | -3.74576182877487 |
| 9 | 100.7 | 91.989891246515 | 8.71010875348495 |
| 10 | 90.7 | 90.753209579042 | -0.0532095790420947 |
| 11 | 108.8 | 107.210394005674 | 1.58960599432583 |
| 12 | 44.1 | 42.9601660234523 | 1.13983397654774 |
| 13 | 93.6 | 93.4090771879604 | 0.190922812039544 |
| 14 | 107.4 | 105.750918981104 | 1.64908101889611 |
| 15 | 96.5 | 96.2974625445213 | 0.202537455478688 |
| 16 | 93.6 | 93.5355314592482 | 0.0644685407517947 |
| 17 | 76.5 | 74.9632197395449 | 1.53678026045513 |
| 18 | 76.7 | 79.170325035819 | -2.47032503581908 |
| 19 | 84 | 85.5539477569525 | -1.55394775695253 |
| 20 | 103.3 | 98.9530921324152 | 4.34690786758483 |
| 21 | 88.5 | 91.2848942553565 | -2.78489425535646 |
| 22 | 99 | 98.3439371988952 | 0.656062801104748 |
| 23 | 105.9 | 107.459682083886 | -1.55968208388572 |
| 24 | 44.7 | 47.8068012153616 | -3.10680121536157 |
| 25 | 94 | 96.911238180937 | -2.91123818093702 |
| 26 | 107.1 | 105.894406757384 | 1.20559324261649 |
| 27 | 104.8 | 107.272451810996 | -2.47245181099601 |
| 28 | 102.5 | 97.9672588447534 | 4.53274115524659 |
| 29 | 77.7 | 73.8063194785382 | 3.89368052146177 |
| 30 | 85.2 | 83.9111599257964 | 1.28884007420365 |
| 31 | 91.3 | 93.1118347215482 | -1.81183472154825 |
| 32 | 106.5 | 106.542966214234 | -0.0429662142343922 |
| 33 | 92.4 | 99.4753391524318 | -7.07533915243175 |
| 34 | 97.5 | 98.5923555240238 | -1.09235552402384 |
| 35 | 107 | 105.762169426693 | 1.23783057330652 |
| 36 | 51.1 | 49.1607489844193 | 1.93925101558071 |
| 37 | 98.6 | 91.0513294971107 | 7.54867050288932 |
| 38 | 102.2 | 103.907325503432 | -1.70732550343224 |
| 39 | 114.3 | 111.785936617446 | 2.51406338255376 |
| 40 | 99.4 | 100.812298436268 | -1.41229843626787 |
| 41 | 72.5 | 73.4444670309592 | -0.944467030959206 |
| 42 | 92.3 | 85.2604485137211 | 7.03955148627891 |
| 43 | 99.4 | 92.6229035581582 | 6.77709644184178 |
| 44 | 85.9 | 91.6541544541132 | -5.75415445411318 |
| 45 | 109.4 | 100.458116111644 | 8.94188388835553 |
| 46 | 97.6 | 94.7368069077003 | 2.86319309229971 |
| 47 | 104.7 | 101.778361925758 | 2.92163807424216 |
| 48 | 56.9 | 56.6622793200374 | 0.237720679962593 |
| 49 | 86.7 | 88.6230924260253 | -1.92309242602527 |
| 50 | 108.5 | 111.130516533631 | -2.63051653363135 |
| 51 | 103.4 | 110.562646819972 | -7.16264681997208 |
| 52 | 86.2 | 91.1034662107434 | -4.90346621074342 |
| 53 | 71 | 79.5268402298531 | -8.52684022985312 |
| 54 | 75.9 | 77.3901852045989 | -1.49018520459884 |
| 55 | 87.1 | 89.1814317445251 | -2.08143174452512 |
| 56 | 102 | 96.8040253704624 | 5.19597462953761 |
| 57 | 88.5 | 96.2917592340523 | -7.79175923405226 |
| 58 | 87.8 | 90.1736907903385 | -2.37369079033852 |
| 59 | 100.8 | 104.989392557989 | -4.18939255798879 |
| 60 | 50.6 | 50.8100044567295 | -0.210004456729456 |
| 61 | 85.9 | 90.627436278479 | -4.72743627847903 |
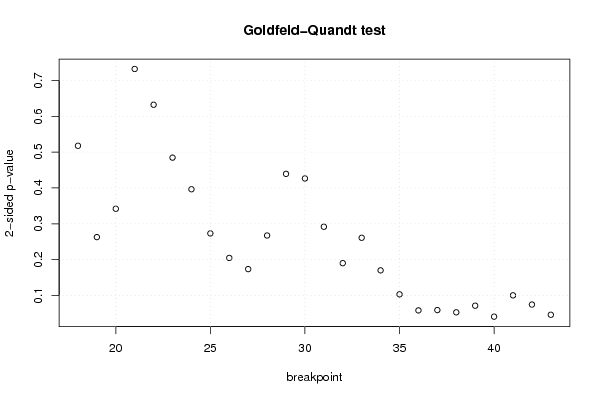
| Goldfeld-Quandt test for Heteroskedasticity | |||
| p-values | Alternative Hypothesis | ||
| breakpoint index | greater | 2-sided | less |
| 18 | 0.258826078491989 | 0.517652156983979 | 0.74117392150801 |
| 19 | 0.131477941778936 | 0.262955883557871 | 0.868522058221064 |
| 20 | 0.170956224885899 | 0.341912449771798 | 0.829043775114101 |
| 21 | 0.36595550448518 | 0.73191100897036 | 0.63404449551482 |
| 22 | 0.316045165831647 | 0.632090331663294 | 0.683954834168353 |
| 23 | 0.24229138459119 | 0.48458276918238 | 0.75770861540881 |
| 24 | 0.198198652588175 | 0.396397305176349 | 0.801801347411825 |
| 25 | 0.136626073086771 | 0.273252146173543 | 0.863373926913229 |
| 26 | 0.102461313915249 | 0.204922627830499 | 0.89753868608475 |
| 27 | 0.0868547581864624 | 0.173709516372925 | 0.913145241813538 |
| 28 | 0.133698867702527 | 0.267397735405055 | 0.866301132297473 |
| 29 | 0.219670131150646 | 0.439340262301293 | 0.780329868849354 |
| 30 | 0.213271865305381 | 0.426543730610763 | 0.786728134694619 |
| 31 | 0.145918958154056 | 0.291837916308112 | 0.854081041845944 |
| 32 | 0.095135454370088 | 0.190270908740176 | 0.904864545629912 |
| 33 | 0.130549658128591 | 0.261099316257181 | 0.86945034187141 |
| 34 | 0.0851156744641754 | 0.170231348928351 | 0.914884325535825 |
| 35 | 0.0517027812156978 | 0.103405562431396 | 0.948297218784302 |
| 36 | 0.0293099703433347 | 0.0586199406866693 | 0.970690029656665 |
| 37 | 0.0297133048345831 | 0.0594266096691663 | 0.970286695165417 |
| 38 | 0.0265880946589649 | 0.0531761893179298 | 0.973411905341035 |
| 39 | 0.0358172747536158 | 0.0716345495072316 | 0.964182725246384 |
| 40 | 0.020560855992317 | 0.041121711984634 | 0.979439144007683 |
| 41 | 0.0502719662818883 | 0.100543932563777 | 0.949728033718112 |
| 42 | 0.0374377927038072 | 0.0748755854076143 | 0.962562207296193 |
| 43 | 0.0231878187867907 | 0.0463756375735815 | 0.97681218121321 |
| Meta Analysis of Goldfeld-Quandt test for Heteroskedasticity | |||
| Description | # significant tests | % significant tests | OK/NOK |
| 1% type I error level | 0 | 0 | OK |
| 5% type I error level | 2 | 0.0769230769230769 | NOK |
| 10% type I error level | 7 | 0.269230769230769 | NOK |