| Multiple Linear Regression - Estimated Regression Equation |
| Y[t] = -37.2940689141077 + 0.73903374269513X[t] + 0.15933358934725Y1[t] + 0.234922754766544Y2[t] + 25.8124488053722M1[t] + 18.8216956913314M2[t] + 10.7186918552078M3[t] + 22.8169458116256M4[t] + 10.4075301409941M5[t] + 18.6651780109597M6[t] + 26.9840623171739M7[t] + 14.8732723526244M8[t] + 12.0424536035340M9[t] + 29.6388908477154M10[t] -5.40627929365437M11[t] -0.111511471449605t + e[t] |
| Multiple Linear Regression - Ordinary Least Squares | |||||
| Variable | Parameter | S.D. | T-STAT H0: parameter = 0 | 2-tail p-value | 1-tail p-value |
| (Intercept) | -37.2940689141077 | 7.498728 | -4.9734 | 1.2e-05 | 6e-06 |
| X | 0.73903374269513 | 0.075102 | 9.8404 | 0 | 0 |
| Y1 | 0.15933358934725 | 0.075192 | 2.119 | 0.040045 | 0.020022 |
| Y2 | 0.234922754766544 | 0.088372 | 2.6583 | 0.011062 | 0.005531 |
| M1 | 25.8124488053722 | 5.439057 | 4.7458 | 2.4e-05 | 1.2e-05 |
| M2 | 18.8216956913314 | 6.631915 | 2.838 | 0.006962 | 0.003481 |
| M3 | 10.7186918552078 | 4.042411 | 2.6516 | 0.011254 | 0.005627 |
| M4 | 22.8169458116256 | 3.728629 | 6.1194 | 0 | 0 |
| M5 | 10.4075301409941 | 4.259719 | 2.4432 | 0.018841 | 0.00942 |
| M6 | 18.6651780109597 | 3.889951 | 4.7983 | 2e-05 | 1e-05 |
| M7 | 26.9840623171739 | 5.330371 | 5.0623 | 9e-06 | 4e-06 |
| M8 | 14.8732723526244 | 5.069271 | 2.934 | 0.005402 | 0.002701 |
| M9 | 12.0424536035340 | 3.450527 | 3.49 | 0.001149 | 0.000574 |
| M10 | 29.6388908477154 | 4.712545 | 6.2894 | 0 | 0 |
| M11 | -5.40627929365437 | 5.118222 | -1.0563 | 0.296878 | 0.148439 |
| t | -0.111511471449605 | 0.038 | -2.9345 | 0.005395 | 0.002697 |
| Multiple Linear Regression - Regression Statistics | |
| Multiple R | 0.97835470633545 |
| R-squared | 0.957177931408722 |
| Adjusted R-squared | 0.941884335483265 |
| F-TEST (value) | 62.5868458977316 |
| F-TEST (DF numerator) | 15 |
| F-TEST (DF denominator) | 42 |
| p-value | 0 |
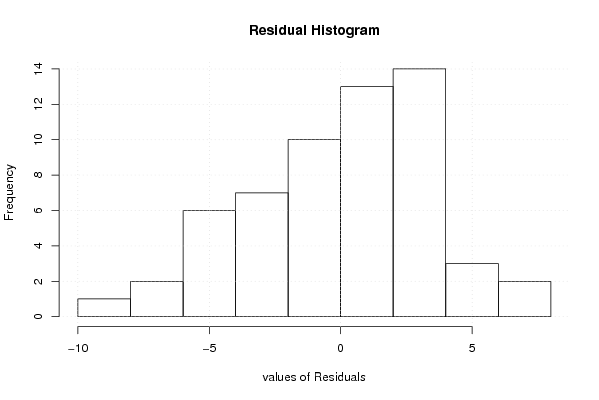
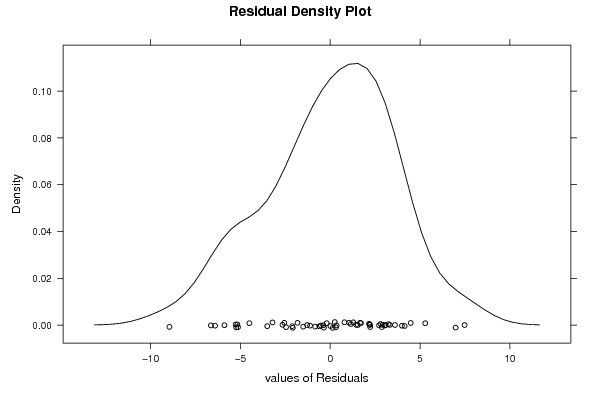
| Multiple Linear Regression - Residual Statistics | |
| Residual Standard Deviation | 4.06605318956999 |
| Sum Squared Residuals | 694.377118697318 |
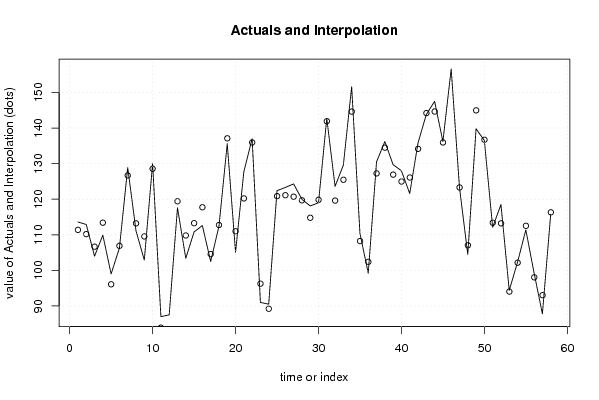
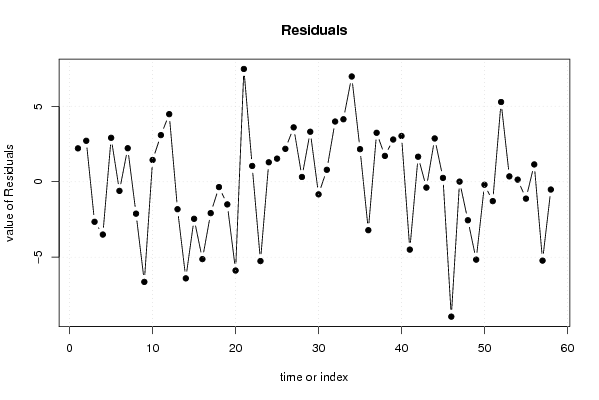
| Multiple Linear Regression - Actuals, Interpolation, and Residuals | |||
| Time or Index | Actuals | Interpolation Forecast | Residuals Prediction Error |
| 1 | 113.6 | 111.387617977808 | 2.21238202219182 |
| 2 | 112.9 | 110.186830842854 | 2.71316915714603 |
| 3 | 104 | 106.657054276905 | -2.65705427690547 |
| 4 | 109.9 | 113.403064862006 | -3.50306486200567 |
| 5 | 99 | 96.0879570281641 | 2.91204297183586 |
| 6 | 106.3 | 106.906049563541 | -0.606049563540803 |
| 7 | 128.9 | 126.678551420458 | 2.22144857954247 |
| 8 | 111.1 | 113.216895915796 | -2.11689591579626 |
| 9 | 102.9 | 109.540275619302 | -6.6402756193022 |
| 10 | 130 | 128.557861480146 | 1.44213851985418 |
| 11 | 87 | 83.9090909670136 | 3.09090903298642 |
| 12 | 87.5 | 83.0209709452805 | 4.4790290547195 |
| 13 | 117.6 | 119.422402764087 | -1.82240276408679 |
| 14 | 103.4 | 109.806251481246 | -6.40625148124578 |
| 15 | 110.8 | 113.258607255625 | -2.45860725562543 |
| 16 | 112.6 | 117.730520549539 | -5.13052054953865 |
| 17 | 102.5 | 104.581691117279 | -2.08169111727950 |
| 18 | 112.4 | 112.753434559988 | -0.353434559988104 |
| 19 | 135.6 | 137.104143488721 | -1.50414348872073 |
| 20 | 105.1 | 110.987157232133 | -5.88715723213283 |
| 21 | 127.7 | 120.223409532545 | 7.47659046745484 |
| 22 | 137 | 135.954763073748 | 1.04523692625173 |
| 23 | 91 | 96.259750824066 | -5.25975082406591 |
| 24 | 90.5 | 89.2117665017755 | 1.28823349822453 |
| 25 | 122.4 | 120.869169317785 | 1.53083068221457 |
| 26 | 123.3 | 121.119263843994 | 2.1807361560057 |
| 27 | 124.3 | 120.697381729852 | 3.60261827014765 |
| 28 | 120 | 119.685767878103 | 0.314232121897236 |
| 29 | 118.1 | 114.784877526826 | 3.31512247317414 |
| 30 | 119 | 119.837040940191 | -0.83704094019072 |
| 31 | 142.7 | 141.908737618777 | 0.791262381223005 |
| 32 | 123.6 | 119.610260606109 | 3.98973939389073 |
| 33 | 129.6 | 125.459334255059 | 4.14066574494139 |
| 34 | 151.6 | 144.623424833834 | 6.97657516616645 |
| 35 | 110.4 | 108.240248313456 | 2.15975168654358 |
| 36 | 99.2 | 102.413088805551 | -3.21308880555058 |
| 37 | 130.5 | 127.255806650078 | 3.24419334992250 |
| 38 | 136.2 | 134.489285526859 | 1.71071447314124 |
| 39 | 129.7 | 126.901835340717 | 2.79816465928299 |
| 40 | 128 | 124.965569650216 | 3.03443034978389 |
| 41 | 121.6 | 126.099973060017 | -4.49997306001733 |
| 42 | 135.8 | 134.142485865605 | 1.65751413439484 |
| 43 | 143.8 | 144.187879302930 | -0.387879302929657 |
| 44 | 147.5 | 144.631617494770 | 2.86838250522960 |
| 45 | 136.2 | 135.947538711605 | 0.252461288395305 |
| 46 | 156.6 | 165.545154675918 | -8.94515467591782 |
| 47 | 123.3 | 123.290909895464 | 0.00909010453591619 |
| 48 | 104.5 | 107.054173747393 | -2.55417374739345 |
| 49 | 139.8 | 144.965003290242 | -5.16500329024210 |
| 50 | 136.5 | 136.698368305047 | -0.198368305047200 |
| 51 | 112.1 | 113.385121396900 | -1.28512139689974 |
| 52 | 118.5 | 113.215077060137 | 5.28492293986319 |
| 53 | 94.4 | 94.0455012677132 | 0.354498732286814 |
| 54 | 102.3 | 102.160989070675 | 0.139010929324792 |
| 55 | 111.4 | 112.520688169115 | -1.12068816911509 |
| 56 | 99.2 | 98.0540687511912 | 1.14593124880876 |
| 57 | 87.8 | 93.0294418814893 | -5.22944188148933 |
| 58 | 115.8 | 116.318795936355 | -0.518795936354544 |
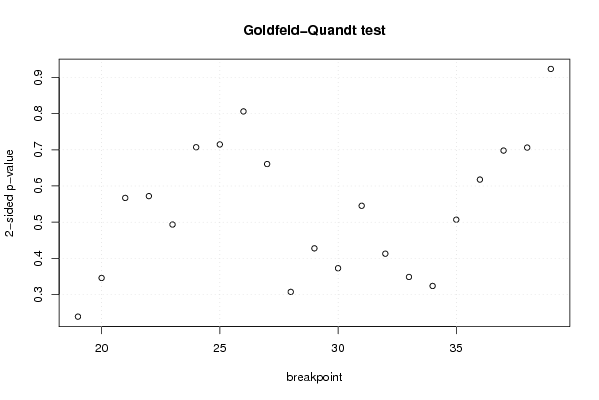
| Goldfeld-Quandt test for Heteroskedasticity | |||
| p-values | Alternative Hypothesis | ||
| breakpoint index | greater | 2-sided | less |
| 19 | 0.119594619944799 | 0.239189239889598 | 0.880405380055201 |
| 20 | 0.173043641702731 | 0.346087283405461 | 0.82695635829727 |
| 21 | 0.716451743344577 | 0.567096513310846 | 0.283548256655423 |
| 22 | 0.713972901512712 | 0.572054196974576 | 0.286027098487288 |
| 23 | 0.753240516270224 | 0.493518967459551 | 0.246759483729776 |
| 24 | 0.646494500981502 | 0.707010998036997 | 0.353505499018498 |
| 25 | 0.642618543935289 | 0.714762912129422 | 0.357381456064711 |
| 26 | 0.597015303984637 | 0.805969392030726 | 0.402984696015363 |
| 27 | 0.6696891984702 | 0.6606216030596 | 0.3303108015298 |
| 28 | 0.846218585659994 | 0.307562828680013 | 0.153781414340006 |
| 29 | 0.786071917842032 | 0.427856164315935 | 0.213928082157968 |
| 30 | 0.813522371107844 | 0.372955257784312 | 0.186477628892156 |
| 31 | 0.727320797787165 | 0.54535840442567 | 0.272679202212835 |
| 32 | 0.793481037001964 | 0.413037925996073 | 0.206518962998036 |
| 33 | 0.825617233066176 | 0.348765533867648 | 0.174382766933824 |
| 34 | 0.838006928167271 | 0.323986143665458 | 0.161993071832729 |
| 35 | 0.746544798372633 | 0.506910403254735 | 0.253455201627367 |
| 36 | 0.691152798154631 | 0.617694403690738 | 0.308847201845369 |
| 37 | 0.65110239433112 | 0.69779521133776 | 0.34889760566888 |
| 38 | 0.646960654216648 | 0.706078691566704 | 0.353039345783352 |
| 39 | 0.538400954296748 | 0.923198091406504 | 0.461599045703252 |
| Meta Analysis of Goldfeld-Quandt test for Heteroskedasticity | |||
| Description | # significant tests | % significant tests | OK/NOK |
| 1% type I error level | 0 | 0 | OK |
| 5% type I error level | 0 | 0 | OK |
| 10% type I error level | 0 | 0 | OK |