| Multiple Linear Regression - Estimated Regression Equation |
| Y[t] = + 1.21294728270632 + 0.820321325217045X[t] -0.0109867997205874M1[t] -0.0179058616904500M2[t] -0.0168277896417523M3[t] -0.0108277896417522M4[t] -0.00410907494262042M5[t] + 0.000609639756511355M6[t] -0.001952930845225M7[t] -0.0097967867478295M8[t] -0.00179678674782949M9[t] -0.00799999999999997M10[t] -0.00235935734956588M11[t] + e[t] |
| Multiple Linear Regression - Ordinary Least Squares | |||||
| Variable | Parameter | S.D. | T-STAT H0: parameter = 0 | 2-tail p-value | 1-tail p-value |
| (Intercept) | 1.21294728270632 | 0.035105 | 34.5522 | 0 | 0 |
| X | 0.820321325217045 | 0.045123 | 18.1798 | 0 | 0 |
| M1 | -0.0109867997205874 | 0.024986 | -0.4397 | 0.662108 | 0.331054 |
| M2 | -0.0179058616904500 | 0.026154 | -0.6846 | 0.496875 | 0.248438 |
| M3 | -0.0168277896417523 | 0.026135 | -0.6439 | 0.522722 | 0.261361 |
| M4 | -0.0108277896417522 | 0.026135 | -0.4143 | 0.680501 | 0.34025 |
| M5 | -0.00410907494262042 | 0.026124 | -0.1573 | 0.875675 | 0.437838 |
| M6 | 0.000609639756511355 | 0.026114 | 0.0233 | 0.981472 | 0.490736 |
| M7 | -0.001952930845225 | 0.026098 | -0.0748 | 0.94066 | 0.47033 |
| M8 | -0.0097967867478295 | 0.026083 | -0.3756 | 0.708867 | 0.354433 |
| M9 | -0.00179678674782949 | 0.026083 | -0.0689 | 0.945365 | 0.472683 |
| M10 | -0.00799999999999997 | 0.026079 | -0.3068 | 0.760352 | 0.380176 |
| M11 | -0.00235935734956588 | 0.026079 | -0.0905 | 0.928291 | 0.464145 |
| Multiple Linear Regression - Regression Statistics | |
| Multiple R | 0.936168716070138 |
| R-squared | 0.876411864948412 |
| Adjusted R-squared | 0.845514831185514 |
| F-TEST (value) | 28.3655664706835 |
| F-TEST (DF numerator) | 12 |
| F-TEST (DF denominator) | 48 |
| p-value | 0 |
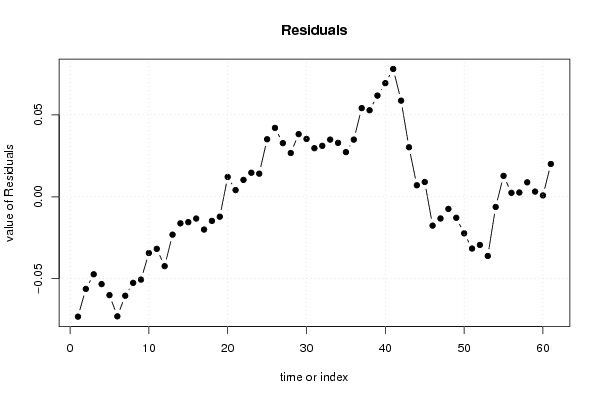
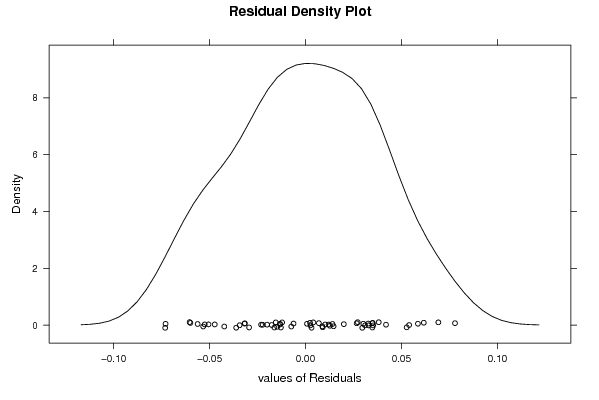
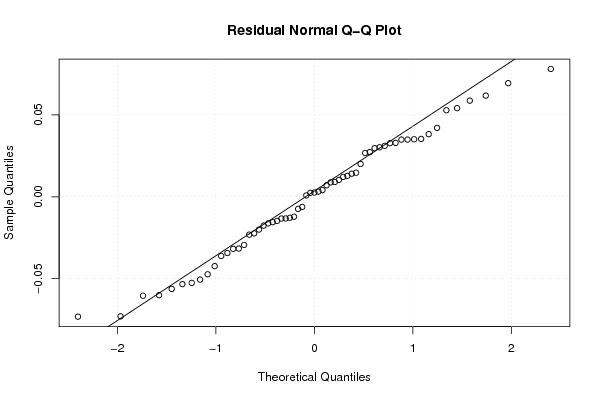
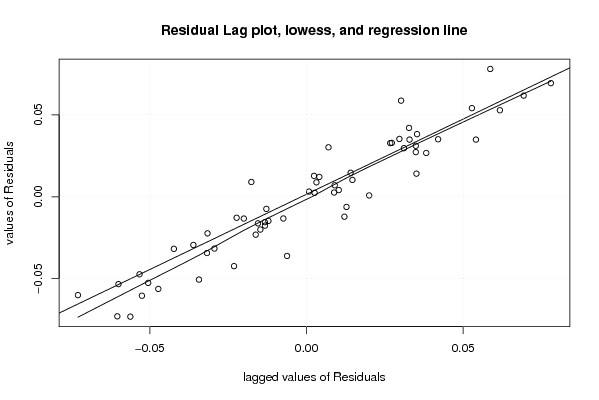
| Multiple Linear Regression - Residual Statistics | |
| Residual Standard Deviation | 0.0412343776253169 |
| Sum Squared Residuals | 0.0816131471110674 |
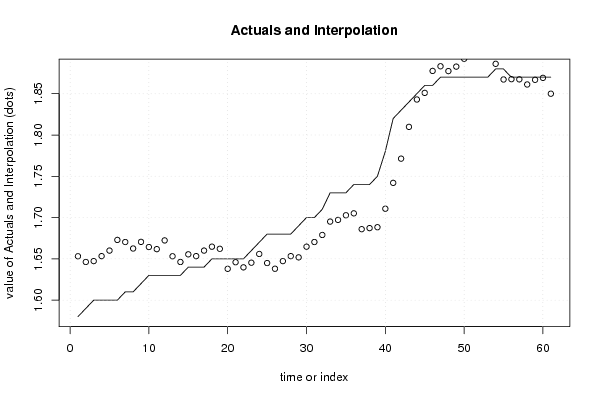
| Multiple Linear Regression - Actuals, Interpolation, and Residuals | |||
| Time or Index | Actuals | Interpolation Forecast | Residuals Prediction Error |
| 1 | 1.58 | 1.65313721185511 | -0.0731372118551079 |
| 2 | 1.59 | 1.64621814988524 | -0.0562181498852411 |
| 3 | 1.6 | 1.64729622193394 | -0.0472962219339386 |
| 4 | 1.6 | 1.65329622193394 | -0.0532962219339386 |
| 5 | 1.6 | 1.66001493663307 | -0.0600149366330704 |
| 6 | 1.6 | 1.67293686458437 | -0.0729368645843727 |
| 7 | 1.61 | 1.67037429398264 | -0.0603742939826363 |
| 8 | 1.61 | 1.66253043808003 | -0.0525304380800318 |
| 9 | 1.62 | 1.67053043808003 | -0.0505304380800318 |
| 10 | 1.63 | 1.66432722482786 | -0.0343272248278615 |
| 11 | 1.63 | 1.66176465422613 | -0.0317646542261252 |
| 12 | 1.63 | 1.67232722482786 | -0.0423272248278615 |
| 13 | 1.63 | 1.65313721185510 | -0.0231372118551036 |
| 14 | 1.63 | 1.64621814988524 | -0.016218149885241 |
| 15 | 1.64 | 1.65549943518611 | -0.0154994351861092 |
| 16 | 1.64 | 1.65329622193394 | -0.0132962219339388 |
| 17 | 1.64 | 1.66001493663307 | -0.0200149366330706 |
| 18 | 1.65 | 1.66473365133220 | -0.0147336513322024 |
| 19 | 1.65 | 1.66217108073047 | -0.012171080730466 |
| 20 | 1.65 | 1.63792079832352 | 0.0120792016764794 |
| 21 | 1.65 | 1.64592079832352 | 0.00407920167647939 |
| 22 | 1.65 | 1.63971758507135 | 0.0102824149286499 |
| 23 | 1.66 | 1.64535822772178 | 0.0146417722782158 |
| 24 | 1.67 | 1.65592079832352 | 0.0140792016764795 |
| 25 | 1.68 | 1.64493399860293 | 0.0350660013970669 |
| 26 | 1.68 | 1.63801493663307 | 0.0419850633669295 |
| 27 | 1.68 | 1.64729622193394 | 0.0327037780660613 |
| 28 | 1.68 | 1.65329622193394 | 0.0267037780660613 |
| 29 | 1.69 | 1.6518117233809 | 0.0381882766190999 |
| 30 | 1.7 | 1.66473365133220 | 0.0352663486677977 |
| 31 | 1.7 | 1.67037429398264 | 0.0296257060173636 |
| 32 | 1.71 | 1.67893686458437 | 0.0310631354156273 |
| 33 | 1.73 | 1.69514007783654 | 0.0348599221634568 |
| 34 | 1.73 | 1.69714007783654 | 0.0328599221634568 |
| 35 | 1.73 | 1.70278072048698 | 0.0272192795130227 |
| 36 | 1.74 | 1.70514007783654 | 0.0348599221634569 |
| 37 | 1.74 | 1.68595006486379 | 0.0540499351362148 |
| 38 | 1.74 | 1.68723421614609 | 0.0527657838539069 |
| 39 | 1.75 | 1.68831228819479 | 0.0616877118052091 |
| 40 | 1.78 | 1.71071871469913 | 0.0692812853008682 |
| 41 | 1.82 | 1.74204706915478 | 0.077952930845225 |
| 42 | 1.83 | 1.77137542361042 | 0.0586245763895819 |
| 43 | 1.84 | 1.80982891926953 | 0.0301710807304660 |
| 44 | 1.85 | 1.84300112962778 | 0.00699887037221826 |
| 45 | 1.86 | 1.85100112962778 | 0.00899887037221827 |
| 46 | 1.86 | 1.87761076938429 | -0.017610769384293 |
| 47 | 1.87 | 1.88325141203473 | -0.0132514120347271 |
| 48 | 1.87 | 1.87740755613212 | -0.0074075561321226 |
| 49 | 1.87 | 1.88282718291588 | -0.0128271829158760 |
| 50 | 1.87 | 1.89231454745035 | -0.0223145474503543 |
| 51 | 1.87 | 1.90159583275122 | -0.0315958327512226 |
| 52 | 1.87 | 1.89939261949905 | -0.0293926194990522 |
| 53 | 1.87 | 1.90611133419818 | -0.0361113341981840 |
| 54 | 1.88 | 1.88622040914080 | -0.00622040914080454 |
| 55 | 1.88 | 1.86725141203473 | 0.0127485879652727 |
| 56 | 1.87 | 1.86761076938429 | 0.00238923061570689 |
| 57 | 1.87 | 1.86740755613212 | 0.00259244386787736 |
| 58 | 1.87 | 1.86120434287995 | 0.00879565712004784 |
| 59 | 1.87 | 1.86684498553039 | 0.00315501446961374 |
| 60 | 1.87 | 1.86920434287995 | 0.000795657120047871 |
| 61 | 1.87 | 1.85001432990719 | 0.0199856700928058 |
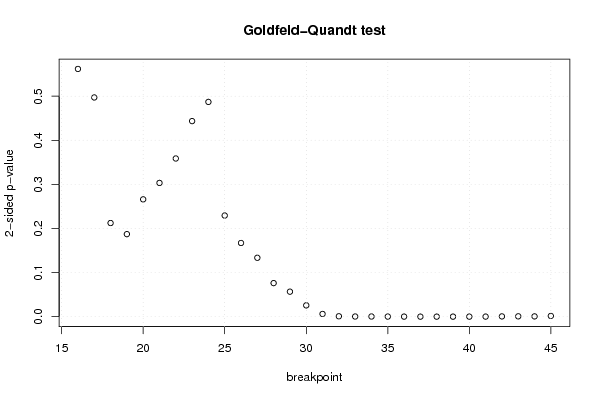
| Goldfeld-Quandt test for Heteroskedasticity | |||
| p-values | Alternative Hypothesis | ||
| breakpoint index | greater | 2-sided | less |
| 16 | 0.719102643543961 | 0.561794712912079 | 0.280897356456039 |
| 17 | 0.751421136690233 | 0.497157726619534 | 0.248578863309767 |
| 18 | 0.893831126296353 | 0.212337747407295 | 0.106168873703648 |
| 19 | 0.906413552086463 | 0.187172895827074 | 0.0935864479135371 |
| 20 | 0.86697279979967 | 0.26605440040066 | 0.13302720020033 |
| 21 | 0.848351074427127 | 0.303297851145746 | 0.151648925572873 |
| 22 | 0.820640771972725 | 0.358718456054551 | 0.179359228027275 |
| 23 | 0.77822748162691 | 0.44354503674618 | 0.22177251837309 |
| 24 | 0.756480403917769 | 0.487039192164463 | 0.243519596082231 |
| 25 | 0.885327280107935 | 0.229345439784129 | 0.114672719892064 |
| 26 | 0.916445372047645 | 0.16710925590471 | 0.083554627952355 |
| 27 | 0.933227796498253 | 0.133544407003493 | 0.0667722035017466 |
| 28 | 0.961956860254136 | 0.0760862794917291 | 0.0380431397458645 |
| 29 | 0.971667284568492 | 0.0566654308630159 | 0.0283327154315080 |
| 30 | 0.987179340095743 | 0.0256413198085133 | 0.0128206599042567 |
| 31 | 0.996927290430171 | 0.00614541913965717 | 0.00307270956982858 |
| 32 | 0.9995700102812 | 0.000859979437601168 | 0.000429989718800584 |
| 33 | 0.99982730363452 | 0.000345392730958800 | 0.000172696365479400 |
| 34 | 0.99983305738535 | 0.000333885229299968 | 0.000166942614649984 |
| 35 | 0.99989581787344 | 0.000208364253118787 | 0.000104182126559394 |
| 36 | 0.999941600059113 | 0.000116799881773352 | 5.8399940886676e-05 |
| 37 | 0.999982330242287 | 3.53395154251091e-05 | 1.76697577125545e-05 |
| 38 | 0.999987989867457 | 2.40202650868354e-05 | 1.20101325434177e-05 |
| 39 | 0.999990713812351 | 1.85723752978944e-05 | 9.28618764894718e-06 |
| 40 | 0.99997908585113 | 4.18282977424013e-05 | 2.09141488712006e-05 |
| 41 | 0.999947115314597 | 0.000105769370805826 | 5.28846854029131e-05 |
| 42 | 0.999703956576784 | 0.000592086846431685 | 0.000296043423215842 |
| 43 | 0.999630274111636 | 0.000739451776727719 | 0.000369725888363860 |
| 44 | 0.999679989580922 | 0.0006400208381569 | 0.00032001041907845 |
| 45 | 0.999196640635255 | 0.00160671872949027 | 0.000803359364745134 |
| Meta Analysis of Goldfeld-Quandt test for Heteroskedasticity | |||
| Description | # significant tests | % significant tests | OK/NOK |
| 1% type I error level | 15 | 0.5 | NOK |
| 5% type I error level | 16 | 0.533333333333333 | NOK |
| 10% type I error level | 18 | 0.6 | NOK |