| Multiple Linear Regression - Estimated Regression Equation |
| Y[t] = + 8.77083333333333 -0.391666666666667X[t] -0.0127083333333361M1[t] -0.0279166666666659M2[t] -0.0431249999999993M3[t] -0.098333333333333M4[t] -0.0535416666666664M5[t] -0.0687499999999997M6[t] + 0.036041666666667M7[t] + 0.0808333333333339M8[t] + 0.0256250000000003M9[t] -0.00958333333333323M10[t] -0.0647916666666663M11[t] -0.0247916666666667t + e[t] |
| Multiple Linear Regression - Ordinary Least Squares | |||||
| Variable | Parameter | S.D. | T-STAT H0: parameter = 0 | 2-tail p-value | 1-tail p-value |
| (Intercept) | 8.77083333333333 | 0.221833 | 39.538 | 0 | 0 |
| X | -0.391666666666667 | 0.182346 | -2.1479 | 0.03702 | 0.01851 |
| M1 | -0.0127083333333361 | 0.257051 | -0.0494 | 0.960783 | 0.480392 |
| M2 | -0.0279166666666659 | 0.256295 | -0.1089 | 0.913737 | 0.456868 |
| M3 | -0.0431249999999993 | 0.255609 | -0.1687 | 0.866761 | 0.43338 |
| M4 | -0.098333333333333 | 0.254994 | -0.3856 | 0.701549 | 0.350774 |
| M5 | -0.0535416666666664 | 0.25445 | -0.2104 | 0.834269 | 0.417134 |
| M6 | -0.0687499999999997 | 0.253978 | -0.2707 | 0.787838 | 0.393919 |
| M7 | 0.036041666666667 | 0.253578 | 0.1421 | 0.887596 | 0.443798 |
| M8 | 0.0808333333333339 | 0.25325 | 0.3192 | 0.751032 | 0.375516 |
| M9 | 0.0256250000000003 | 0.252994 | 0.1013 | 0.919763 | 0.459881 |
| M10 | -0.00958333333333323 | 0.252812 | -0.0379 | 0.969926 | 0.484963 |
| M11 | -0.0647916666666663 | 0.252702 | -0.2564 | 0.798789 | 0.399394 |
| t | -0.0247916666666667 | 0.004298 | -5.7683 | 1e-06 | 0 |
| Multiple Linear Regression - Regression Statistics | |
| Multiple R | 0.843611399723022 |
| R-squared | 0.711680193742636 |
| Adjusted R-squared | 0.630198509365556 |
| F-TEST (value) | 8.73423517424017 |
| F-TEST (DF numerator) | 13 |
| F-TEST (DF denominator) | 46 |
| p-value | 1.40547959937010e-08 |
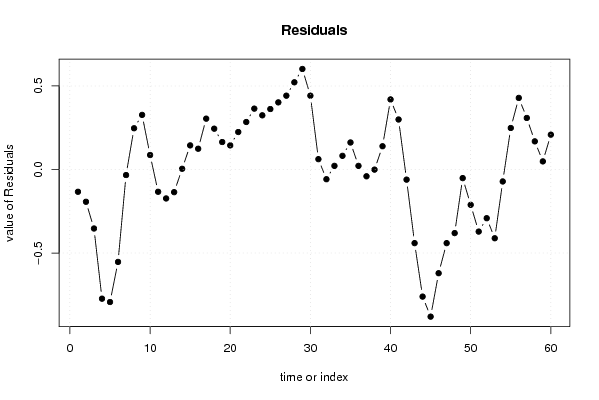
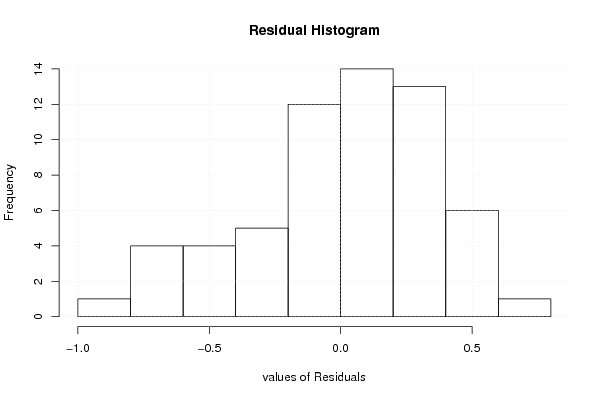
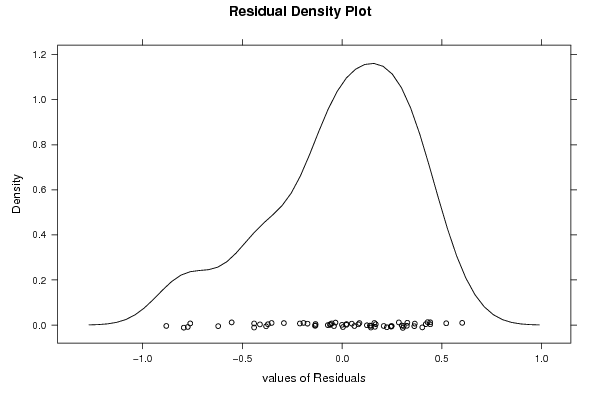
| Multiple Linear Regression - Residual Statistics | |
| Residual Standard Deviation | 0.399499233642769 |
| Sum Squared Residuals | 7.34158333333334 |
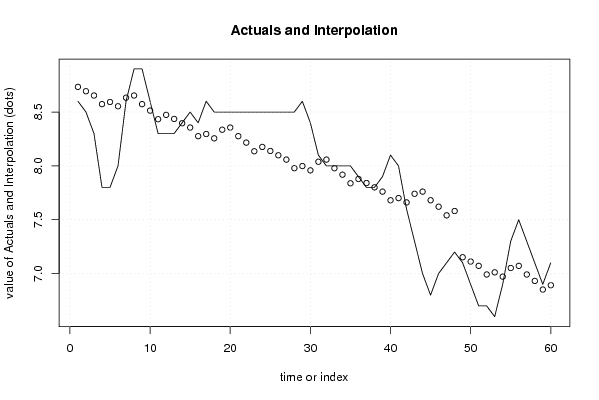
| Multiple Linear Regression - Actuals, Interpolation, and Residuals | |||
| Time or Index | Actuals | Interpolation Forecast | Residuals Prediction Error |
| 1 | 8.6 | 8.73333333333334 | -0.133333333333346 |
| 2 | 8.5 | 8.69333333333333 | -0.193333333333332 |
| 3 | 8.3 | 8.65333333333333 | -0.353333333333333 |
| 4 | 7.8 | 8.57333333333333 | -0.773333333333332 |
| 5 | 7.8 | 8.59333333333333 | -0.793333333333333 |
| 6 | 8 | 8.55333333333333 | -0.553333333333332 |
| 7 | 8.6 | 8.63333333333333 | -0.0333333333333324 |
| 8 | 8.9 | 8.65333333333333 | 0.246666666666668 |
| 9 | 8.9 | 8.57333333333333 | 0.326666666666667 |
| 10 | 8.6 | 8.51333333333333 | 0.0866666666666665 |
| 11 | 8.3 | 8.43333333333333 | -0.133333333333332 |
| 12 | 8.3 | 8.47333333333333 | -0.173333333333332 |
| 13 | 8.3 | 8.43583333333333 | -0.135833333333329 |
| 14 | 8.4 | 8.39583333333333 | 0.00416666666666725 |
| 15 | 8.5 | 8.35583333333333 | 0.144166666666666 |
| 16 | 8.4 | 8.27583333333333 | 0.124166666666667 |
| 17 | 8.6 | 8.29583333333333 | 0.304166666666666 |
| 18 | 8.5 | 8.25583333333333 | 0.244166666666667 |
| 19 | 8.5 | 8.33583333333333 | 0.164166666666667 |
| 20 | 8.5 | 8.35583333333333 | 0.144166666666667 |
| 21 | 8.5 | 8.27583333333333 | 0.224166666666667 |
| 22 | 8.5 | 8.21583333333333 | 0.284166666666667 |
| 23 | 8.5 | 8.13583333333333 | 0.364166666666667 |
| 24 | 8.5 | 8.17583333333333 | 0.324166666666667 |
| 25 | 8.5 | 8.13833333333333 | 0.36166666666667 |
| 26 | 8.5 | 8.09833333333333 | 0.401666666666666 |
| 27 | 8.5 | 8.05833333333333 | 0.441666666666666 |
| 28 | 8.5 | 7.97833333333333 | 0.521666666666667 |
| 29 | 8.6 | 7.99833333333333 | 0.601666666666666 |
| 30 | 8.4 | 7.95833333333333 | 0.441666666666667 |
| 31 | 8.1 | 8.03833333333333 | 0.0616666666666664 |
| 32 | 8 | 8.05833333333333 | -0.0583333333333335 |
| 33 | 8 | 7.97833333333333 | 0.0216666666666666 |
| 34 | 8 | 7.91833333333333 | 0.0816666666666668 |
| 35 | 8 | 7.83833333333333 | 0.161666666666666 |
| 36 | 7.9 | 7.87833333333333 | 0.0216666666666671 |
| 37 | 7.8 | 7.84083333333333 | -0.0408333333333306 |
| 38 | 7.8 | 7.80083333333333 | -0.000833333333334452 |
| 39 | 7.9 | 7.76083333333333 | 0.139166666666666 |
| 40 | 8.1 | 7.68083333333333 | 0.419166666666666 |
| 41 | 8 | 7.70083333333333 | 0.299166666666666 |
| 42 | 7.6 | 7.66083333333333 | -0.0608333333333342 |
| 43 | 7.3 | 7.74083333333333 | -0.440833333333334 |
| 44 | 7 | 7.76083333333333 | -0.760833333333334 |
| 45 | 6.8 | 7.68083333333333 | -0.880833333333334 |
| 46 | 7 | 7.62083333333333 | -0.620833333333334 |
| 47 | 7.1 | 7.54083333333333 | -0.440833333333334 |
| 48 | 7.2 | 7.58083333333333 | -0.380833333333333 |
| 49 | 7.1 | 7.15166666666666 | -0.0516666666666639 |
| 50 | 6.9 | 7.11166666666667 | -0.211666666666667 |
| 51 | 6.7 | 7.07166666666667 | -0.371666666666667 |
| 52 | 6.7 | 6.99166666666667 | -0.291666666666667 |
| 53 | 6.6 | 7.01166666666667 | -0.411666666666667 |
| 54 | 6.9 | 6.97166666666667 | -0.0716666666666666 |
| 55 | 7.3 | 7.05166666666667 | 0.248333333333333 |
| 56 | 7.5 | 7.07166666666667 | 0.428333333333333 |
| 57 | 7.3 | 6.99166666666667 | 0.308333333333333 |
| 58 | 7.1 | 6.93166666666667 | 0.168333333333333 |
| 59 | 6.9 | 6.85166666666667 | 0.0483333333333334 |
| 60 | 7.1 | 6.89166666666667 | 0.208333333333333 |
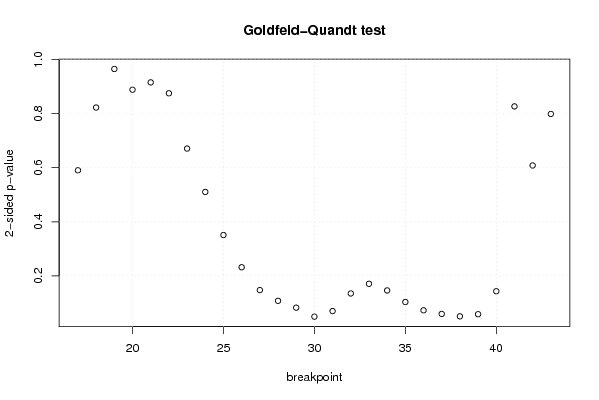
| Goldfeld-Quandt test for Heteroskedasticity | |||
| p-values | Alternative Hypothesis | ||
| breakpoint index | greater | 2-sided | less |
| 17 | 0.704784811578244 | 0.590430376843513 | 0.295215188421756 |
| 18 | 0.588718905301102 | 0.822562189397797 | 0.411281094698898 |
| 19 | 0.517363933622046 | 0.96527213275591 | 0.482636066377954 |
| 20 | 0.555780630775282 | 0.888438738449436 | 0.444219369224718 |
| 21 | 0.542206003808919 | 0.915587992382162 | 0.457793996191081 |
| 22 | 0.437626347525395 | 0.875252695050791 | 0.562373652474605 |
| 23 | 0.335387222481108 | 0.670774444962215 | 0.664612777518892 |
| 24 | 0.255197111423309 | 0.510394222846618 | 0.744802888576691 |
| 25 | 0.175504230592647 | 0.351008461185293 | 0.824495769407353 |
| 26 | 0.115880593290941 | 0.231761186581883 | 0.884119406709059 |
| 27 | 0.0736332816240045 | 0.147266563248009 | 0.926366718375995 |
| 28 | 0.0538058778594568 | 0.107611755718914 | 0.946194122140543 |
| 29 | 0.0411193671631924 | 0.0822387343263849 | 0.958880632836808 |
| 30 | 0.0245229300661803 | 0.0490458601323605 | 0.97547706993382 |
| 31 | 0.0348393528139029 | 0.0696787056278059 | 0.965160647186097 |
| 32 | 0.0674241668549775 | 0.134848333709955 | 0.932575833145022 |
| 33 | 0.0852494967145368 | 0.170498993429074 | 0.914750503285463 |
| 34 | 0.0730256113007672 | 0.146051222601534 | 0.926974388699233 |
| 35 | 0.0515474709441717 | 0.103094941888343 | 0.948452529055828 |
| 36 | 0.0362661271398535 | 0.072532254279707 | 0.963733872860146 |
| 37 | 0.0295650368542659 | 0.0591300737085318 | 0.970434963145734 |
| 38 | 0.0251087093129786 | 0.0502174186259573 | 0.974891290687021 |
| 39 | 0.0290225176271013 | 0.0580450352542025 | 0.970977482372899 |
| 40 | 0.0714955244046203 | 0.142991048809241 | 0.92850447559538 |
| 41 | 0.413410404768391 | 0.826820809536781 | 0.586589595231609 |
| 42 | 0.695867905412348 | 0.608264189175305 | 0.304132094587652 |
| 43 | 0.600623385442089 | 0.798753229115822 | 0.399376614557911 |
| Meta Analysis of Goldfeld-Quandt test for Heteroskedasticity | |||
| Description | # significant tests | % significant tests | OK/NOK |
| 1% type I error level | 0 | 0 | OK |
| 5% type I error level | 1 | 0.0370370370370370 | OK |
| 10% type I error level | 7 | 0.259259259259259 | NOK |