| Multiple Linear Regression - Estimated Regression Equation |
| Y[t] = + 12.9761973202013 -0.0437302424418521X[t] + 0.391874378892299M1[t] + 0.897837711324807M2[t] + 0.660439609582997M3[t] + 0.234421907724963M4[t] + 0.063567535529736M5[t] + 0.358066167101888M6[t] + 0.454545831418218M7[t] + 0.770604000129826M8[t] + 0.380445097074110M9[t] + 0.249516963843914M10[t] + 0.398409694904394M11[t] -0.0293669140023821t + e[t] |
| Multiple Linear Regression - Ordinary Least Squares | |||||
| Variable | Parameter | S.D. | T-STAT H0: parameter = 0 | 2-tail p-value | 1-tail p-value |
| (Intercept) | 12.9761973202013 | 0.911265 | 14.2398 | 0 | 0 |
| X | -0.0437302424418521 | 0.009977 | -4.383 | 6.7e-05 | 3.4e-05 |
| M1 | 0.391874378892299 | 0.278271 | 1.4082 | 0.165781 | 0.082891 |
| M2 | 0.897837711324807 | 0.357388 | 2.5122 | 0.015568 | 0.007784 |
| M3 | 0.660439609582997 | 0.362427 | 1.8223 | 0.074919 | 0.03746 |
| M4 | 0.234421907724963 | 0.323371 | 0.7249 | 0.472166 | 0.236083 |
| M5 | 0.063567535529736 | 0.282031 | 0.2254 | 0.822673 | 0.411336 |
| M6 | 0.358066167101888 | 0.280339 | 1.2773 | 0.20792 | 0.10396 |
| M7 | 0.454545831418218 | 0.282778 | 1.6074 | 0.114804 | 0.057402 |
| M8 | 0.770604000129826 | 0.333843 | 2.3083 | 0.025531 | 0.012765 |
| M9 | 0.380445097074110 | 0.303591 | 1.2531 | 0.216484 | 0.108242 |
| M10 | 0.249516963843914 | 0.316514 | 0.7883 | 0.434549 | 0.217274 |
| M11 | 0.398409694904394 | 0.348667 | 1.1427 | 0.25909 | 0.129545 |
| t | -0.0293669140023821 | 0.003053 | -9.6195 | 0 | 0 |
| Multiple Linear Regression - Regression Statistics | |
| Multiple R | 0.865878546514659 |
| R-squared | 0.749745657314338 |
| Adjusted R-squared | 0.679021603946651 |
| F-TEST (value) | 10.6009995413652 |
| F-TEST (DF numerator) | 13 |
| F-TEST (DF denominator) | 46 |
| p-value | 7.08769265500564e-10 |
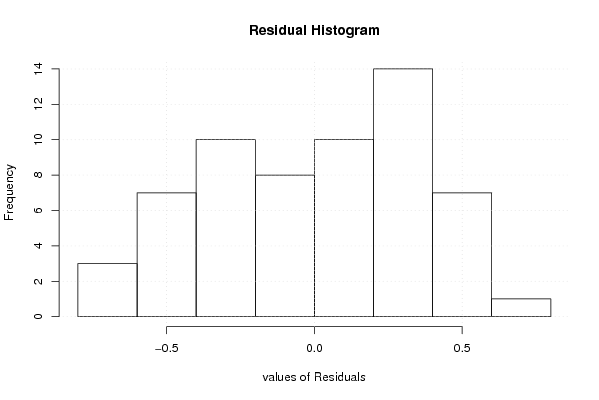
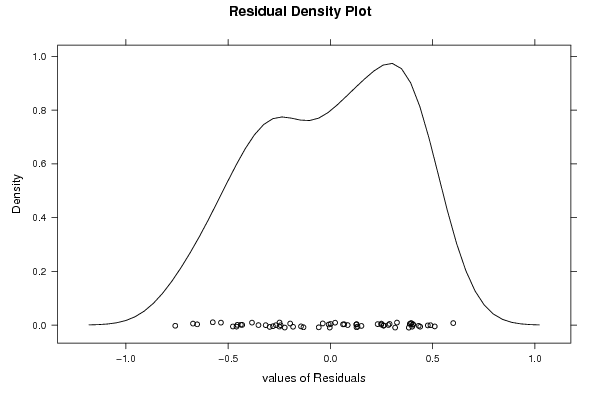
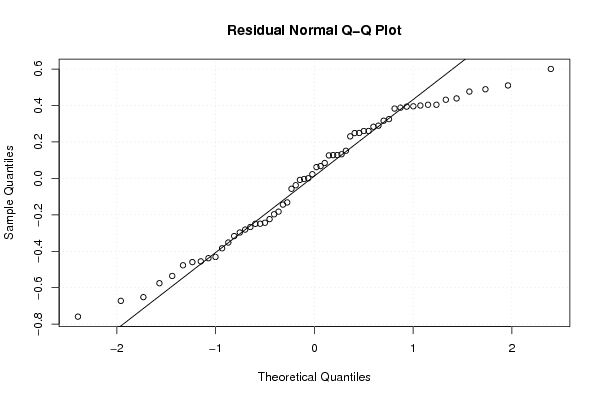
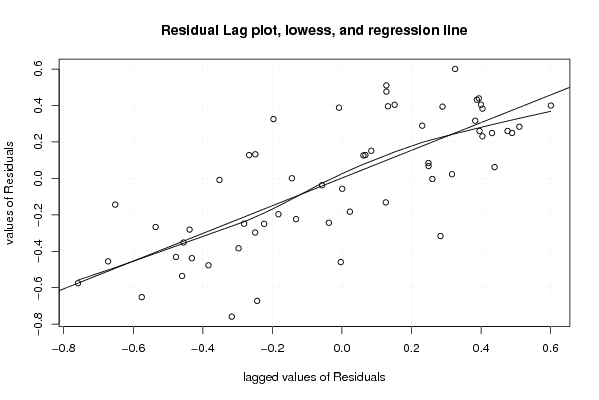
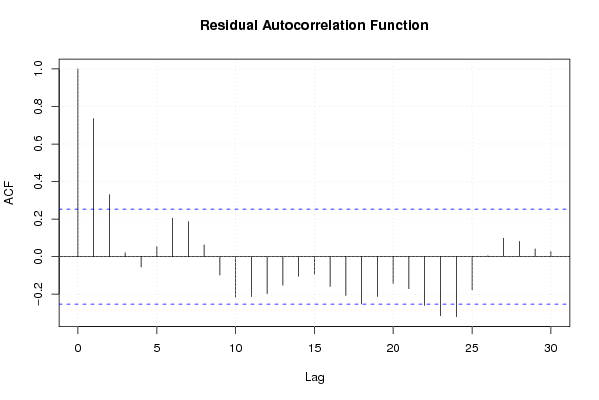
| Multiple Linear Regression - Residual Statistics | |
| Residual Standard Deviation | 0.401166295786969 |
| Sum Squared Residuals | 7.40298225627013 |
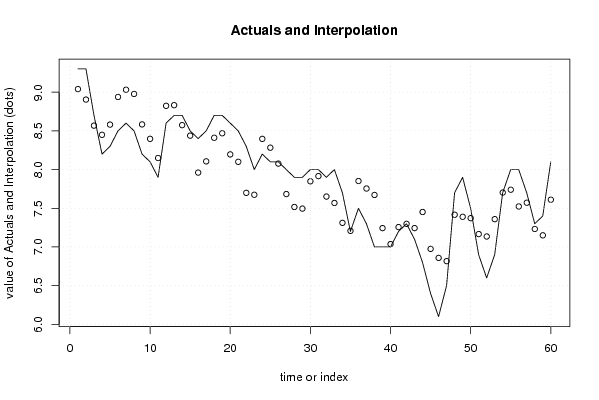
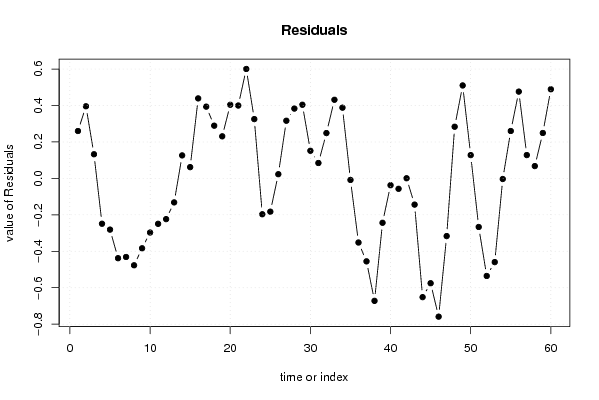
| Multiple Linear Regression - Actuals, Interpolation, and Residuals | |||
| Time or Index | Actuals | Interpolation Forecast | Residuals Prediction Error |
| 1 | 9.3 | 9.0400219530572 | 0.259978046942795 |
| 2 | 9.3 | 8.90439497730134 | 0.395605022698658 |
| 3 | 8.7 | 8.56766157365019 | 0.132338426349814 |
| 4 | 8.2 | 8.44899982459203 | -0.248999824592030 |
| 5 | 8.3 | 8.5811283809525 | -0.281128380952497 |
| 6 | 8.5 | 8.93809360765016 | -0.438093607650156 |
| 7 | 8.6 | 9.03144450342922 | -0.431444503429216 |
| 8 | 8.5 | 8.977039867092 | -0.477039867091993 |
| 9 | 8.2 | 8.58375219549901 | -0.383752195499008 |
| 10 | 8.1 | 8.39721900280132 | -0.297219002801319 |
| 11 | 7.9 | 8.14941078334786 | -0.249410783347860 |
| 12 | 8.6 | 8.82363628397576 | -0.223636283975755 |
| 13 | 8.7 | 8.83192878508667 | -0.131928785086671 |
| 14 | 8.7 | 8.57385713049368 | 0.126142869506320 |
| 15 | 8.5 | 8.43828284207505 | 0.0617171579249544 |
| 16 | 8.4 | 7.9610331049937 | 0.438966895006296 |
| 17 | 8.5 | 8.10628073408673 | 0.393719265913274 |
| 18 | 8.7 | 8.41076966985416 | 0.289230330145837 |
| 19 | 8.7 | 8.46913637167974 | 0.230863628320259 |
| 20 | 8.6 | 8.19608052313326 | 0.403919476866741 |
| 21 | 8.5 | 8.10015850014487 | 0.399841499855133 |
| 22 | 8.3 | 7.6993471194821 | 0.600652880517898 |
| 23 | 8 | 7.67456313648209 | 0.325436863517912 |
| 24 | 8.2 | 8.39689190379602 | -0.196891903796023 |
| 25 | 8.1 | 8.28273972606975 | -0.182739726069751 |
| 26 | 8.1 | 8.07714436240698 | 0.0228556375930144 |
| 27 | 8 | 7.68356164358142 | 0.316438356418579 |
| 28 | 7.9 | 7.51679662783723 | 0.383203372162772 |
| 29 | 7.9 | 7.49586933565121 | 0.404130664348787 |
| 30 | 8 | 7.84846153810469 | 0.151538461895312 |
| 31 | 8 | 7.91557428841864 | 0.0844257115813641 |
| 32 | 7.9 | 7.65126448836052 | 0.248735511639476 |
| 33 | 8 | 7.56846153810469 | 0.431538461895313 |
| 34 | 7.7 | 7.31195995750004 | 0.388040042499964 |
| 35 | 7.2 | 7.20846153810469 | -0.00846153810468793 |
| 36 | 7.5 | 7.85207586902329 | -0.352075869023288 |
| 37 | 7.3 | 7.75541578827376 | -0.455415788273757 |
| 38 | 7 | 7.67226510344818 | -0.672265103448178 |
| 39 | 7 | 7.24369819066913 | -0.243698190669132 |
| 40 | 7 | 7.03757595672727 | -0.0375759567272731 |
| 41 | 7.2 | 7.25716499797144 | -0.057164997971444 |
| 42 | 7.3 | 7.29927247908777 | 0.000727520912231643 |
| 43 | 7.1 | 7.24394055056453 | -0.143940550564531 |
| 44 | 6.8 | 7.45191736887842 | -0.651917368878422 |
| 45 | 6.4 | 6.97554223664592 | -0.575542236645916 |
| 46 | 6.1 | 6.8589774318552 | -0.758977431855192 |
| 47 | 6.5 | 6.81670135187844 | -0.316701351878436 |
| 48 | 7.7 | 7.41658544035518 | 0.283414559644817 |
| 49 | 7.9 | 7.38989374751262 | 0.510106252487384 |
| 50 | 7.5 | 7.37233842634982 | 0.127661573650185 |
| 51 | 6.9 | 7.16679575002421 | -0.266795750024215 |
| 52 | 6.6 | 7.13559448584977 | -0.535594485849765 |
| 53 | 6.9 | 7.35955655133812 | -0.45955655133812 |
| 54 | 7.7 | 7.70340270530322 | -0.00340270530322409 |
| 55 | 8 | 7.73990428590788 | 0.260095714092124 |
| 56 | 8 | 7.5236977525358 | 0.476302247464198 |
| 57 | 7.7 | 7.57208552960552 | 0.127914470394478 |
| 58 | 7.3 | 7.23249648836135 | 0.0675035116386488 |
| 59 | 7.4 | 7.15086319018693 | 0.249136809813071 |
| 60 | 8.1 | 7.61081050284975 | 0.48918949715025 |
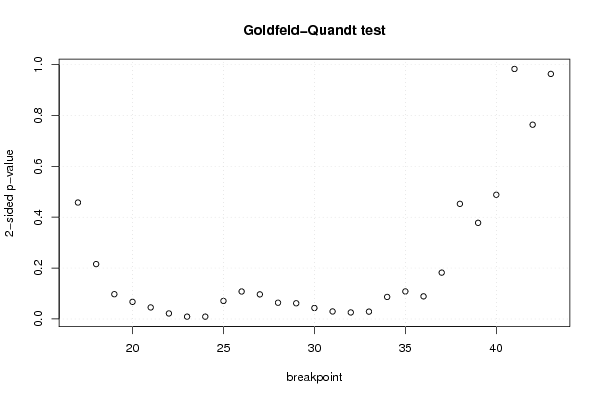
| Goldfeld-Quandt test for Heteroskedasticity | |||
| p-values | Alternative Hypothesis | ||
| breakpoint index | greater | 2-sided | less |
| 17 | 0.228883199574839 | 0.457766399149679 | 0.771116800425161 |
| 18 | 0.107884880748169 | 0.215769761496338 | 0.892115119251831 |
| 19 | 0.0486822304455969 | 0.0973644608911938 | 0.951317769554403 |
| 20 | 0.0336613542641461 | 0.0673227085282921 | 0.966338645735854 |
| 21 | 0.0226780109952999 | 0.0453560219905997 | 0.9773219890047 |
| 22 | 0.0108546113049305 | 0.0217092226098610 | 0.98914538869507 |
| 23 | 0.00454749245497722 | 0.00909498490995444 | 0.995452507545023 |
| 24 | 0.00454238395323441 | 0.00908476790646883 | 0.995457616046766 |
| 25 | 0.0354636394783131 | 0.0709272789566263 | 0.964536360521687 |
| 26 | 0.0540022338738688 | 0.108004467747738 | 0.945997766126131 |
| 27 | 0.0483502374169468 | 0.0967004748338936 | 0.951649762583053 |
| 28 | 0.0319372727569500 | 0.0638745455138999 | 0.96806272724305 |
| 29 | 0.0308586379432745 | 0.061717275886549 | 0.969141362056726 |
| 30 | 0.0215305423199142 | 0.0430610846398283 | 0.978469457680086 |
| 31 | 0.0147851047029676 | 0.0295702094059352 | 0.985214895297032 |
| 32 | 0.0128191165273892 | 0.0256382330547784 | 0.98718088347261 |
| 33 | 0.0144021861658246 | 0.0288043723316492 | 0.985597813834175 |
| 34 | 0.0432961307648881 | 0.0865922615297763 | 0.956703869235112 |
| 35 | 0.0541335471204317 | 0.108267094240863 | 0.945866452879568 |
| 36 | 0.0444713452338657 | 0.0889426904677313 | 0.955528654766134 |
| 37 | 0.0911090655363041 | 0.182218131072608 | 0.908890934463696 |
| 38 | 0.226298610698753 | 0.452597221397506 | 0.773701389301247 |
| 39 | 0.188982608484558 | 0.377965216969117 | 0.811017391515442 |
| 40 | 0.244152924459742 | 0.488305848919484 | 0.755847075540258 |
| 41 | 0.508492298217097 | 0.983015403565807 | 0.491507701782903 |
| 42 | 0.618088223471293 | 0.763823553057415 | 0.381911776528708 |
| 43 | 0.518257269423754 | 0.96348546115249 | 0.481742730576246 |
| Meta Analysis of Goldfeld-Quandt test for Heteroskedasticity | |||
| Description | # significant tests | % significant tests | OK/NOK |
| 1% type I error level | 2 | 0.0740740740740741 | NOK |
| 5% type I error level | 8 | 0.296296296296296 | NOK |
| 10% type I error level | 16 | 0.592592592592593 | NOK |