| Multiple Linear Regression - Estimated Regression Equation |
| inflatie[t] = + 1.28825292718720 + 0.164679951696550inflatie_levensmiddelen[t] + e[t] |
| Multiple Linear Regression - Ordinary Least Squares | |||||
| Variable | Parameter | S.D. | T-STAT H0: parameter = 0 | 2-tail p-value | 1-tail p-value |
| (Intercept) | 1.28825292718720 | 0.086087 | 14.9646 | 0 | 0 |
| inflatie_levensmiddelen | 0.164679951696550 | 0.019171 | 8.5899 | 0 | 0 |
| Multiple Linear Regression - Regression Statistics | |
| Multiple R | 0.751116916172864 |
| R-squared | 0.564176621761034 |
| Adjusted R-squared | 0.556530597581403 |
| F-TEST (value) | 73.7869261862917 |
| F-TEST (DF numerator) | 1 |
| F-TEST (DF denominator) | 57 |
| p-value | 7.26485538393717e-12 |
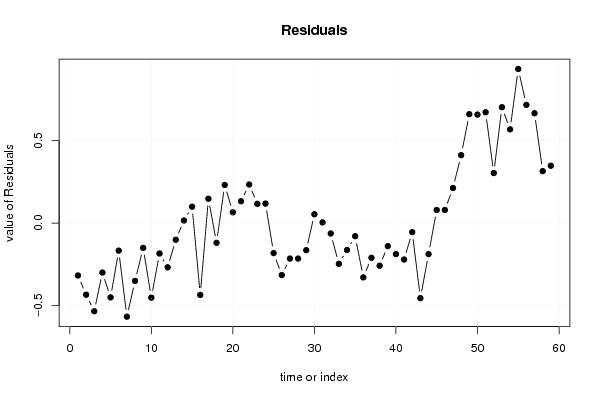
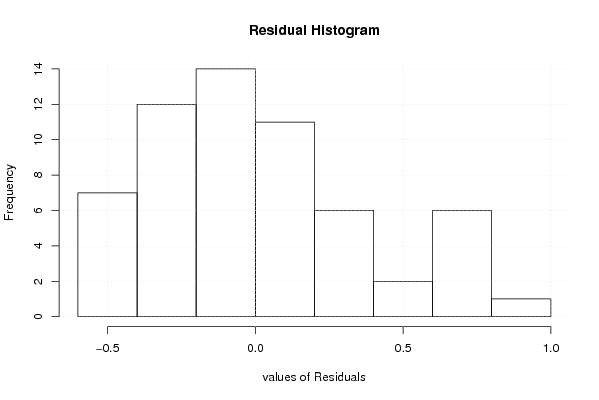
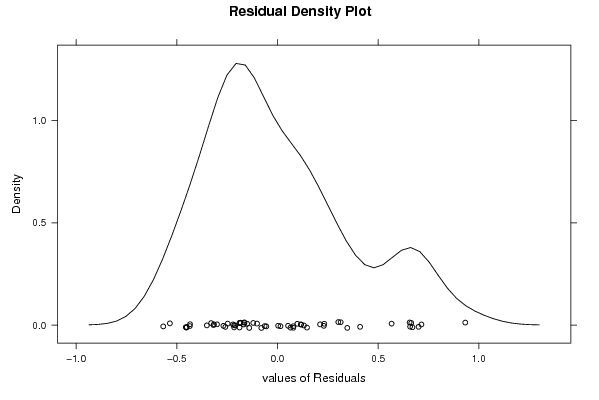
| Multiple Linear Regression - Residual Statistics | |
| Residual Standard Deviation | 0.362405795242342 |
| Sum Squared Residuals | 7.48626374423835 |
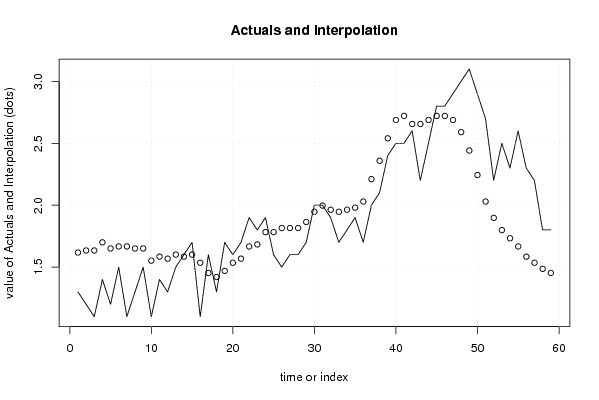
| Multiple Linear Regression - Actuals, Interpolation, and Residuals | |||
| Time or Index | Actuals | Interpolation Forecast | Residuals Prediction Error |
| 1 | 1.3 | 1.61761283058029 | -0.317612830580293 |
| 2 | 1.2 | 1.63408082574995 | -0.434080825749952 |
| 3 | 1.1 | 1.63408082574995 | -0.534080825749951 |
| 4 | 1.4 | 1.69995280642857 | -0.299952806428571 |
| 5 | 1.2 | 1.65054882091961 | -0.450548820919606 |
| 6 | 1.5 | 1.66701681608926 | -0.167016816089261 |
| 7 | 1.1 | 1.66701681608926 | -0.567016816089261 |
| 8 | 1.3 | 1.65054882091961 | -0.350548820919606 |
| 9 | 1.5 | 1.65054882091961 | -0.150548820919606 |
| 10 | 1.1 | 1.55174084990168 | -0.451740849901676 |
| 11 | 1.4 | 1.58467684024099 | -0.184676840240986 |
| 12 | 1.3 | 1.56820884507133 | -0.268208845071331 |
| 13 | 1.5 | 1.60114483541064 | -0.101144835410641 |
| 14 | 1.6 | 1.58467684024099 | 0.0153231597590140 |
| 15 | 1.7 | 1.60114483541064 | 0.0988551645893589 |
| 16 | 1.1 | 1.53527285473202 | -0.435272854732021 |
| 17 | 1.6 | 1.45293287888375 | 0.147067121116254 |
| 18 | 1.3 | 1.41999688854444 | -0.119996888544437 |
| 19 | 1.7 | 1.4694008740534 | 0.230599125946599 |
| 20 | 1.6 | 1.53527285473202 | 0.0647271452679789 |
| 21 | 1.7 | 1.56820884507133 | 0.131791154928669 |
| 22 | 1.9 | 1.66701681608926 | 0.232983183910739 |
| 23 | 1.8 | 1.68348481125892 | 0.116515188741084 |
| 24 | 1.9 | 1.78229278227685 | 0.117707217723154 |
| 25 | 1.6 | 1.78229278227685 | -0.182292782276846 |
| 26 | 1.5 | 1.81522877261616 | -0.315228772616156 |
| 27 | 1.6 | 1.81522877261616 | -0.215228772616155 |
| 28 | 1.6 | 1.81522877261616 | -0.215228772616155 |
| 29 | 1.7 | 1.86463275812512 | -0.164632758125120 |
| 30 | 2 | 1.94697273397340 | 0.0530272660266048 |
| 31 | 2 | 1.99637671948236 | 0.00362328051763999 |
| 32 | 1.9 | 1.96344072914305 | -0.0634407291430502 |
| 33 | 1.7 | 1.94697273397340 | -0.246972733973395 |
| 34 | 1.8 | 1.96344072914305 | -0.16344072914305 |
| 35 | 1.9 | 1.97990872431271 | -0.0799087243127052 |
| 36 | 1.7 | 2.02931270982167 | -0.32931270982167 |
| 37 | 2 | 2.21046065668787 | -0.210460656687874 |
| 38 | 2.1 | 2.35867261321477 | -0.258672613214769 |
| 39 | 2.4 | 2.53982056008097 | -0.139820560080974 |
| 40 | 2.5 | 2.68803251660787 | -0.188032516607868 |
| 41 | 2.5 | 2.72096850694718 | -0.220968506947178 |
| 42 | 2.6 | 2.65509652626856 | -0.0550965262685584 |
| 43 | 2.2 | 2.65509652626856 | -0.455096526268558 |
| 44 | 2.5 | 2.68803251660787 | -0.188032516607868 |
| 45 | 2.8 | 2.72096850694718 | 0.0790314930528216 |
| 46 | 2.8 | 2.72096850694718 | 0.0790314930528216 |
| 47 | 2.9 | 2.68803251660787 | 0.211967483392132 |
| 48 | 3 | 2.58922454558994 | 0.410775454410061 |
| 49 | 3.1 | 2.44101258906304 | 0.658987410936956 |
| 50 | 2.9 | 2.24339664702718 | 0.656603352972816 |
| 51 | 2.7 | 2.02931270982167 | 0.67068729017833 |
| 52 | 2.2 | 1.89756874846443 | 0.30243125153557 |
| 53 | 2.5 | 1.7987607774465 | 0.701239222553499 |
| 54 | 2.3 | 1.73288879676788 | 0.567111203232119 |
| 55 | 2.6 | 1.66701681608926 | 0.932983183910739 |
| 56 | 2.3 | 1.58467684024099 | 0.715323159759014 |
| 57 | 2.2 | 1.53527285473202 | 0.664727145267979 |
| 58 | 1.8 | 1.48586886922306 | 0.314131130776944 |
| 59 | 1.8 | 1.45293287888375 | 0.347067121116254 |
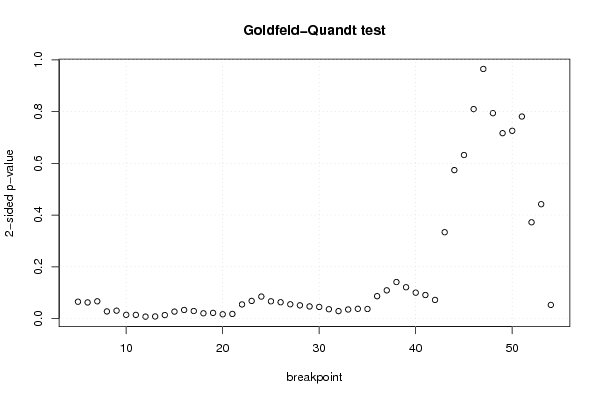
| Goldfeld-Quandt test for Heteroskedasticity | |||
| p-values | Alternative Hypothesis | ||
| breakpoint index | greater | 2-sided | less |
| 5 | 0.0326281988823356 | 0.0652563977646713 | 0.967371801117664 |
| 6 | 0.0312791131206282 | 0.0625582262412564 | 0.968720886879372 |
| 7 | 0.0334535820699092 | 0.0669071641398184 | 0.96654641793009 |
| 8 | 0.0139172228652256 | 0.0278344457304512 | 0.986082777134774 |
| 9 | 0.0153673028819489 | 0.0307346057638978 | 0.984632697118051 |
| 10 | 0.00731906686724517 | 0.0146381337344903 | 0.992680933132755 |
| 11 | 0.0071688129781305 | 0.014337625956261 | 0.99283118702187 |
| 12 | 0.00380905741026834 | 0.00761811482053668 | 0.996190942589732 |
| 13 | 0.00417021279225777 | 0.00834042558451554 | 0.995829787207742 |
| 14 | 0.00686800367209979 | 0.0137360073441996 | 0.9931319963279 |
| 15 | 0.0135327503080857 | 0.0270655006161715 | 0.986467249691914 |
| 16 | 0.0167105508664688 | 0.0334211017329376 | 0.983289449133531 |
| 17 | 0.0146887295205489 | 0.0293774590410978 | 0.985311270479451 |
| 18 | 0.0102876728739955 | 0.0205753457479909 | 0.989712327126005 |
| 19 | 0.0110314378362361 | 0.0220628756724722 | 0.988968562163764 |
| 20 | 0.00838905171496416 | 0.0167781034299283 | 0.991610948285036 |
| 21 | 0.00906764759072576 | 0.0181352951814515 | 0.990932352409274 |
| 22 | 0.0274202458799108 | 0.0548404917598216 | 0.97257975412009 |
| 23 | 0.0341856306235717 | 0.0683712612471434 | 0.965814369376428 |
| 24 | 0.0425868890206574 | 0.0851737780413147 | 0.957413110979343 |
| 25 | 0.0334514938249024 | 0.0669029876498048 | 0.966548506175098 |
| 26 | 0.0316498855965211 | 0.0632997711930422 | 0.968350114403479 |
| 27 | 0.0276757431856122 | 0.0553514863712244 | 0.972324256814388 |
| 28 | 0.0256738777502495 | 0.0513477555004991 | 0.97432612224975 |
| 29 | 0.0235285421198603 | 0.0470570842397207 | 0.97647145788014 |
| 30 | 0.0225559979463835 | 0.0451119958927670 | 0.977444002053617 |
| 31 | 0.0181348440763620 | 0.0362696881527241 | 0.981865155923638 |
| 32 | 0.0144767957283773 | 0.0289535914567547 | 0.985523204271623 |
| 33 | 0.0176566954004093 | 0.0353133908008187 | 0.98234330459959 |
| 34 | 0.0189524824530508 | 0.0379049649061016 | 0.98104751754695 |
| 35 | 0.0186212025386530 | 0.0372424050773059 | 0.981378797461347 |
| 36 | 0.0433751849182819 | 0.0867503698365638 | 0.956624815081718 |
| 37 | 0.0546489362400105 | 0.109297872480021 | 0.94535106375999 |
| 38 | 0.0706432840472426 | 0.141286568094485 | 0.929356715952757 |
| 39 | 0.0606111118357189 | 0.121222223671438 | 0.939388888164281 |
| 40 | 0.0501021740004277 | 0.100204348000855 | 0.949897825999572 |
| 41 | 0.0455963963399208 | 0.0911927926798416 | 0.95440360366008 |
| 42 | 0.0360858680603622 | 0.0721717361207244 | 0.963914131939638 |
| 43 | 0.166880666234147 | 0.333761332468293 | 0.833119333765853 |
| 44 | 0.286818556982526 | 0.573637113965053 | 0.713181443017474 |
| 45 | 0.315964686942831 | 0.631929373885663 | 0.684035313057169 |
| 46 | 0.404670408399941 | 0.809340816799882 | 0.595329591600059 |
| 47 | 0.517770955861056 | 0.964458088277888 | 0.482229044138944 |
| 48 | 0.603176053704825 | 0.79364789259035 | 0.396823946295175 |
| 49 | 0.641815574773598 | 0.716368850452803 | 0.358184425226402 |
| 50 | 0.637247177067797 | 0.725505645864406 | 0.362752822932203 |
| 51 | 0.609667216464404 | 0.780665567071192 | 0.390332783535596 |
| 52 | 0.813931751903546 | 0.372136496192907 | 0.186068248096454 |
| 53 | 0.778995620284944 | 0.442008759430112 | 0.221004379715056 |
| 54 | 0.97354526310127 | 0.0529094737974597 | 0.0264547368987298 |
| Meta Analysis of Goldfeld-Quandt test for Heteroskedasticity | |||
| Description | # significant tests | % significant tests | OK/NOK |
| 1% type I error level | 2 | 0.04 | NOK |
| 5% type I error level | 21 | 0.42 | NOK |
| 10% type I error level | 35 | 0.7 | NOK |