| Multiple Linear Regression - Estimated Regression Equation |
| Y[t] = + 127.5625 + 11.7475000000000X[t] -4.92000000000005M1[t] -0.244000000000000M2[t] + 4.06399999999999M3[t] + 6.16999999999999M4[t] + 2.44999999999999M5[t] -1.52399999999999M6[t] -7.496M7[t] -3.76M8[t] -1.07600000000000M9[t] + 6.594M10[t] + 2.61200000000000M11[t] + e[t] |
| Multiple Linear Regression - Ordinary Least Squares | |||||
| Variable | Parameter | S.D. | T-STAT H0: parameter = 0 | 2-tail p-value | 1-tail p-value |
| (Intercept) | 127.5625 | 2.981426 | 42.7857 | 0 | 0 |
| X | 11.7475000000000 | 2.12959 | 5.5163 | 1e-06 | 1e-06 |
| M1 | -4.92000000000005 | 4.173128 | -1.179 | 0.244343 | 0.122172 |
| M2 | -0.244000000000000 | 4.173128 | -0.0585 | 0.953623 | 0.476811 |
| M3 | 4.06399999999999 | 4.173128 | 0.9738 | 0.335117 | 0.167558 |
| M4 | 6.16999999999999 | 4.173128 | 1.4785 | 0.145943 | 0.072972 |
| M5 | 2.44999999999999 | 4.173128 | 0.5871 | 0.559953 | 0.279977 |
| M6 | -1.52399999999999 | 4.173128 | -0.3652 | 0.716605 | 0.358303 |
| M7 | -7.496 | 4.173128 | -1.7963 | 0.078883 | 0.039442 |
| M8 | -3.76 | 4.173128 | -0.901 | 0.372181 | 0.18609 |
| M9 | -1.07600000000000 | 4.173128 | -0.2578 | 0.797656 | 0.398828 |
| M10 | 6.594 | 4.173128 | 1.5801 | 0.120789 | 0.060394 |
| M11 | 2.61200000000000 | 4.173128 | 0.6259 | 0.534402 | 0.267201 |
| Multiple Linear Regression - Regression Statistics | |
| Multiple R | 0.732295623763541 |
| R-squared | 0.536256880583233 |
| Adjusted R-squared | 0.41785438200874 |
| F-TEST (value) | 4.52910104972019 |
| F-TEST (DF numerator) | 12 |
| F-TEST (DF denominator) | 47 |
| p-value | 8.29031147738801e-05 |
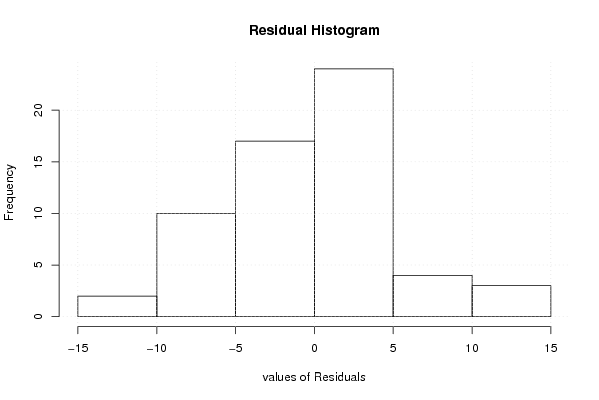
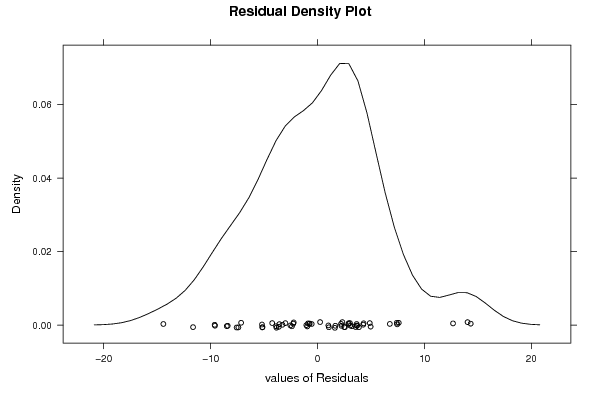
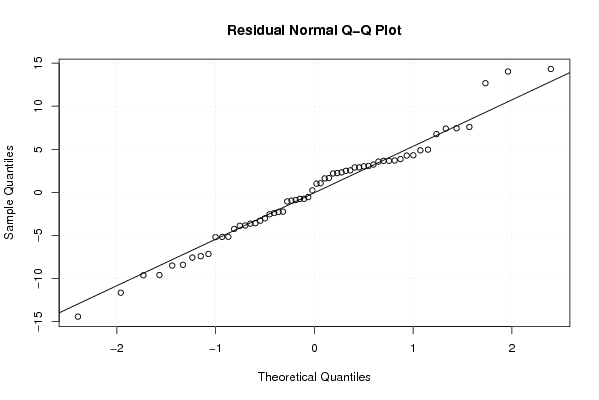
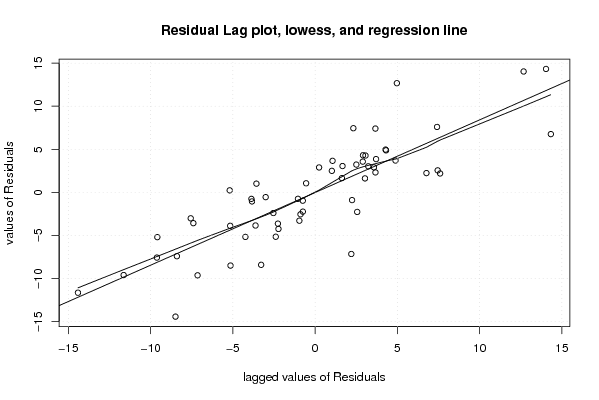
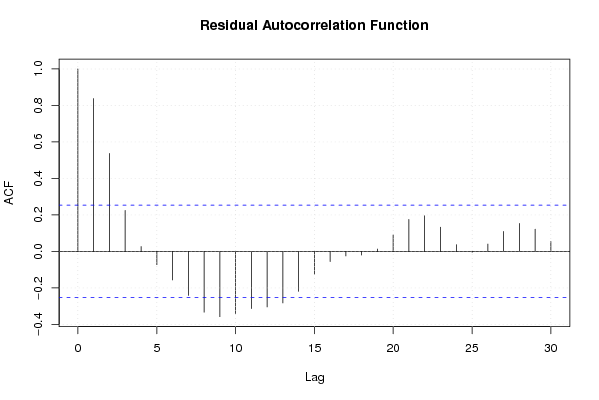
| Multiple Linear Regression - Residual Statistics | |
| Residual Standard Deviation | 6.59829394455289 |
| Sum Squared Residuals | 2046.2617 |
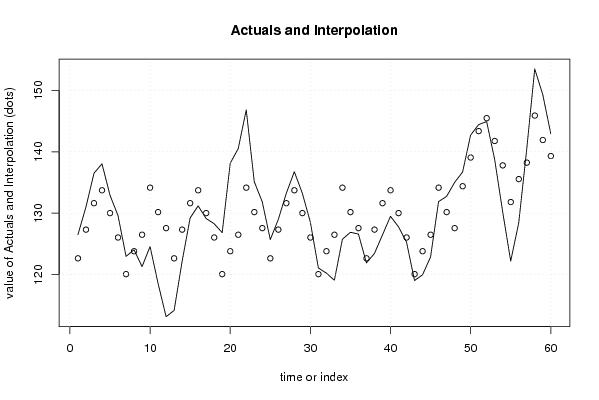
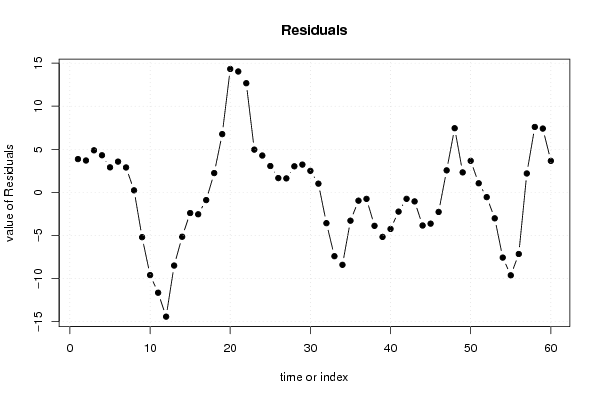
| Multiple Linear Regression - Actuals, Interpolation, and Residuals | |||
| Time or Index | Actuals | Interpolation Forecast | Residuals Prediction Error |
| 1 | 126.51 | 122.642500000000 | 3.86749999999979 |
| 2 | 131.02 | 127.3185 | 3.7015 |
| 3 | 136.51 | 131.6265 | 4.88349999999999 |
| 4 | 138.04 | 133.7325 | 4.30749999999998 |
| 5 | 132.92 | 130.0125 | 2.90750000000000 |
| 6 | 129.61 | 126.0385 | 3.57150000000002 |
| 7 | 122.96 | 120.0665 | 2.89350000000001 |
| 8 | 124.04 | 123.8025 | 0.237500000000006 |
| 9 | 121.29 | 126.4865 | -5.1965 |
| 10 | 124.56 | 134.1565 | -9.5965 |
| 11 | 118.53 | 130.1745 | -11.6445 |
| 12 | 113.14 | 127.5625 | -14.4225 |
| 13 | 114.15 | 122.6425 | -8.49249999999994 |
| 14 | 122.17 | 127.3185 | -5.14849999999999 |
| 15 | 129.23 | 131.6265 | -2.39650000000000 |
| 16 | 131.19 | 133.7325 | -2.5425 |
| 17 | 129.12 | 130.0125 | -0.892499999999997 |
| 18 | 128.28 | 126.0385 | 2.2415 |
| 19 | 126.83 | 120.0665 | 6.7635 |
| 20 | 138.13 | 123.8025 | 14.3275 |
| 21 | 140.52 | 126.4865 | 14.0335 |
| 22 | 146.83 | 134.1565 | 12.6735000000000 |
| 23 | 135.14 | 130.1745 | 4.96549999999999 |
| 24 | 131.84 | 127.5625 | 4.2775 |
| 25 | 125.7 | 122.6425 | 3.05750000000005 |
| 26 | 128.98 | 127.3185 | 1.6615 |
| 27 | 133.25 | 131.6265 | 1.62350000000001 |
| 28 | 136.76 | 133.7325 | 3.02750000000000 |
| 29 | 133.24 | 130.0125 | 3.22750000000001 |
| 30 | 128.54 | 126.0385 | 2.50149999999999 |
| 31 | 121.08 | 120.0665 | 1.01350000000000 |
| 32 | 120.23 | 123.8025 | -3.57250000000000 |
| 33 | 119.08 | 126.4865 | -7.4065 |
| 34 | 125.75 | 134.1565 | -8.4065 |
| 35 | 126.89 | 130.1745 | -3.28449999999999 |
| 36 | 126.6 | 127.5625 | -0.962500000000005 |
| 37 | 121.89 | 122.6425 | -0.752499999999949 |
| 38 | 123.44 | 127.3185 | -3.87849999999999 |
| 39 | 126.46 | 131.6265 | -5.1665 |
| 40 | 129.49 | 133.7325 | -4.24249999999999 |
| 41 | 127.78 | 130.0125 | -2.2325 |
| 42 | 125.29 | 126.0385 | -0.748499999999996 |
| 43 | 119.02 | 120.0665 | -1.04650000000001 |
| 44 | 119.96 | 123.8025 | -3.84250000000001 |
| 45 | 122.86 | 126.4865 | -3.6265 |
| 46 | 131.89 | 134.1565 | -2.26650000000001 |
| 47 | 132.73 | 130.1745 | 2.55549999999999 |
| 48 | 135.01 | 127.5625 | 7.4475 |
| 49 | 136.71 | 134.39 | 2.32000000000005 |
| 50 | 142.73 | 139.066 | 3.66399999999999 |
| 51 | 144.43 | 143.374 | 1.05600000000000 |
| 52 | 144.93 | 145.48 | -0.549999999999997 |
| 53 | 138.75 | 141.76 | -3.01000000000001 |
| 54 | 130.22 | 137.786 | -7.56600000000001 |
| 55 | 122.19 | 131.814 | -9.62400000000001 |
| 56 | 128.4 | 135.55 | -7.15 |
| 57 | 140.43 | 138.234 | 2.19600000000000 |
| 58 | 153.5 | 145.904 | 7.596 |
| 59 | 149.33 | 141.922 | 7.40800000000001 |
| 60 | 142.97 | 139.31 | 3.65999999999999 |
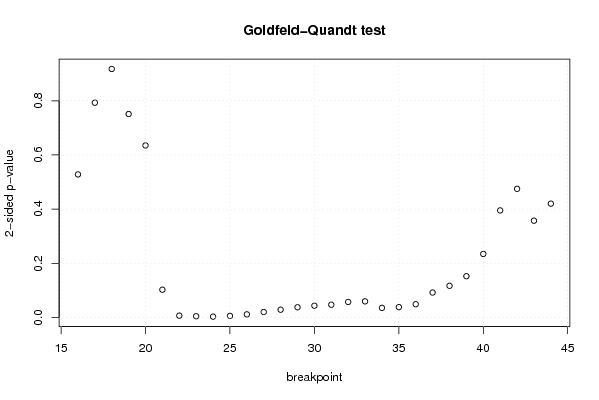
| Goldfeld-Quandt test for Heteroskedasticity | |||
| p-values | Alternative Hypothesis | ||
| breakpoint index | greater | 2-sided | less |
| 16 | 0.73589639937194 | 0.528207201256119 | 0.264103600628059 |
| 17 | 0.603539824719157 | 0.792920350561685 | 0.396460175280843 |
| 18 | 0.458752981488703 | 0.917505962977406 | 0.541247018511297 |
| 19 | 0.375541227317468 | 0.751082454634936 | 0.624458772682532 |
| 20 | 0.682367960220411 | 0.635264079559179 | 0.317632039779589 |
| 21 | 0.94868332322866 | 0.102633353542679 | 0.0513166767713394 |
| 22 | 0.996559451538348 | 0.0068810969233039 | 0.00344054846165195 |
| 23 | 0.997629070347254 | 0.00474185930549153 | 0.00237092965274576 |
| 24 | 0.99838775514341 | 0.00322448971317968 | 0.00161224485658984 |
| 25 | 0.997019279825688 | 0.00596144034862386 | 0.00298072017431193 |
| 26 | 0.99413419584067 | 0.0117316083186604 | 0.00586580415933019 |
| 27 | 0.989852532112003 | 0.0202949357759933 | 0.0101474678879966 |
| 28 | 0.98554748860594 | 0.0289050227881215 | 0.0144525113940608 |
| 29 | 0.981090134390577 | 0.0378197312188465 | 0.0189098656094232 |
| 30 | 0.978179059425586 | 0.0436418811488287 | 0.0218209405744143 |
| 31 | 0.976358851621372 | 0.0472822967572561 | 0.0236411483786281 |
| 32 | 0.971231406979726 | 0.0575371860405482 | 0.0287685930202741 |
| 33 | 0.970107691548494 | 0.0597846169030112 | 0.0298923084515056 |
| 34 | 0.982164009575174 | 0.0356719808496525 | 0.0178359904248263 |
| 35 | 0.980878990040457 | 0.0382420199190857 | 0.0191210099595428 |
| 36 | 0.975431066859627 | 0.0491378662807456 | 0.0245689331403728 |
| 37 | 0.953904334884833 | 0.0921913302303335 | 0.0460956651151668 |
| 38 | 0.941453642718261 | 0.117092714563478 | 0.0585463572817389 |
| 39 | 0.923791785954189 | 0.152416428091622 | 0.0762082140458112 |
| 40 | 0.882686447296683 | 0.234627105406635 | 0.117313552703317 |
| 41 | 0.802323648473791 | 0.395352703052418 | 0.197676351526209 |
| 42 | 0.762456024258438 | 0.475087951483125 | 0.237543975741562 |
| 43 | 0.821297603078206 | 0.357404793843588 | 0.178702396921794 |
| 44 | 0.789858940659552 | 0.420282118680897 | 0.210141059340448 |
| Meta Analysis of Goldfeld-Quandt test for Heteroskedasticity | |||
| Description | # significant tests | % significant tests | OK/NOK |
| 1% type I error level | 4 | 0.137931034482759 | NOK |
| 5% type I error level | 13 | 0.448275862068966 | NOK |
| 10% type I error level | 16 | 0.551724137931034 | NOK |