| Multiple Linear Regression - Estimated Regression Equation |
| Broodprijs[t] = -0.799665390788996 + 4.33374490677863Bakmeelprijs[t] + e[t] |
| Multiple Linear Regression - Ordinary Least Squares | |||||
| Variable | Parameter | S.D. | T-STAT H0: parameter = 0 | 2-tail p-value | 1-tail p-value |
| (Intercept) | -0.799665390788996 | 0.171007 | -4.6762 | 1.8e-05 | 9e-06 |
| Bakmeelprijs | 4.33374490677863 | 0.318424 | 13.61 | 0 | 0 |
| Multiple Linear Regression - Regression Statistics | |
| Multiple R | 0.872665100613162 |
| R-squared | 0.76154437782818 |
| Adjusted R-squared | 0.757433073997631 |
| F-TEST (value) | 185.231841093718 |
| F-TEST (DF numerator) | 1 |
| F-TEST (DF denominator) | 58 |
| p-value | 0 |
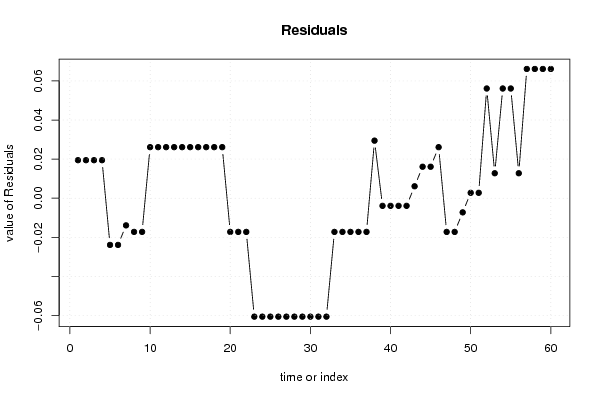
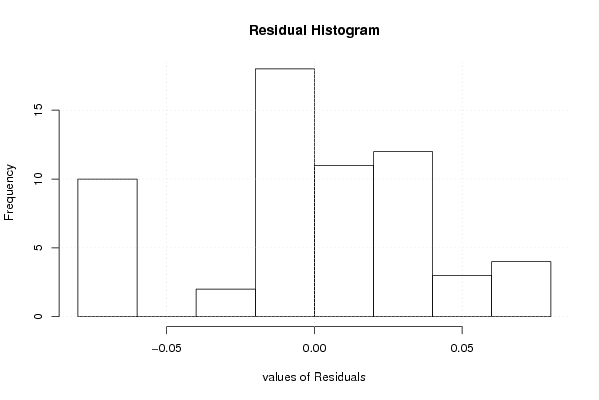
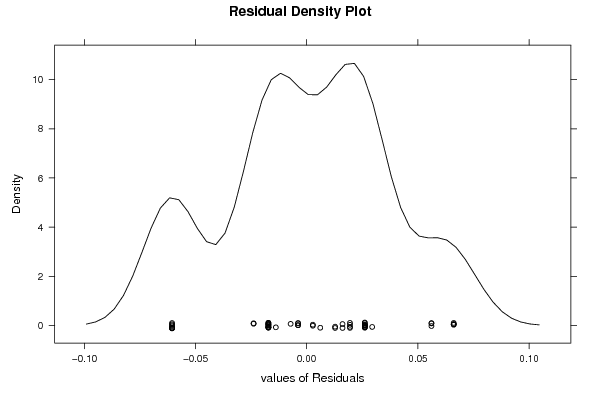
| Multiple Linear Regression - Residual Statistics | |
| Residual Standard Deviation | 0.0369952185155945 |
| Sum Squared Residuals | 0.079381479194962 |
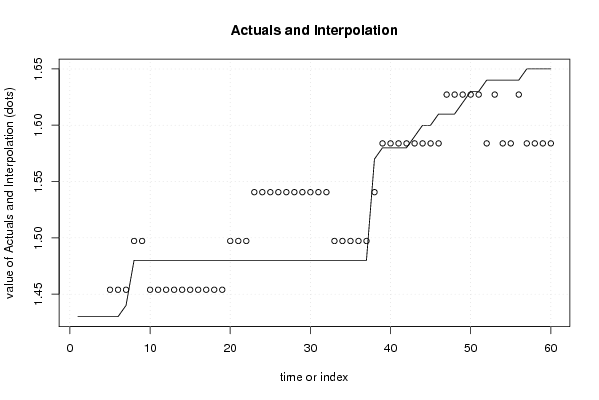
| Multiple Linear Regression - Actuals, Interpolation, and Residuals | |||
| Time or Index | Actuals | Interpolation Forecast | Residuals Prediction Error |
| 1 | 1.43 | 1.41054451166811 | 0.0194554883318857 |
| 2 | 1.43 | 1.41054451166811 | 0.0194554883318930 |
| 3 | 1.43 | 1.41054451166811 | 0.0194554883318934 |
| 4 | 1.43 | 1.41054451166811 | 0.0194554883318934 |
| 5 | 1.43 | 1.45388196073589 | -0.0238819607358929 |
| 6 | 1.43 | 1.45388196073589 | -0.0238819607358929 |
| 7 | 1.44 | 1.45388196073589 | -0.0138819607358929 |
| 8 | 1.48 | 1.49721940980368 | -0.0172194098036792 |
| 9 | 1.48 | 1.49721940980368 | -0.0172194098036792 |
| 10 | 1.48 | 1.45388196073589 | 0.0261180392641071 |
| 11 | 1.48 | 1.45388196073589 | 0.0261180392641071 |
| 12 | 1.48 | 1.45388196073589 | 0.0261180392641071 |
| 13 | 1.48 | 1.45388196073589 | 0.0261180392641071 |
| 14 | 1.48 | 1.45388196073589 | 0.0261180392641071 |
| 15 | 1.48 | 1.45388196073589 | 0.0261180392641071 |
| 16 | 1.48 | 1.45388196073589 | 0.0261180392641071 |
| 17 | 1.48 | 1.45388196073589 | 0.0261180392641071 |
| 18 | 1.48 | 1.45388196073589 | 0.0261180392641071 |
| 19 | 1.48 | 1.45388196073589 | 0.0261180392641071 |
| 20 | 1.48 | 1.49721940980368 | -0.0172194098036792 |
| 21 | 1.48 | 1.49721940980368 | -0.0172194098036792 |
| 22 | 1.48 | 1.49721940980368 | -0.0172194098036792 |
| 23 | 1.48 | 1.54055685887147 | -0.0605568588714655 |
| 24 | 1.48 | 1.54055685887147 | -0.0605568588714655 |
| 25 | 1.48 | 1.54055685887147 | -0.0605568588714655 |
| 26 | 1.48 | 1.54055685887147 | -0.0605568588714655 |
| 27 | 1.48 | 1.54055685887147 | -0.0605568588714655 |
| 28 | 1.48 | 1.54055685887147 | -0.0605568588714655 |
| 29 | 1.48 | 1.54055685887147 | -0.0605568588714655 |
| 30 | 1.48 | 1.54055685887147 | -0.0605568588714655 |
| 31 | 1.48 | 1.54055685887147 | -0.0605568588714655 |
| 32 | 1.48 | 1.54055685887147 | -0.0605568588714655 |
| 33 | 1.48 | 1.49721940980368 | -0.0172194098036792 |
| 34 | 1.48 | 1.49721940980368 | -0.0172194098036792 |
| 35 | 1.48 | 1.49721940980368 | -0.0172194098036792 |
| 36 | 1.48 | 1.49721940980368 | -0.0172194098036792 |
| 37 | 1.48 | 1.49721940980368 | -0.0172194098036792 |
| 38 | 1.57 | 1.54055685887147 | 0.0294431411285346 |
| 39 | 1.58 | 1.58389430793925 | -0.00389430793925175 |
| 40 | 1.58 | 1.58389430793925 | -0.00389430793925175 |
| 41 | 1.58 | 1.58389430793925 | -0.00389430793925175 |
| 42 | 1.58 | 1.58389430793925 | -0.00389430793925175 |
| 43 | 1.59 | 1.58389430793925 | 0.00610569206074826 |
| 44 | 1.6 | 1.58389430793925 | 0.0161056920607483 |
| 45 | 1.6 | 1.58389430793925 | 0.0161056920607483 |
| 46 | 1.61 | 1.58389430793925 | 0.0261056920607483 |
| 47 | 1.61 | 1.62723175700704 | -0.0172317570070380 |
| 48 | 1.61 | 1.62723175700704 | -0.0172317570070380 |
| 49 | 1.62 | 1.62723175700704 | -0.00723175700703803 |
| 50 | 1.63 | 1.62723175700704 | 0.00276824299296176 |
| 51 | 1.63 | 1.62723175700704 | 0.00276824299296176 |
| 52 | 1.64 | 1.58389430793925 | 0.0561056920607481 |
| 53 | 1.64 | 1.62723175700704 | 0.0127682429929618 |
| 54 | 1.64 | 1.58389430793925 | 0.0561056920607481 |
| 55 | 1.64 | 1.58389430793925 | 0.0561056920607481 |
| 56 | 1.64 | 1.62723175700704 | 0.0127682429929618 |
| 57 | 1.65 | 1.58389430793925 | 0.0661056920607481 |
| 58 | 1.65 | 1.58389430793925 | 0.0661056920607481 |
| 59 | 1.65 | 1.58389430793925 | 0.0661056920607481 |
| 60 | 1.65 | 1.58389430793925 | 0.0661056920607481 |
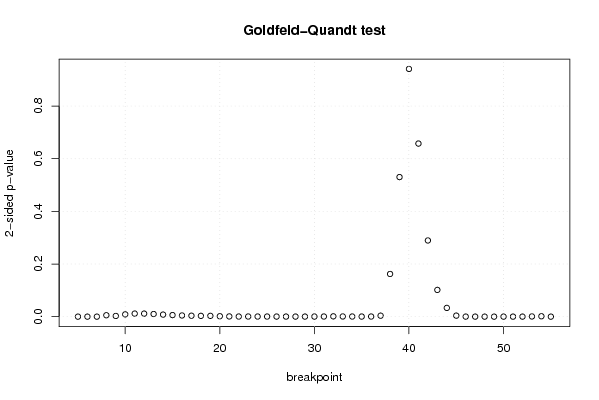
| Goldfeld-Quandt test for Heteroskedasticity | |||
| p-values | Alternative Hypothesis | ||
| breakpoint index | greater | 2-sided | less |
| 5 | 3.87809722182447e-43 | 7.75619444364894e-43 | 1 |
| 6 | 2.9509596315842e-57 | 5.9019192631684e-57 | 1 |
| 7 | 2.34628318179399e-05 | 4.69256636358798e-05 | 0.999976537168182 |
| 8 | 0.00266678037503573 | 0.00533356075007146 | 0.997333219624964 |
| 9 | 0.00132467439023061 | 0.00264934878046122 | 0.99867532560977 |
| 10 | 0.00435640286759149 | 0.00871280573518298 | 0.995643597132408 |
| 11 | 0.00581996243685427 | 0.0116399248737085 | 0.994180037563146 |
| 12 | 0.00575872637859902 | 0.0115174527571980 | 0.994241273621401 |
| 13 | 0.00493483165616793 | 0.00986966331233585 | 0.995065168343832 |
| 14 | 0.00391269541033363 | 0.00782539082066727 | 0.996087304589666 |
| 15 | 0.00298451177964293 | 0.00596902355928586 | 0.997015488220357 |
| 16 | 0.00226121308412699 | 0.00452242616825399 | 0.997738786915873 |
| 17 | 0.00176380365653319 | 0.00352760731306637 | 0.998236196343467 |
| 18 | 0.00149152660771334 | 0.00298305321542667 | 0.998508473392287 |
| 19 | 0.00149590927221329 | 0.00299181854442658 | 0.998504090727787 |
| 20 | 0.000829121719615177 | 0.00165824343923035 | 0.999170878280385 |
| 21 | 0.000430609055176752 | 0.000861218110353505 | 0.999569390944823 |
| 22 | 0.000214341723004837 | 0.000428683446009675 | 0.999785658276995 |
| 23 | 0.000268366294626426 | 0.000536732589252853 | 0.999731633705374 |
| 24 | 0.000239495787454188 | 0.000478991574908376 | 0.999760504212546 |
| 25 | 0.000194810394255097 | 0.000389620788510195 | 0.999805189605745 |
| 26 | 0.000157444449036668 | 0.000314888898073337 | 0.999842555550963 |
| 27 | 0.000132769845537928 | 0.000265539691075855 | 0.999867230154462 |
| 28 | 0.000121662719489014 | 0.000243325438978027 | 0.999878337280511 |
| 29 | 0.000126544327395977 | 0.000253088654791955 | 0.999873455672604 |
| 30 | 0.000157771970800566 | 0.000315543941601131 | 0.9998422280292 |
| 31 | 0.000254014080982601 | 0.000508028161965202 | 0.999745985919017 |
| 32 | 0.000588265807509683 | 0.00117653161501937 | 0.99941173419249 |
| 33 | 0.000359292761615733 | 0.000718585523231467 | 0.999640707238384 |
| 34 | 0.000234855976478907 | 0.000469711952957813 | 0.999765144023521 |
| 35 | 0.000181558850937985 | 0.000363117701875970 | 0.999818441149062 |
| 36 | 0.000223499809986715 | 0.000446999619973429 | 0.999776500190013 |
| 37 | 0.00185270601742747 | 0.00370541203485494 | 0.998147293982573 |
| 38 | 0.0810689362989787 | 0.162137872597957 | 0.918931063701021 |
| 39 | 0.265136424321379 | 0.530272848642759 | 0.73486357567862 |
| 40 | 0.470530099916091 | 0.941060199832182 | 0.529469900083909 |
| 41 | 0.671191464576196 | 0.657617070847607 | 0.328808535423804 |
| 42 | 0.855259499350093 | 0.289481001299814 | 0.144740500649907 |
| 43 | 0.949181829965576 | 0.101636340068848 | 0.0508181700344241 |
| 44 | 0.983395145465249 | 0.0332097090695022 | 0.0166048545347511 |
| 45 | 0.998069052569961 | 0.00386189486007740 | 0.00193094743003870 |
| 46 | 0.99990701040552 | 0.000185979188961044 | 9.29895944805221e-05 |
| 47 | 0.999933652561918 | 0.000132694876164707 | 6.63474380823537e-05 |
| 48 | 0.99998853282455 | 2.29343508989433e-05 | 1.14671754494716e-05 |
| 49 | 0.999994593162615 | 1.08136747693225e-05 | 5.40683738466127e-06 |
| 50 | 0.999983746285248 | 3.25074295048613e-05 | 1.62537147524307e-05 |
| 51 | 0.999972244670005 | 5.5510659990631e-05 | 2.77553299953155e-05 |
| 52 | 0.999942042837733 | 0.000115914324532931 | 5.79571622664656e-05 |
| 53 | 0.99962129976882 | 0.000757400462360212 | 0.000378700231180106 |
| 54 | 0.999261053091167 | 0.00147789381766683 | 0.000738946908833416 |
| 55 | 1 | 0 | 0 |
| Meta Analysis of Goldfeld-Quandt test for Heteroskedasticity | |||
| Description | # significant tests | % significant tests | OK/NOK |
| 1% type I error level | 42 | 0.823529411764706 | NOK |
| 5% type I error level | 45 | 0.88235294117647 | NOK |
| 10% type I error level | 45 | 0.88235294117647 | NOK |