| Multiple Linear Regression - Estimated Regression Equation |
| Y[t] = + 103.383194533056 + 25.3980395469445X[t] -11.9519519732223M1[t] -7.33695962722222M2[t] -8.60218710461113M3[t] -5.19122898000001M4[t] -21.800102M5[t] -4.97138650461111M6[t] -10.6623604786111M7[t] -11.0091223346111M8[t] + 2.50439116738889M9[t] -12.59051504M10[t] -5.32324779461111M11[t] + e[t] |
| Multiple Linear Regression - Ordinary Least Squares | |||||
| Variable | Parameter | S.D. | T-STAT H0: parameter = 0 | 2-tail p-value | 1-tail p-value |
| (Intercept) | 103.383194533056 | 7.422665 | 13.928 | 0 | 0 |
| X | 25.3980395469445 | 4.751874 | 5.3448 | 3e-06 | 1e-06 |
| M1 | -11.9519519732223 | 8.285176 | -1.4426 | 0.155773 | 0.077886 |
| M2 | -7.33695962722222 | 8.285176 | -0.8856 | 0.380367 | 0.190184 |
| M3 | -8.60218710461113 | 8.120006 | -1.0594 | 0.29484 | 0.14742 |
| M4 | -5.19122898000001 | 8.064198 | -0.6437 | 0.522874 | 0.261437 |
| M5 | -21.800102 | 8.064198 | -2.7033 | 0.009525 | 0.004763 |
| M6 | -4.97138650461111 | 8.120006 | -0.6122 | 0.54333 | 0.271665 |
| M7 | -10.6623604786111 | 8.120006 | -1.3131 | 0.195525 | 0.097763 |
| M8 | -11.0091223346111 | 8.120006 | -1.3558 | 0.181641 | 0.090821 |
| M9 | 2.50439116738889 | 8.120006 | 0.3084 | 0.759124 | 0.379562 |
| M10 | -12.59051504 | 8.064198 | -1.5613 | 0.125165 | 0.062583 |
| M11 | -5.32324779461111 | 8.120006 | -0.6556 | 0.515296 | 0.257648 |
| Multiple Linear Regression - Regression Statistics | |
| Multiple R | 0.700889678005733 |
| R-squared | 0.49124634073498 |
| Adjusted R-squared | 0.361351789433272 |
| F-TEST (value) | 3.78188565888308 |
| F-TEST (DF numerator) | 12 |
| F-TEST (DF denominator) | 47 |
| p-value | 0.000490109125249605 |
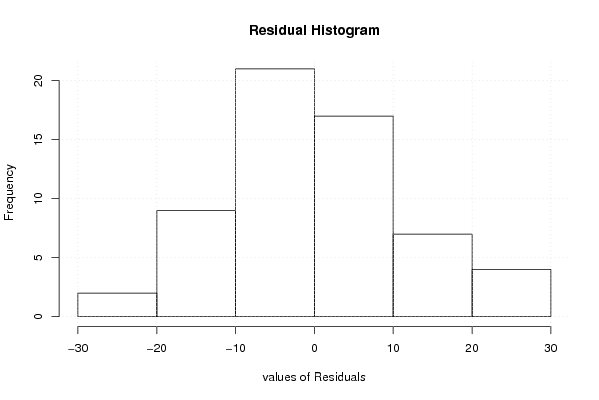
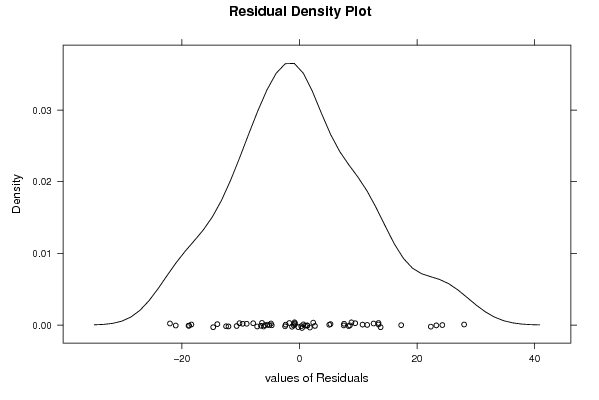
| Multiple Linear Regression - Residual Statistics | |
| Residual Standard Deviation | 12.7506163904545 |
| Sum Squared Residuals | 7641.17626181678 |
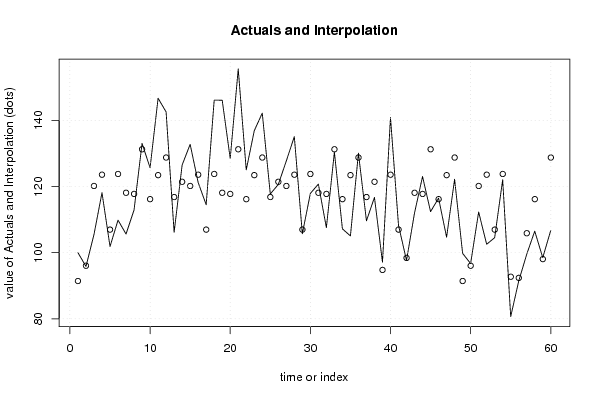
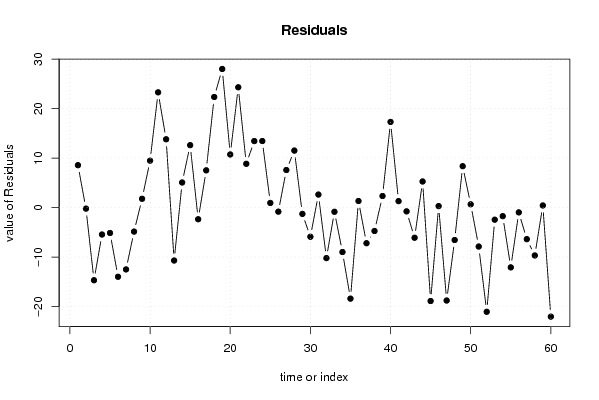
| Multiple Linear Regression - Actuals, Interpolation, and Residuals | |||
| Time or Index | Actuals | Interpolation Forecast | Residuals Prediction Error |
| 1 | 100 | 91.4312425598335 | 8.5687574401665 |
| 2 | 95.84395716 | 96.0462349058333 | -0.202277745833311 |
| 3 | 105.5073942 | 120.179046975389 | -14.6716527753889 |
| 4 | 118.1540031 | 123.5900051 | -5.436002 |
| 5 | 101.8612953 | 106.98113208 | -5.11983677999997 |
| 6 | 109.8419174 | 123.809847575389 | -13.9679301753889 |
| 7 | 105.6348802 | 118.118873601389 | -12.4839934013889 |
| 8 | 112.927078 | 117.772111745389 | -4.84503374538888 |
| 9 | 133.0698623 | 131.285625247389 | 1.78423705261114 |
| 10 | 125.6756757 | 116.19071904 | 9.48495666000002 |
| 11 | 146.736359 | 123.457986285389 | 23.2783727146111 |
| 12 | 142.5803162 | 128.78123408 | 13.7990821200000 |
| 13 | 106.1448241 | 116.829282106778 | -10.6844580067777 |
| 14 | 126.5170831 | 121.444274452778 | 5.07280864722221 |
| 15 | 132.7893932 | 120.179046975389 | 12.6103462246111 |
| 16 | 121.2391637 | 123.5900051 | -2.35084139999999 |
| 17 | 114.5079041 | 106.98113208 | 7.52677202 |
| 18 | 146.1499235 | 123.809847575389 | 22.3400759246111 |
| 19 | 146.1244263 | 118.118873601389 | 28.0055526986111 |
| 20 | 128.5058644 | 117.772111745389 | 10.7337526546111 |
| 21 | 155.5838858 | 131.285625247389 | 24.2982605526111 |
| 22 | 125.0382458 | 116.19071904 | 8.84752676 |
| 23 | 136.8944416 | 123.457986285389 | 13.4364553146111 |
| 24 | 142.2233554 | 128.78123408 | 13.44212132 |
| 25 | 117.7715451 | 116.829282106778 | 0.942262993222257 |
| 26 | 120.627231 | 121.444274452778 | -0.817043452777788 |
| 27 | 127.7664457 | 120.179046975389 | 7.58739872461112 |
| 28 | 135.1096379 | 123.5900051 | 11.5196328 |
| 29 | 105.7113717 | 106.98113208 | -1.26976038000000 |
| 30 | 117.9245283 | 123.809847575389 | -5.88531927538889 |
| 31 | 120.754717 | 118.118873601389 | 2.6358433986111 |
| 32 | 107.572667 | 117.772111745389 | -10.1994447453889 |
| 33 | 130.4436512 | 131.285625247389 | -0.841974047388886 |
| 34 | 107.2157063 | 116.19071904 | -8.97501274000001 |
| 35 | 105.0739419 | 123.457986285389 | -18.3840443853889 |
| 36 | 130.1121877 | 128.78123408 | 1.33095361999999 |
| 37 | 109.6379398 | 116.829282106778 | -7.19134230677774 |
| 38 | 116.7261601 | 121.444274452778 | -4.71811435277778 |
| 39 | 97.11881693 | 94.7810074284444 | 2.33780950155557 |
| 40 | 140.8975013 | 123.5900051 | 17.3074962 |
| 41 | 108.2865885 | 106.98113208 | 1.30545641999999 |
| 42 | 97.65425803 | 98.4118080284444 | -0.757549998444434 |
| 43 | 112.0346762 | 118.118873601389 | -6.08419740138889 |
| 44 | 123.0494646 | 117.772111745389 | 5.2773528546111 |
| 45 | 112.4171341 | 131.285625247389 | -18.8684911473889 |
| 46 | 116.4966854 | 116.19071904 | 0.305966360000001 |
| 47 | 104.6914839 | 123.457986285389 | -18.7665023853889 |
| 48 | 122.2335543 | 128.78123408 | -6.54767978000001 |
| 49 | 99.79602244 | 91.4312425598333 | 8.36477988016673 |
| 50 | 96.71086181 | 96.0462349058333 | 0.664626904166679 |
| 51 | 112.3151453 | 120.179046975389 | -7.86390167538889 |
| 52 | 102.5497195 | 123.5900051 | -21.0402856 |
| 53 | 104.5385008 | 106.98113208 | -2.44263128000001 |
| 54 | 122.0805711 | 123.809847575389 | -1.72927647538890 |
| 55 | 80.64762876 | 92.7208340544444 | -12.0732052944444 |
| 56 | 91.40744518 | 92.3740721984444 | -0.966627018444427 |
| 57 | 99.51555329 | 105.887585700444 | -6.37203241044442 |
| 58 | 106.527282 | 116.19071904 | -9.66343704 |
| 59 | 98.49566548 | 98.0599467384444 | 0.435718741555576 |
| 60 | 106.7567568 | 128.78123408 | -22.02447728 |
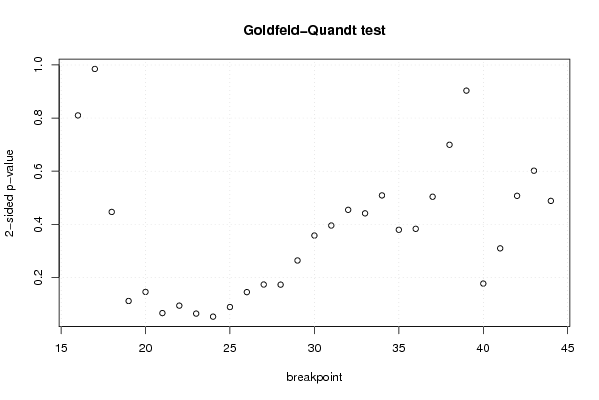
| Goldfeld-Quandt test for Heteroskedasticity | |||
| p-values | Alternative Hypothesis | ||
| breakpoint index | greater | 2-sided | less |
| 16 | 0.594949849927688 | 0.810100300144623 | 0.405050150072312 |
| 17 | 0.492496357067971 | 0.984992714135943 | 0.507503642932029 |
| 18 | 0.77666262533138 | 0.44667474933724 | 0.22333737466862 |
| 19 | 0.944301637559277 | 0.111396724881446 | 0.055698362440723 |
| 20 | 0.927217396528094 | 0.145565206943812 | 0.0727826034719059 |
| 21 | 0.967081791740485 | 0.0658364165190301 | 0.0329182082595150 |
| 22 | 0.953087572762044 | 0.093824854475913 | 0.0469124272379565 |
| 23 | 0.968044488099713 | 0.0639110238005738 | 0.0319555119002869 |
| 24 | 0.97379443843920 | 0.0524111231215985 | 0.0262055615607992 |
| 25 | 0.955695348943648 | 0.0886093021127034 | 0.0443046510563517 |
| 26 | 0.927631238181818 | 0.144737523636364 | 0.0723687618181819 |
| 27 | 0.91330213914412 | 0.173395721711760 | 0.0866978608558802 |
| 28 | 0.913578570672558 | 0.172842858654885 | 0.0864214293274425 |
| 29 | 0.868053996828366 | 0.263892006343268 | 0.131946003171634 |
| 30 | 0.821116195183794 | 0.357767609632412 | 0.178883804816206 |
| 31 | 0.802244469340347 | 0.395511061319305 | 0.197755530659653 |
| 32 | 0.772711125744375 | 0.454577748511251 | 0.227288874255625 |
| 33 | 0.779319097926239 | 0.441361804147522 | 0.220680902073761 |
| 34 | 0.745566740058642 | 0.508866519882715 | 0.254433259941358 |
| 35 | 0.81026436976723 | 0.379471260465539 | 0.189735630232769 |
| 36 | 0.808465055523225 | 0.383069888953551 | 0.191534944476775 |
| 37 | 0.748063010851904 | 0.503873978296192 | 0.251936989148096 |
| 38 | 0.650223267793376 | 0.699553464413248 | 0.349776732206624 |
| 39 | 0.5483229644695 | 0.903354071061 | 0.4516770355305 |
| 40 | 0.911553620355287 | 0.176892759289427 | 0.0884463796447134 |
| 41 | 0.845193106663552 | 0.309613786672896 | 0.154806893336448 |
| 42 | 0.746371062184199 | 0.507257875631601 | 0.253628937815801 |
| 43 | 0.699043094793905 | 0.601913810412191 | 0.300956905206095 |
| 44 | 0.755852097940665 | 0.48829580411867 | 0.244147902059335 |
| Meta Analysis of Goldfeld-Quandt test for Heteroskedasticity | |||
| Description | # significant tests | % significant tests | OK/NOK |
| 1% type I error level | 0 | 0 | OK |
| 5% type I error level | 0 | 0 | OK |
| 10% type I error level | 5 | 0.172413793103448 | NOK |