Free Statistics

of Irreproducible Research!

Author's title

Author*The author of this computation has been verified*
R Software Modulerwasp_multipleregression.wasp
Title produced by softwareMultiple Regression
Date of computationFri, 20 Nov 2009 05:13:23 -0700
Cite this page as followsStatistical Computations at FreeStatistics.org, Office for Research Development and Education, URL https://freestatistics.org/blog/index.php?v=date/2009/Nov/20/t1258719317t9ow1wpyne8frx0.htm/, Retrieved Fri, 19 Apr 2024 16:23:31 +0000
Statistical Computations at FreeStatistics.org, Office for Research Development and Education, URL https://freestatistics.org/blog/index.php?pk=58069, Retrieved Fri, 19 Apr 2024 16:23:31 +0000
QR Codes:

Original text written by user:
IsPrivate?No (this computation is public)
User-defined keywords
Estimated Impact158
Family? (F = Feedback message, R = changed R code, M = changed R Module, P = changed Parameters, D = changed Data)
-     [Multiple Regression] [Q1 The Seatbeltlaw] [2007-11-14 19:27:43] [8cd6641b921d30ebe00b648d1481bba0]
- RM D  [Multiple Regression] [Seatbelt] [2009-11-12 14:06:21] [b98453cac15ba1066b407e146608df68]
F    D      [Multiple Regression] [ws7777] [2009-11-20 12:13:23] [9a1fef436e1d399a5ecd6808bfbd8489] [Current]
-    D        [Multiple Regression] [w7] [2009-11-22 13:32:33] [0a7d38ad9c7f1a2c46637c75a8a0e083]
-    D          [Multiple Regression] [verbetering] [2009-11-27 09:27:31] [f5d341d4bbba73282fc6e80153a6d315]
Feedback Forum
2009-11-25 19:26:48 [Nick Aerts] [reply
Model1: http://www.freestatistics.org/blog/index.php?v=date/2009/Nov/25/t1259174661rk8ftst492o9qga.htm/

Model2:http://www.freestatistics.org/blog/index.php?v=date/2009/Nov/25/t1259170139ejbxbdrwasqhwp2.htm/

Voor meer uitleg over model 1 en model 2 ga ja naar de respectievelijke links in je compendium.

Model3: http://www.freestatistics.org/blog/index.php?v=date/2009/Nov/25/t1259171201rxzeiixgpinoanm.htm/

Analyse van de cijfergegevens:
De economische groei zorgt voor een daling van het percentage werkloze mannen met 0,02. De gekozen Yt-1 en Yt-2 zijn significant omdat de alfa-fout (p-waarde 1-tail) bijna gelijk is aan 0. Ook de andere gegevens zijn significant gebleven.
We zullen dus de nulhypothese verwerpen. Om te weten hoeveel schommelingen van dit model kunnen bepaald worden bekijken we de adjusted R².
R² = 87,0%; Deze waarde is significant want de p-waarde is 0.
De standaardfout is: 0,23.
We kunnen nu al heel wat meer schommelingen verklaren en onze standaardfout wordt kleiner.

Analyse van de grafieken:
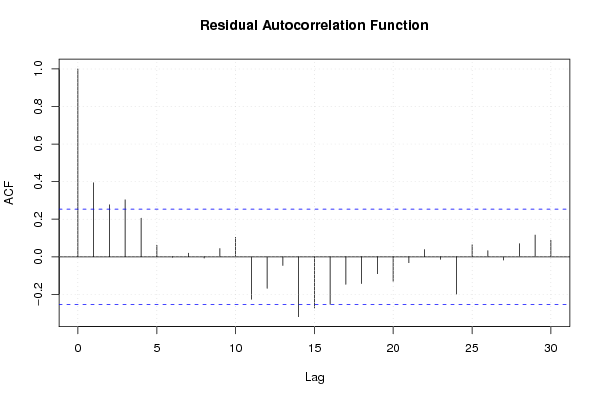
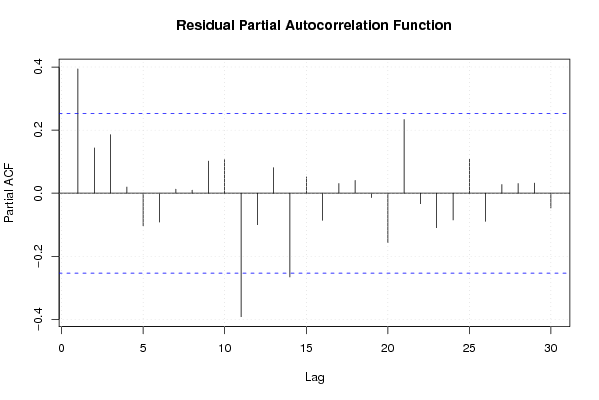
We zien in de autocorrelatiefunctie dat er nog maar twee waarden boven het betrouwbaarheidsinterval van 95% liggen. Omdat er 5 van de 100 buiten dit interval mogen liggen is er geen probleem. Er is mogelijk nog kans op seizoenaliteit want deze waarden komen voor op lag 6 en lag 12.

Daarom haal ik de seizoenaliteit nog uit de functie. Dit is te zien in deze link: http://www.freestatistics.org/blog/index.php?v=date/2009/Nov/25/t1259171886bgqs03q5ujwq8sh.htm/

We zien hier dat de p-waarden voor de maanden zeer hoog zijn. We kunnen dus de seizoenaliteit niet gebruiken om het model te bepalen.

Post a new message
Dataseries X:
100	0
95.84395716	0
105.5073942	1
118.1540031	1
101.8612953	1
109.8419174	1
105.6348802	1
112.927078	1
133.0698623	1
125.6756757	1
146.736359	1
142.5803162	1
106.1448241	1
126.5170831	1
132.7893932	1
121.2391637	1
114.5079041	1
146.1499235	1
146.1244263	1
128.5058644	1
155.5838858	1
125.0382458	1
136.8944416	1
142.2233554	1
117.7715451	1
120.627231	1
127.7664457	1
135.1096379	1
105.7113717	1
117.9245283	1
120.754717	1
107.572667	1
130.4436512	1
107.2157063	1
105.0739419	1
130.1121877	1
109.6379398	1
116.7261601	1
97.11881693	0
140.8975013	1
108.2865885	1
97.65425803	0
112.0346762	1
123.0494646	1
112.4171341	1
116.4966854	1
104.6914839	1
122.2335543	1
99.79602244	0
96.71086181	0
112.3151453	1
102.5497195	1
104.5385008	1
122.0805711	1
80.64762876	0
91.40744518	0
99.51555329	0
106.527282	1
98.49566548	0
106.7567568	1


Summary of computational transaction
Raw Inputview raw input (R code)
Raw Outputview raw output of R engine
Computing time3 seconds
R Server'Gwilym Jenkins' @ 72.249.127.135

\begin{tabular}{lllllllll}
\hline
Summary of computational transaction \tabularnewline
Raw Input & view raw input (R code)  \tabularnewline
Raw Output & view raw output of R engine  \tabularnewline
Computing time & 3 seconds \tabularnewline
R Server & 'Gwilym Jenkins' @ 72.249.127.135 \tabularnewline
\hline
\end{tabular}
%Source: https://freestatistics.org/blog/index.php?pk=58069&T=0

[TABLE]
[ROW][C]Summary of computational transaction[/C][/ROW]
[ROW][C]Raw Input[/C][C]view raw input (R code) [/C][/ROW]
[ROW][C]Raw Output[/C][C]view raw output of R engine [/C][/ROW]
[ROW][C]Computing time[/C][C]3 seconds[/C][/ROW]
[ROW][C]R Server[/C][C]'Gwilym Jenkins' @ 72.249.127.135[/C][/ROW]
[/TABLE]
Source: https://freestatistics.org/blog/index.php?pk=58069&T=0

Globally Unique Identifier (entire table): ba.freestatistics.org/blog/index.php?pk=58069&T=0

As an alternative you can also use a QR Code:  

The GUIDs for individual cells are displayed in the table below:

Summary of computational transaction
Raw Inputview raw input (R code)
Raw Outputview raw output of R engine
Computing time3 seconds
R Server'Gwilym Jenkins' @ 72.249.127.135


Multiple Linear Regression - Estimated Regression Equation
Y[t] = + 116.597165706393 + 21.2164030996859X[t] -16.3844866073163M1[t] -11.5185960744808M2[t] -11.6965980755825M3[t] -7.19841447468412M4[t] -23.5563893078486M5[t] -7.31310291507592M6[t] -12.7531787022404M7[t] -12.8490423714049M8[t] + 0.915369317430634M9[t] -13.0923114136710M10[t] -6.41047327089834M11[t] -0.250898186835515t + e[t]

\begin{tabular}{lllllllll}
\hline
Multiple Linear Regression - Estimated Regression Equation \tabularnewline
Y[t] =  +  116.597165706393 +  21.2164030996859X[t] -16.3844866073163M1[t] -11.5185960744808M2[t] -11.6965980755825M3[t] -7.19841447468412M4[t] -23.5563893078486M5[t] -7.31310291507592M6[t] -12.7531787022404M7[t] -12.8490423714049M8[t] +  0.915369317430634M9[t] -13.0923114136710M10[t] -6.41047327089834M11[t] -0.250898186835515t  + e[t] \tabularnewline
\hline
\end{tabular}
%Source: https://freestatistics.org/blog/index.php?pk=58069&T=1

[TABLE]
[ROW][C]Multiple Linear Regression - Estimated Regression Equation[/C][/ROW]
[ROW][C]Y[t] =  +  116.597165706393 +  21.2164030996859X[t] -16.3844866073163M1[t] -11.5185960744808M2[t] -11.6965980755825M3[t] -7.19841447468412M4[t] -23.5563893078486M5[t] -7.31310291507592M6[t] -12.7531787022404M7[t] -12.8490423714049M8[t] +  0.915369317430634M9[t] -13.0923114136710M10[t] -6.41047327089834M11[t] -0.250898186835515t  + e[t][/C][/ROW]
[/TABLE]
Source: https://freestatistics.org/blog/index.php?pk=58069&T=1

Globally Unique Identifier (entire table): ba.freestatistics.org/blog/index.php?pk=58069&T=1

As an alternative you can also use a QR Code:  

The GUIDs for individual cells are displayed in the table below:

Multiple Linear Regression - Estimated Regression Equation
Y[t] = + 116.597165706393 + 21.2164030996859X[t] -16.3844866073163M1[t] -11.5185960744808M2[t] -11.6965980755825M3[t] -7.19841447468412M4[t] -23.5563893078486M5[t] -7.31310291507592M6[t] -12.7531787022404M7[t] -12.8490423714049M8[t] + 0.915369317430634M9[t] -13.0923114136710M10[t] -6.41047327089834M11[t] -0.250898186835515t + e[t]


Multiple Linear Regression - Ordinary Least Squares
VariableParameterS.D.T-STATH0: parameter = 02-tail p-value1-tail p-value
(Intercept)116.5971657063938.69286913.41300
X21.21640309968594.7756294.44265.5e-052.8e-05
M1-16.38448660731638.017077-2.04370.0467340.023367
M2-11.51859607448087.996703-1.44040.1565210.078261
M3-11.69659807558257.767435-1.50590.1389420.069471
M4-7.198414474684127.660879-0.93960.3523140.176157
M5-23.55638930784867.65157-3.07860.0035010.00175
M6-7.313102915075927.727571-0.94640.3489070.174454
M7-12.75317870224047.716701-1.65270.1052080.052604
M8-12.84904237140497.707049-1.66720.1022740.051137
M90.9153693174306347.6986190.11890.9058720.452936
M10-13.09231141367107.623575-1.71730.0926430.046321
M11-6.410473270898347.685441-0.83410.4085320.204266
t-0.2508981868355150.097482-2.57380.0133460.006673

\begin{tabular}{lllllllll}
\hline
Multiple Linear Regression - Ordinary Least Squares \tabularnewline
Variable & Parameter & S.D. & T-STATH0: parameter = 0 & 2-tail p-value & 1-tail p-value \tabularnewline
(Intercept) & 116.597165706393 & 8.692869 & 13.413 & 0 & 0 \tabularnewline
X & 21.2164030996859 & 4.775629 & 4.4426 & 5.5e-05 & 2.8e-05 \tabularnewline
M1 & -16.3844866073163 & 8.017077 & -2.0437 & 0.046734 & 0.023367 \tabularnewline
M2 & -11.5185960744808 & 7.996703 & -1.4404 & 0.156521 & 0.078261 \tabularnewline
M3 & -11.6965980755825 & 7.767435 & -1.5059 & 0.138942 & 0.069471 \tabularnewline
M4 & -7.19841447468412 & 7.660879 & -0.9396 & 0.352314 & 0.176157 \tabularnewline
M5 & -23.5563893078486 & 7.65157 & -3.0786 & 0.003501 & 0.00175 \tabularnewline
M6 & -7.31310291507592 & 7.727571 & -0.9464 & 0.348907 & 0.174454 \tabularnewline
M7 & -12.7531787022404 & 7.716701 & -1.6527 & 0.105208 & 0.052604 \tabularnewline
M8 & -12.8490423714049 & 7.707049 & -1.6672 & 0.102274 & 0.051137 \tabularnewline
M9 & 0.915369317430634 & 7.698619 & 0.1189 & 0.905872 & 0.452936 \tabularnewline
M10 & -13.0923114136710 & 7.623575 & -1.7173 & 0.092643 & 0.046321 \tabularnewline
M11 & -6.41047327089834 & 7.685441 & -0.8341 & 0.408532 & 0.204266 \tabularnewline
t & -0.250898186835515 & 0.097482 & -2.5738 & 0.013346 & 0.006673 \tabularnewline
\hline
\end{tabular}
%Source: https://freestatistics.org/blog/index.php?pk=58069&T=2

[TABLE]
[ROW][C]Multiple Linear Regression - Ordinary Least Squares[/C][/ROW]
[ROW][C]Variable[/C][C]Parameter[/C][C]S.D.[/C][C]T-STATH0: parameter = 0[/C][C]2-tail p-value[/C][C]1-tail p-value[/C][/ROW]
[ROW][C](Intercept)[/C][C]116.597165706393[/C][C]8.692869[/C][C]13.413[/C][C]0[/C][C]0[/C][/ROW]
[ROW][C]X[/C][C]21.2164030996859[/C][C]4.775629[/C][C]4.4426[/C][C]5.5e-05[/C][C]2.8e-05[/C][/ROW]
[ROW][C]M1[/C][C]-16.3844866073163[/C][C]8.017077[/C][C]-2.0437[/C][C]0.046734[/C][C]0.023367[/C][/ROW]
[ROW][C]M2[/C][C]-11.5185960744808[/C][C]7.996703[/C][C]-1.4404[/C][C]0.156521[/C][C]0.078261[/C][/ROW]
[ROW][C]M3[/C][C]-11.6965980755825[/C][C]7.767435[/C][C]-1.5059[/C][C]0.138942[/C][C]0.069471[/C][/ROW]
[ROW][C]M4[/C][C]-7.19841447468412[/C][C]7.660879[/C][C]-0.9396[/C][C]0.352314[/C][C]0.176157[/C][/ROW]
[ROW][C]M5[/C][C]-23.5563893078486[/C][C]7.65157[/C][C]-3.0786[/C][C]0.003501[/C][C]0.00175[/C][/ROW]
[ROW][C]M6[/C][C]-7.31310291507592[/C][C]7.727571[/C][C]-0.9464[/C][C]0.348907[/C][C]0.174454[/C][/ROW]
[ROW][C]M7[/C][C]-12.7531787022404[/C][C]7.716701[/C][C]-1.6527[/C][C]0.105208[/C][C]0.052604[/C][/ROW]
[ROW][C]M8[/C][C]-12.8490423714049[/C][C]7.707049[/C][C]-1.6672[/C][C]0.102274[/C][C]0.051137[/C][/ROW]
[ROW][C]M9[/C][C]0.915369317430634[/C][C]7.698619[/C][C]0.1189[/C][C]0.905872[/C][C]0.452936[/C][/ROW]
[ROW][C]M10[/C][C]-13.0923114136710[/C][C]7.623575[/C][C]-1.7173[/C][C]0.092643[/C][C]0.046321[/C][/ROW]
[ROW][C]M11[/C][C]-6.41047327089834[/C][C]7.685441[/C][C]-0.8341[/C][C]0.408532[/C][C]0.204266[/C][/ROW]
[ROW][C]t[/C][C]-0.250898186835515[/C][C]0.097482[/C][C]-2.5738[/C][C]0.013346[/C][C]0.006673[/C][/ROW]
[/TABLE]
Source: https://freestatistics.org/blog/index.php?pk=58069&T=2

Globally Unique Identifier (entire table): ba.freestatistics.org/blog/index.php?pk=58069&T=2

As an alternative you can also use a QR Code:  

The GUIDs for individual cells are displayed in the table below:

Multiple Linear Regression - Ordinary Least Squares
VariableParameterS.D.T-STATH0: parameter = 02-tail p-value1-tail p-value
(Intercept)116.5971657063938.69286913.41300
X21.21640309968594.7756294.44265.5e-052.8e-05
M1-16.38448660731638.017077-2.04370.0467340.023367
M2-11.51859607448087.996703-1.44040.1565210.078261
M3-11.69659807558257.767435-1.50590.1389420.069471
M4-7.198414474684127.660879-0.93960.3523140.176157
M5-23.55638930784867.65157-3.07860.0035010.00175
M6-7.313102915075927.727571-0.94640.3489070.174454
M7-12.75317870224047.716701-1.65270.1052080.052604
M8-12.84904237140497.707049-1.66720.1022740.051137
M90.9153693174306347.6986190.11890.9058720.452936
M10-13.09231141367107.623575-1.71730.0926430.046321
M11-6.410473270898347.685441-0.83410.4085320.204266
t-0.2508981868355150.097482-2.57380.0133460.006673


Multiple Linear Regression - Regression Statistics
Multiple R0.745176801073555
R-squared0.555288464858216
Adjusted R-squared0.429609117970321
F-TEST (value)4.4182952776921
F-TEST (DF numerator)13
F-TEST (DF denominator)46
p-value8.43903345039143e-05
Multiple Linear Regression - Residual Statistics
Residual Standard Deviation12.0499880817301
Sum Squared Residuals6679.3017874125

\begin{tabular}{lllllllll}
\hline
Multiple Linear Regression - Regression Statistics \tabularnewline
Multiple R & 0.745176801073555 \tabularnewline
R-squared & 0.555288464858216 \tabularnewline
Adjusted R-squared & 0.429609117970321 \tabularnewline
F-TEST (value) & 4.4182952776921 \tabularnewline
F-TEST (DF numerator) & 13 \tabularnewline
F-TEST (DF denominator) & 46 \tabularnewline
p-value & 8.43903345039143e-05 \tabularnewline
Multiple Linear Regression - Residual Statistics \tabularnewline
Residual Standard Deviation & 12.0499880817301 \tabularnewline
Sum Squared Residuals & 6679.3017874125 \tabularnewline
\hline
\end{tabular}
%Source: https://freestatistics.org/blog/index.php?pk=58069&T=3

[TABLE]
[ROW][C]Multiple Linear Regression - Regression Statistics[/C][/ROW]
[ROW][C]Multiple R[/C][C]0.745176801073555[/C][/ROW]
[ROW][C]R-squared[/C][C]0.555288464858216[/C][/ROW]
[ROW][C]Adjusted R-squared[/C][C]0.429609117970321[/C][/ROW]
[ROW][C]F-TEST (value)[/C][C]4.4182952776921[/C][/ROW]
[ROW][C]F-TEST (DF numerator)[/C][C]13[/C][/ROW]
[ROW][C]F-TEST (DF denominator)[/C][C]46[/C][/ROW]
[ROW][C]p-value[/C][C]8.43903345039143e-05[/C][/ROW]
[ROW][C]Multiple Linear Regression - Residual Statistics[/C][/ROW]
[ROW][C]Residual Standard Deviation[/C][C]12.0499880817301[/C][/ROW]
[ROW][C]Sum Squared Residuals[/C][C]6679.3017874125[/C][/ROW]
[/TABLE]
Source: https://freestatistics.org/blog/index.php?pk=58069&T=3

Globally Unique Identifier (entire table): ba.freestatistics.org/blog/index.php?pk=58069&T=3

As an alternative you can also use a QR Code:  

The GUIDs for individual cells are displayed in the table below:

Multiple Linear Regression - Regression Statistics
Multiple R0.745176801073555
R-squared0.555288464858216
Adjusted R-squared0.429609117970321
F-TEST (value)4.4182952776921
F-TEST (DF numerator)13
F-TEST (DF denominator)46
p-value8.43903345039143e-05
Multiple Linear Regression - Residual Statistics
Residual Standard Deviation12.0499880817301
Sum Squared Residuals6679.3017874125


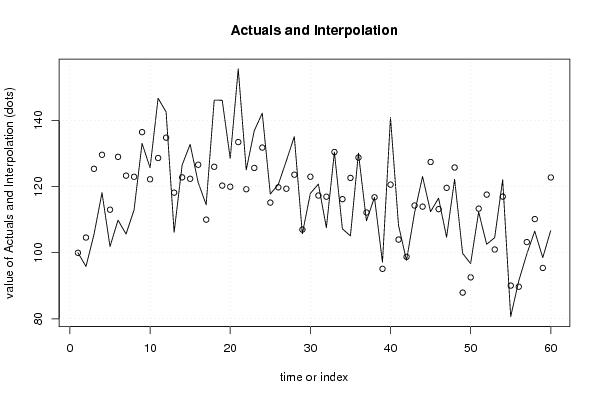
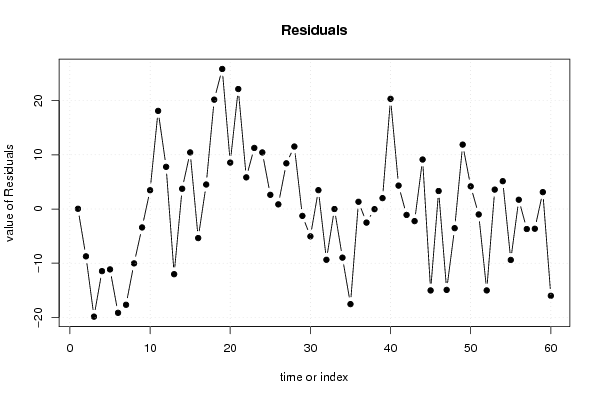
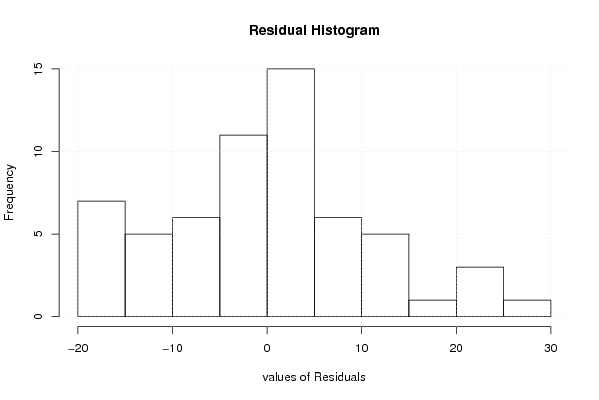
Multiple Linear Regression - Actuals, Interpolation, and Residuals
Time or IndexActualsInterpolationForecastResidualsPrediction Error
110099.9617809122410.038219087758995
295.84395716104.576773258241-8.7328160982408
3105.5073942125.364276169990-19.8568819699895
4118.1540031129.611561584052-11.4575584840524
5101.8612953113.002688564052-11.1413932640523
6109.8419174128.995076769990-19.1531593699895
7105.6348802123.304102795990-17.6692225959895
8112.927078122.957340939990-10.0302629399895
9133.0698623136.470854441990-3.40099214198950
10125.6756757122.2122755240523.46340017594767
11146.736359128.64321547999018.0931435200105
12142.5803162134.8027905640527.77752563594764
13106.1448241118.167405769900-12.0225816699005
14126.5170831122.7823981159013.73468498409947
15132.7893932122.35349792796310.4358952720367
16121.2391637126.600783342026-5.36161964202617
17114.5079041109.9919103220264.51599377797383
18146.1499235125.98429852796320.1656249720367
19146.1244263120.29332455396325.8311017460367
20128.5058644119.9465626979638.55930170203665
21155.5838858133.46007619996322.1238096000366
22125.0382458119.2014972820265.83674851797382
23136.8944416125.63243723796311.2620043620366
24142.2233554131.79201232202610.4313430779738
25117.7715451115.1566275278742.61491757212569
26120.627231119.7716198738740.855611126125644
27127.7664457119.3427196859378.42372601406283
28135.1096379123.590005111.5196328
29105.7113717106.98113208-1.26976038000000
30117.9245283122.973520285937-5.04899198593717
31120.754717117.2825463119373.47217068806282
32107.572667116.935784455937-9.36311745593718
33130.4436512130.449297957937-0.00564675793717828
34107.2157063116.19071904-8.97501274000001
35105.0739419122.621658995937-17.5477170959372
36130.1121877128.781234081.33095361999999
37109.6379398112.145849285848-2.50790948584814
38116.7261601116.760841631848-0.0346815318481742
3997.1188169395.11553834422512.00327858577489
40140.8975013120.57922685797420.3182744420262
41108.2865885103.9703538379744.31623466202616
4297.6542580398.7463389442251-1.09208091422512
43112.0346762114.271768069911-2.23709186991100
44123.0494646113.9250062139119.12445838608899
45112.4171341127.438519715911-15.021385615911
46116.4966854113.1799407979743.31674460202618
47104.6914839119.610880753911-14.919396853911
48122.2335543125.770455837974-3.53690153797383
4999.7960224487.91866794413611.8773544958639
5096.7108618192.53366029013614.17720151986388
51112.3151453113.321163201885-1.00601790188483
52102.5497195117.568448615948-15.0187291159477
53104.5385008100.9595755959483.57892520405234
54122.0805711116.9519638018855.12860729811517
5580.6476287690.044586728199-9.39695796819894
5691.4074451889.6978248721991.70962030780106
5799.51555329103.211338374199-3.69578508419894
58106.527282110.169162555948-3.64188055594766
5998.4956654895.3836994121993.11196606780106
60106.7567568122.759677595948-16.0029207959476

\begin{tabular}{lllllllll}
\hline
Multiple Linear Regression - Actuals, Interpolation, and Residuals \tabularnewline
Time or Index & Actuals & InterpolationForecast & ResidualsPrediction Error \tabularnewline
1 & 100 & 99.961780912241 & 0.038219087758995 \tabularnewline
2 & 95.84395716 & 104.576773258241 & -8.7328160982408 \tabularnewline
3 & 105.5073942 & 125.364276169990 & -19.8568819699895 \tabularnewline
4 & 118.1540031 & 129.611561584052 & -11.4575584840524 \tabularnewline
5 & 101.8612953 & 113.002688564052 & -11.1413932640523 \tabularnewline
6 & 109.8419174 & 128.995076769990 & -19.1531593699895 \tabularnewline
7 & 105.6348802 & 123.304102795990 & -17.6692225959895 \tabularnewline
8 & 112.927078 & 122.957340939990 & -10.0302629399895 \tabularnewline
9 & 133.0698623 & 136.470854441990 & -3.40099214198950 \tabularnewline
10 & 125.6756757 & 122.212275524052 & 3.46340017594767 \tabularnewline
11 & 146.736359 & 128.643215479990 & 18.0931435200105 \tabularnewline
12 & 142.5803162 & 134.802790564052 & 7.77752563594764 \tabularnewline
13 & 106.1448241 & 118.167405769900 & -12.0225816699005 \tabularnewline
14 & 126.5170831 & 122.782398115901 & 3.73468498409947 \tabularnewline
15 & 132.7893932 & 122.353497927963 & 10.4358952720367 \tabularnewline
16 & 121.2391637 & 126.600783342026 & -5.36161964202617 \tabularnewline
17 & 114.5079041 & 109.991910322026 & 4.51599377797383 \tabularnewline
18 & 146.1499235 & 125.984298527963 & 20.1656249720367 \tabularnewline
19 & 146.1244263 & 120.293324553963 & 25.8311017460367 \tabularnewline
20 & 128.5058644 & 119.946562697963 & 8.55930170203665 \tabularnewline
21 & 155.5838858 & 133.460076199963 & 22.1238096000366 \tabularnewline
22 & 125.0382458 & 119.201497282026 & 5.83674851797382 \tabularnewline
23 & 136.8944416 & 125.632437237963 & 11.2620043620366 \tabularnewline
24 & 142.2233554 & 131.792012322026 & 10.4313430779738 \tabularnewline
25 & 117.7715451 & 115.156627527874 & 2.61491757212569 \tabularnewline
26 & 120.627231 & 119.771619873874 & 0.855611126125644 \tabularnewline
27 & 127.7664457 & 119.342719685937 & 8.42372601406283 \tabularnewline
28 & 135.1096379 & 123.5900051 & 11.5196328 \tabularnewline
29 & 105.7113717 & 106.98113208 & -1.26976038000000 \tabularnewline
30 & 117.9245283 & 122.973520285937 & -5.04899198593717 \tabularnewline
31 & 120.754717 & 117.282546311937 & 3.47217068806282 \tabularnewline
32 & 107.572667 & 116.935784455937 & -9.36311745593718 \tabularnewline
33 & 130.4436512 & 130.449297957937 & -0.00564675793717828 \tabularnewline
34 & 107.2157063 & 116.19071904 & -8.97501274000001 \tabularnewline
35 & 105.0739419 & 122.621658995937 & -17.5477170959372 \tabularnewline
36 & 130.1121877 & 128.78123408 & 1.33095361999999 \tabularnewline
37 & 109.6379398 & 112.145849285848 & -2.50790948584814 \tabularnewline
38 & 116.7261601 & 116.760841631848 & -0.0346815318481742 \tabularnewline
39 & 97.11881693 & 95.1155383442251 & 2.00327858577489 \tabularnewline
40 & 140.8975013 & 120.579226857974 & 20.3182744420262 \tabularnewline
41 & 108.2865885 & 103.970353837974 & 4.31623466202616 \tabularnewline
42 & 97.65425803 & 98.7463389442251 & -1.09208091422512 \tabularnewline
43 & 112.0346762 & 114.271768069911 & -2.23709186991100 \tabularnewline
44 & 123.0494646 & 113.925006213911 & 9.12445838608899 \tabularnewline
45 & 112.4171341 & 127.438519715911 & -15.021385615911 \tabularnewline
46 & 116.4966854 & 113.179940797974 & 3.31674460202618 \tabularnewline
47 & 104.6914839 & 119.610880753911 & -14.919396853911 \tabularnewline
48 & 122.2335543 & 125.770455837974 & -3.53690153797383 \tabularnewline
49 & 99.79602244 & 87.918667944136 & 11.8773544958639 \tabularnewline
50 & 96.71086181 & 92.5336602901361 & 4.17720151986388 \tabularnewline
51 & 112.3151453 & 113.321163201885 & -1.00601790188483 \tabularnewline
52 & 102.5497195 & 117.568448615948 & -15.0187291159477 \tabularnewline
53 & 104.5385008 & 100.959575595948 & 3.57892520405234 \tabularnewline
54 & 122.0805711 & 116.951963801885 & 5.12860729811517 \tabularnewline
55 & 80.64762876 & 90.044586728199 & -9.39695796819894 \tabularnewline
56 & 91.40744518 & 89.697824872199 & 1.70962030780106 \tabularnewline
57 & 99.51555329 & 103.211338374199 & -3.69578508419894 \tabularnewline
58 & 106.527282 & 110.169162555948 & -3.64188055594766 \tabularnewline
59 & 98.49566548 & 95.383699412199 & 3.11196606780106 \tabularnewline
60 & 106.7567568 & 122.759677595948 & -16.0029207959476 \tabularnewline
\hline
\end{tabular}
%Source: https://freestatistics.org/blog/index.php?pk=58069&T=4

[TABLE]
[ROW][C]Multiple Linear Regression - Actuals, Interpolation, and Residuals[/C][/ROW]
[ROW][C]Time or Index[/C][C]Actuals[/C][C]InterpolationForecast[/C][C]ResidualsPrediction Error[/C][/ROW]
[ROW][C]1[/C][C]100[/C][C]99.961780912241[/C][C]0.038219087758995[/C][/ROW]
[ROW][C]2[/C][C]95.84395716[/C][C]104.576773258241[/C][C]-8.7328160982408[/C][/ROW]
[ROW][C]3[/C][C]105.5073942[/C][C]125.364276169990[/C][C]-19.8568819699895[/C][/ROW]
[ROW][C]4[/C][C]118.1540031[/C][C]129.611561584052[/C][C]-11.4575584840524[/C][/ROW]
[ROW][C]5[/C][C]101.8612953[/C][C]113.002688564052[/C][C]-11.1413932640523[/C][/ROW]
[ROW][C]6[/C][C]109.8419174[/C][C]128.995076769990[/C][C]-19.1531593699895[/C][/ROW]
[ROW][C]7[/C][C]105.6348802[/C][C]123.304102795990[/C][C]-17.6692225959895[/C][/ROW]
[ROW][C]8[/C][C]112.927078[/C][C]122.957340939990[/C][C]-10.0302629399895[/C][/ROW]
[ROW][C]9[/C][C]133.0698623[/C][C]136.470854441990[/C][C]-3.40099214198950[/C][/ROW]
[ROW][C]10[/C][C]125.6756757[/C][C]122.212275524052[/C][C]3.46340017594767[/C][/ROW]
[ROW][C]11[/C][C]146.736359[/C][C]128.643215479990[/C][C]18.0931435200105[/C][/ROW]
[ROW][C]12[/C][C]142.5803162[/C][C]134.802790564052[/C][C]7.77752563594764[/C][/ROW]
[ROW][C]13[/C][C]106.1448241[/C][C]118.167405769900[/C][C]-12.0225816699005[/C][/ROW]
[ROW][C]14[/C][C]126.5170831[/C][C]122.782398115901[/C][C]3.73468498409947[/C][/ROW]
[ROW][C]15[/C][C]132.7893932[/C][C]122.353497927963[/C][C]10.4358952720367[/C][/ROW]
[ROW][C]16[/C][C]121.2391637[/C][C]126.600783342026[/C][C]-5.36161964202617[/C][/ROW]
[ROW][C]17[/C][C]114.5079041[/C][C]109.991910322026[/C][C]4.51599377797383[/C][/ROW]
[ROW][C]18[/C][C]146.1499235[/C][C]125.984298527963[/C][C]20.1656249720367[/C][/ROW]
[ROW][C]19[/C][C]146.1244263[/C][C]120.293324553963[/C][C]25.8311017460367[/C][/ROW]
[ROW][C]20[/C][C]128.5058644[/C][C]119.946562697963[/C][C]8.55930170203665[/C][/ROW]
[ROW][C]21[/C][C]155.5838858[/C][C]133.460076199963[/C][C]22.1238096000366[/C][/ROW]
[ROW][C]22[/C][C]125.0382458[/C][C]119.201497282026[/C][C]5.83674851797382[/C][/ROW]
[ROW][C]23[/C][C]136.8944416[/C][C]125.632437237963[/C][C]11.2620043620366[/C][/ROW]
[ROW][C]24[/C][C]142.2233554[/C][C]131.792012322026[/C][C]10.4313430779738[/C][/ROW]
[ROW][C]25[/C][C]117.7715451[/C][C]115.156627527874[/C][C]2.61491757212569[/C][/ROW]
[ROW][C]26[/C][C]120.627231[/C][C]119.771619873874[/C][C]0.855611126125644[/C][/ROW]
[ROW][C]27[/C][C]127.7664457[/C][C]119.342719685937[/C][C]8.42372601406283[/C][/ROW]
[ROW][C]28[/C][C]135.1096379[/C][C]123.5900051[/C][C]11.5196328[/C][/ROW]
[ROW][C]29[/C][C]105.7113717[/C][C]106.98113208[/C][C]-1.26976038000000[/C][/ROW]
[ROW][C]30[/C][C]117.9245283[/C][C]122.973520285937[/C][C]-5.04899198593717[/C][/ROW]
[ROW][C]31[/C][C]120.754717[/C][C]117.282546311937[/C][C]3.47217068806282[/C][/ROW]
[ROW][C]32[/C][C]107.572667[/C][C]116.935784455937[/C][C]-9.36311745593718[/C][/ROW]
[ROW][C]33[/C][C]130.4436512[/C][C]130.449297957937[/C][C]-0.00564675793717828[/C][/ROW]
[ROW][C]34[/C][C]107.2157063[/C][C]116.19071904[/C][C]-8.97501274000001[/C][/ROW]
[ROW][C]35[/C][C]105.0739419[/C][C]122.621658995937[/C][C]-17.5477170959372[/C][/ROW]
[ROW][C]36[/C][C]130.1121877[/C][C]128.78123408[/C][C]1.33095361999999[/C][/ROW]
[ROW][C]37[/C][C]109.6379398[/C][C]112.145849285848[/C][C]-2.50790948584814[/C][/ROW]
[ROW][C]38[/C][C]116.7261601[/C][C]116.760841631848[/C][C]-0.0346815318481742[/C][/ROW]
[ROW][C]39[/C][C]97.11881693[/C][C]95.1155383442251[/C][C]2.00327858577489[/C][/ROW]
[ROW][C]40[/C][C]140.8975013[/C][C]120.579226857974[/C][C]20.3182744420262[/C][/ROW]
[ROW][C]41[/C][C]108.2865885[/C][C]103.970353837974[/C][C]4.31623466202616[/C][/ROW]
[ROW][C]42[/C][C]97.65425803[/C][C]98.7463389442251[/C][C]-1.09208091422512[/C][/ROW]
[ROW][C]43[/C][C]112.0346762[/C][C]114.271768069911[/C][C]-2.23709186991100[/C][/ROW]
[ROW][C]44[/C][C]123.0494646[/C][C]113.925006213911[/C][C]9.12445838608899[/C][/ROW]
[ROW][C]45[/C][C]112.4171341[/C][C]127.438519715911[/C][C]-15.021385615911[/C][/ROW]
[ROW][C]46[/C][C]116.4966854[/C][C]113.179940797974[/C][C]3.31674460202618[/C][/ROW]
[ROW][C]47[/C][C]104.6914839[/C][C]119.610880753911[/C][C]-14.919396853911[/C][/ROW]
[ROW][C]48[/C][C]122.2335543[/C][C]125.770455837974[/C][C]-3.53690153797383[/C][/ROW]
[ROW][C]49[/C][C]99.79602244[/C][C]87.918667944136[/C][C]11.8773544958639[/C][/ROW]
[ROW][C]50[/C][C]96.71086181[/C][C]92.5336602901361[/C][C]4.17720151986388[/C][/ROW]
[ROW][C]51[/C][C]112.3151453[/C][C]113.321163201885[/C][C]-1.00601790188483[/C][/ROW]
[ROW][C]52[/C][C]102.5497195[/C][C]117.568448615948[/C][C]-15.0187291159477[/C][/ROW]
[ROW][C]53[/C][C]104.5385008[/C][C]100.959575595948[/C][C]3.57892520405234[/C][/ROW]
[ROW][C]54[/C][C]122.0805711[/C][C]116.951963801885[/C][C]5.12860729811517[/C][/ROW]
[ROW][C]55[/C][C]80.64762876[/C][C]90.044586728199[/C][C]-9.39695796819894[/C][/ROW]
[ROW][C]56[/C][C]91.40744518[/C][C]89.697824872199[/C][C]1.70962030780106[/C][/ROW]
[ROW][C]57[/C][C]99.51555329[/C][C]103.211338374199[/C][C]-3.69578508419894[/C][/ROW]
[ROW][C]58[/C][C]106.527282[/C][C]110.169162555948[/C][C]-3.64188055594766[/C][/ROW]
[ROW][C]59[/C][C]98.49566548[/C][C]95.383699412199[/C][C]3.11196606780106[/C][/ROW]
[ROW][C]60[/C][C]106.7567568[/C][C]122.759677595948[/C][C]-16.0029207959476[/C][/ROW]
[/TABLE]
Source: https://freestatistics.org/blog/index.php?pk=58069&T=4

Globally Unique Identifier (entire table): ba.freestatistics.org/blog/index.php?pk=58069&T=4

As an alternative you can also use a QR Code:  

The GUIDs for individual cells are displayed in the table below:

Multiple Linear Regression - Actuals, Interpolation, and Residuals
Time or IndexActualsInterpolationForecastResidualsPrediction Error
110099.9617809122410.038219087758995
295.84395716104.576773258241-8.7328160982408
3105.5073942125.364276169990-19.8568819699895
4118.1540031129.611561584052-11.4575584840524
5101.8612953113.002688564052-11.1413932640523
6109.8419174128.995076769990-19.1531593699895
7105.6348802123.304102795990-17.6692225959895
8112.927078122.957340939990-10.0302629399895
9133.0698623136.470854441990-3.40099214198950
10125.6756757122.2122755240523.46340017594767
11146.736359128.64321547999018.0931435200105
12142.5803162134.8027905640527.77752563594764
13106.1448241118.167405769900-12.0225816699005
14126.5170831122.7823981159013.73468498409947
15132.7893932122.35349792796310.4358952720367
16121.2391637126.600783342026-5.36161964202617
17114.5079041109.9919103220264.51599377797383
18146.1499235125.98429852796320.1656249720367
19146.1244263120.29332455396325.8311017460367
20128.5058644119.9465626979638.55930170203665
21155.5838858133.46007619996322.1238096000366
22125.0382458119.2014972820265.83674851797382
23136.8944416125.63243723796311.2620043620366
24142.2233554131.79201232202610.4313430779738
25117.7715451115.1566275278742.61491757212569
26120.627231119.7716198738740.855611126125644
27127.7664457119.3427196859378.42372601406283
28135.1096379123.590005111.5196328
29105.7113717106.98113208-1.26976038000000
30117.9245283122.973520285937-5.04899198593717
31120.754717117.2825463119373.47217068806282
32107.572667116.935784455937-9.36311745593718
33130.4436512130.449297957937-0.00564675793717828
34107.2157063116.19071904-8.97501274000001
35105.0739419122.621658995937-17.5477170959372
36130.1121877128.781234081.33095361999999
37109.6379398112.145849285848-2.50790948584814
38116.7261601116.760841631848-0.0346815318481742
3997.1188169395.11553834422512.00327858577489
40140.8975013120.57922685797420.3182744420262
41108.2865885103.9703538379744.31623466202616
4297.6542580398.7463389442251-1.09208091422512
43112.0346762114.271768069911-2.23709186991100
44123.0494646113.9250062139119.12445838608899
45112.4171341127.438519715911-15.021385615911
46116.4966854113.1799407979743.31674460202618
47104.6914839119.610880753911-14.919396853911
48122.2335543125.770455837974-3.53690153797383
4999.7960224487.91866794413611.8773544958639
5096.7108618192.53366029013614.17720151986388
51112.3151453113.321163201885-1.00601790188483
52102.5497195117.568448615948-15.0187291159477
53104.5385008100.9595755959483.57892520405234
54122.0805711116.9519638018855.12860729811517
5580.6476287690.044586728199-9.39695796819894
5691.4074451889.6978248721991.70962030780106
5799.51555329103.211338374199-3.69578508419894
58106.527282110.169162555948-3.64188055594766
5998.4956654895.3836994121993.11196606780106
60106.7567568122.759677595948-16.0029207959476


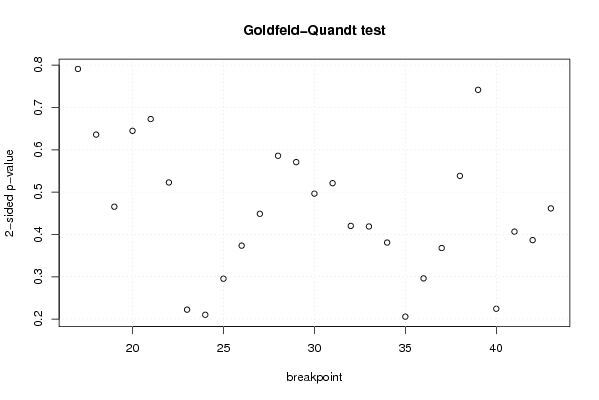
Goldfeld-Quandt test for Heteroskedasticity
p-valuesAlternative Hypothesis
breakpoint indexgreater2-sidedless
170.6045528594629690.7908942810740620.395447140537031
180.6820955066164780.6358089867670440.317904493383522
190.7672621593614260.4654756812771480.232737840638574
200.677624931803060.6447501363938790.322375068196940
210.6637238935252960.6725522129494080.336276106474704
220.7386173536319460.5227652927361080.261382646368054
230.8888238482794420.2223523034411170.111176151720558
240.8948577162362570.2102845675274860.105142283763743
250.8522700794340660.2954598411318680.147729920565934
260.8132449665654680.3735100668690650.186755033434533
270.7756068395281130.4487863209437750.224393160471887
280.7070739978439510.5858520043120990.292926002156049
290.7146004133423650.570799173315270.285399586657635
300.7518159894392430.4963680211215150.248184010560757
310.7394620047629850.5210759904740290.260537995237015
320.7899180832662020.4201638334675950.210081916733798
330.790607364997410.4187852700051780.209392635002589
340.8095862448611730.3808275102776540.190413755138827
350.8970847601277890.2058304797444230.102915239872211
360.8518783210992080.2962433578015830.148121678900792
370.8160655960720080.3678688078559830.183934403927992
380.7308460787217460.5383078425565090.269153921278254
390.6292170366283410.7415659267433180.370782963371659
400.8877880097385380.2244239805229250.112211990261462
410.7966864135221340.4066271729557310.203313586477866
420.8067028047696190.3865943904607630.193297195230382
430.7692246584961670.4615506830076650.230775341503833

\begin{tabular}{lllllllll}
\hline
Goldfeld-Quandt test for Heteroskedasticity \tabularnewline
p-values & Alternative Hypothesis \tabularnewline
breakpoint index & greater & 2-sided & less \tabularnewline
17 & 0.604552859462969 & 0.790894281074062 & 0.395447140537031 \tabularnewline
18 & 0.682095506616478 & 0.635808986767044 & 0.317904493383522 \tabularnewline
19 & 0.767262159361426 & 0.465475681277148 & 0.232737840638574 \tabularnewline
20 & 0.67762493180306 & 0.644750136393879 & 0.322375068196940 \tabularnewline
21 & 0.663723893525296 & 0.672552212949408 & 0.336276106474704 \tabularnewline
22 & 0.738617353631946 & 0.522765292736108 & 0.261382646368054 \tabularnewline
23 & 0.888823848279442 & 0.222352303441117 & 0.111176151720558 \tabularnewline
24 & 0.894857716236257 & 0.210284567527486 & 0.105142283763743 \tabularnewline
25 & 0.852270079434066 & 0.295459841131868 & 0.147729920565934 \tabularnewline
26 & 0.813244966565468 & 0.373510066869065 & 0.186755033434533 \tabularnewline
27 & 0.775606839528113 & 0.448786320943775 & 0.224393160471887 \tabularnewline
28 & 0.707073997843951 & 0.585852004312099 & 0.292926002156049 \tabularnewline
29 & 0.714600413342365 & 0.57079917331527 & 0.285399586657635 \tabularnewline
30 & 0.751815989439243 & 0.496368021121515 & 0.248184010560757 \tabularnewline
31 & 0.739462004762985 & 0.521075990474029 & 0.260537995237015 \tabularnewline
32 & 0.789918083266202 & 0.420163833467595 & 0.210081916733798 \tabularnewline
33 & 0.79060736499741 & 0.418785270005178 & 0.209392635002589 \tabularnewline
34 & 0.809586244861173 & 0.380827510277654 & 0.190413755138827 \tabularnewline
35 & 0.897084760127789 & 0.205830479744423 & 0.102915239872211 \tabularnewline
36 & 0.851878321099208 & 0.296243357801583 & 0.148121678900792 \tabularnewline
37 & 0.816065596072008 & 0.367868807855983 & 0.183934403927992 \tabularnewline
38 & 0.730846078721746 & 0.538307842556509 & 0.269153921278254 \tabularnewline
39 & 0.629217036628341 & 0.741565926743318 & 0.370782963371659 \tabularnewline
40 & 0.887788009738538 & 0.224423980522925 & 0.112211990261462 \tabularnewline
41 & 0.796686413522134 & 0.406627172955731 & 0.203313586477866 \tabularnewline
42 & 0.806702804769619 & 0.386594390460763 & 0.193297195230382 \tabularnewline
43 & 0.769224658496167 & 0.461550683007665 & 0.230775341503833 \tabularnewline
\hline
\end{tabular}
%Source: https://freestatistics.org/blog/index.php?pk=58069&T=5

[TABLE]
[ROW][C]Goldfeld-Quandt test for Heteroskedasticity[/C][/ROW]
[ROW][C]p-values[/C][C]Alternative Hypothesis[/C][/ROW]
[ROW][C]breakpoint index[/C][C]greater[/C][C]2-sided[/C][C]less[/C][/ROW]
[ROW][C]17[/C][C]0.604552859462969[/C][C]0.790894281074062[/C][C]0.395447140537031[/C][/ROW]
[ROW][C]18[/C][C]0.682095506616478[/C][C]0.635808986767044[/C][C]0.317904493383522[/C][/ROW]
[ROW][C]19[/C][C]0.767262159361426[/C][C]0.465475681277148[/C][C]0.232737840638574[/C][/ROW]
[ROW][C]20[/C][C]0.67762493180306[/C][C]0.644750136393879[/C][C]0.322375068196940[/C][/ROW]
[ROW][C]21[/C][C]0.663723893525296[/C][C]0.672552212949408[/C][C]0.336276106474704[/C][/ROW]
[ROW][C]22[/C][C]0.738617353631946[/C][C]0.522765292736108[/C][C]0.261382646368054[/C][/ROW]
[ROW][C]23[/C][C]0.888823848279442[/C][C]0.222352303441117[/C][C]0.111176151720558[/C][/ROW]
[ROW][C]24[/C][C]0.894857716236257[/C][C]0.210284567527486[/C][C]0.105142283763743[/C][/ROW]
[ROW][C]25[/C][C]0.852270079434066[/C][C]0.295459841131868[/C][C]0.147729920565934[/C][/ROW]
[ROW][C]26[/C][C]0.813244966565468[/C][C]0.373510066869065[/C][C]0.186755033434533[/C][/ROW]
[ROW][C]27[/C][C]0.775606839528113[/C][C]0.448786320943775[/C][C]0.224393160471887[/C][/ROW]
[ROW][C]28[/C][C]0.707073997843951[/C][C]0.585852004312099[/C][C]0.292926002156049[/C][/ROW]
[ROW][C]29[/C][C]0.714600413342365[/C][C]0.57079917331527[/C][C]0.285399586657635[/C][/ROW]
[ROW][C]30[/C][C]0.751815989439243[/C][C]0.496368021121515[/C][C]0.248184010560757[/C][/ROW]
[ROW][C]31[/C][C]0.739462004762985[/C][C]0.521075990474029[/C][C]0.260537995237015[/C][/ROW]
[ROW][C]32[/C][C]0.789918083266202[/C][C]0.420163833467595[/C][C]0.210081916733798[/C][/ROW]
[ROW][C]33[/C][C]0.79060736499741[/C][C]0.418785270005178[/C][C]0.209392635002589[/C][/ROW]
[ROW][C]34[/C][C]0.809586244861173[/C][C]0.380827510277654[/C][C]0.190413755138827[/C][/ROW]
[ROW][C]35[/C][C]0.897084760127789[/C][C]0.205830479744423[/C][C]0.102915239872211[/C][/ROW]
[ROW][C]36[/C][C]0.851878321099208[/C][C]0.296243357801583[/C][C]0.148121678900792[/C][/ROW]
[ROW][C]37[/C][C]0.816065596072008[/C][C]0.367868807855983[/C][C]0.183934403927992[/C][/ROW]
[ROW][C]38[/C][C]0.730846078721746[/C][C]0.538307842556509[/C][C]0.269153921278254[/C][/ROW]
[ROW][C]39[/C][C]0.629217036628341[/C][C]0.741565926743318[/C][C]0.370782963371659[/C][/ROW]
[ROW][C]40[/C][C]0.887788009738538[/C][C]0.224423980522925[/C][C]0.112211990261462[/C][/ROW]
[ROW][C]41[/C][C]0.796686413522134[/C][C]0.406627172955731[/C][C]0.203313586477866[/C][/ROW]
[ROW][C]42[/C][C]0.806702804769619[/C][C]0.386594390460763[/C][C]0.193297195230382[/C][/ROW]
[ROW][C]43[/C][C]0.769224658496167[/C][C]0.461550683007665[/C][C]0.230775341503833[/C][/ROW]
[/TABLE]
Source: https://freestatistics.org/blog/index.php?pk=58069&T=5

Globally Unique Identifier (entire table): ba.freestatistics.org/blog/index.php?pk=58069&T=5

As an alternative you can also use a QR Code:  

The GUIDs for individual cells are displayed in the table below:

Goldfeld-Quandt test for Heteroskedasticity
p-valuesAlternative Hypothesis
breakpoint indexgreater2-sidedless
170.6045528594629690.7908942810740620.395447140537031
180.6820955066164780.6358089867670440.317904493383522
190.7672621593614260.4654756812771480.232737840638574
200.677624931803060.6447501363938790.322375068196940
210.6637238935252960.6725522129494080.336276106474704
220.7386173536319460.5227652927361080.261382646368054
230.8888238482794420.2223523034411170.111176151720558
240.8948577162362570.2102845675274860.105142283763743
250.8522700794340660.2954598411318680.147729920565934
260.8132449665654680.3735100668690650.186755033434533
270.7756068395281130.4487863209437750.224393160471887
280.7070739978439510.5858520043120990.292926002156049
290.7146004133423650.570799173315270.285399586657635
300.7518159894392430.4963680211215150.248184010560757
310.7394620047629850.5210759904740290.260537995237015
320.7899180832662020.4201638334675950.210081916733798
330.790607364997410.4187852700051780.209392635002589
340.8095862448611730.3808275102776540.190413755138827
350.8970847601277890.2058304797444230.102915239872211
360.8518783210992080.2962433578015830.148121678900792
370.8160655960720080.3678688078559830.183934403927992
380.7308460787217460.5383078425565090.269153921278254
390.6292170366283410.7415659267433180.370782963371659
400.8877880097385380.2244239805229250.112211990261462
410.7966864135221340.4066271729557310.203313586477866
420.8067028047696190.3865943904607630.193297195230382
430.7692246584961670.4615506830076650.230775341503833


Meta Analysis of Goldfeld-Quandt test for Heteroskedasticity
Description# significant tests% significant testsOK/NOK
1% type I error level00OK
5% type I error level00OK
10% type I error level00OK

\begin{tabular}{lllllllll}
\hline
Meta Analysis of Goldfeld-Quandt test for Heteroskedasticity \tabularnewline
Description & # significant tests & % significant tests & OK/NOK \tabularnewline
1% type I error level & 0 & 0 & OK \tabularnewline
5% type I error level & 0 & 0 & OK \tabularnewline
10% type I error level & 0 & 0 & OK \tabularnewline
\hline
\end{tabular}
%Source: https://freestatistics.org/blog/index.php?pk=58069&T=6

[TABLE]
[ROW][C]Meta Analysis of Goldfeld-Quandt test for Heteroskedasticity[/C][/ROW]
[ROW][C]Description[/C][C]# significant tests[/C][C]% significant tests[/C][C]OK/NOK[/C][/ROW]
[ROW][C]1% type I error level[/C][C]0[/C][C]0[/C][C]OK[/C][/ROW]
[ROW][C]5% type I error level[/C][C]0[/C][C]0[/C][C]OK[/C][/ROW]
[ROW][C]10% type I error level[/C][C]0[/C][C]0[/C][C]OK[/C][/ROW]
[/TABLE]
Source: https://freestatistics.org/blog/index.php?pk=58069&T=6

Globally Unique Identifier (entire table): ba.freestatistics.org/blog/index.php?pk=58069&T=6

As an alternative you can also use a QR Code:  

The GUIDs for individual cells are displayed in the table below:

Meta Analysis of Goldfeld-Quandt test for Heteroskedasticity
Description# significant tests% significant testsOK/NOK
1% type I error level00OK
5% type I error level00OK
10% type I error level00OK


Parameters (Session):
par1 = 1 ; par2 = Include Monthly Dummies ; par3 = Linear Trend ;
Parameters (R input):
par1 = 1 ; par2 = Include Monthly Dummies ; par3 = Linear Trend ;
R code (references can be found in the software module):
library(lattice)
library(lmtest)
n25 <- 25 #minimum number of obs. for Goldfeld-Quandt test
par1 <- as.numeric(par1)
x <- t(y)
k <- length(x[1,])
n <- length(x[,1])
x1 <- cbind(x[,par1], x[,1:k!=par1])
mycolnames <- c(colnames(x)[par1], colnames(x)[1:k!=par1])
colnames(x1) <- mycolnames #colnames(x)[par1]
x <- x1
if (par3 == 'First Differences'){
x2 <- array(0, dim=c(n-1,k), dimnames=list(1:(n-1), paste('(1-B)',colnames(x),sep='')))
for (i in 1:n-1) {
for (j in 1:k) {
x2[i,j] <- x[i+1,j] - x[i,j]
}
}
x <- x2
}
if (par2 == 'Include Monthly Dummies'){
x2 <- array(0, dim=c(n,11), dimnames=list(1:n, paste('M', seq(1:11), sep ='')))
for (i in 1:11){
x2[seq(i,n,12),i] <- 1
}
x <- cbind(x, x2)
}
if (par2 == 'Include Quarterly Dummies'){
x2 <- array(0, dim=c(n,3), dimnames=list(1:n, paste('Q', seq(1:3), sep ='')))
for (i in 1:3){
x2[seq(i,n,4),i] <- 1
}
x <- cbind(x, x2)
}
k <- length(x[1,])
if (par3 == 'Linear Trend'){
x <- cbind(x, c(1:n))
colnames(x)[k+1] <- 't'
}
x
k <- length(x[1,])
df <- as.data.frame(x)
(mylm <- lm(df))
(mysum <- summary(mylm))
if (n > n25) {
kp3 <- k + 3
nmkm3 <- n - k - 3
gqarr <- array(NA, dim=c(nmkm3-kp3+1,3))
numgqtests <- 0
numsignificant1 <- 0
numsignificant5 <- 0
numsignificant10 <- 0
for (mypoint in kp3:nmkm3) {
j <- 0
numgqtests <- numgqtests + 1
for (myalt in c('greater', 'two.sided', 'less')) {
j <- j + 1
gqarr[mypoint-kp3+1,j] <- gqtest(mylm, point=mypoint, alternative=myalt)$p.value
}
if (gqarr[mypoint-kp3+1,2] < 0.01) numsignificant1 <- numsignificant1 + 1
if (gqarr[mypoint-kp3+1,2] < 0.05) numsignificant5 <- numsignificant5 + 1
if (gqarr[mypoint-kp3+1,2] < 0.10) numsignificant10 <- numsignificant10 + 1
}
gqarr
}
bitmap(file='test0.png')
plot(x[,1], type='l', main='Actuals and Interpolation', ylab='value of Actuals and Interpolation (dots)', xlab='time or index')
points(x[,1]-mysum$resid)
grid()
dev.off()
bitmap(file='test1.png')
plot(mysum$resid, type='b', pch=19, main='Residuals', ylab='value of Residuals', xlab='time or index')
grid()
dev.off()
bitmap(file='test2.png')
hist(mysum$resid, main='Residual Histogram', xlab='values of Residuals')
grid()
dev.off()
bitmap(file='test3.png')
densityplot(~mysum$resid,col='black',main='Residual Density Plot', xlab='values of Residuals')
dev.off()
bitmap(file='test4.png')
qqnorm(mysum$resid, main='Residual Normal Q-Q Plot')
qqline(mysum$resid)
grid()
dev.off()
(myerror <- as.ts(mysum$resid))
bitmap(file='test5.png')
dum <- cbind(lag(myerror,k=1),myerror)
dum
dum1 <- dum[2:length(myerror),]
dum1
z <- as.data.frame(dum1)
z
plot(z,main=paste('Residual Lag plot, lowess, and regression line'), ylab='values of Residuals', xlab='lagged values of Residuals')
lines(lowess(z))
abline(lm(z))
grid()
dev.off()
bitmap(file='test6.png')
acf(mysum$resid, lag.max=length(mysum$resid)/2, main='Residual Autocorrelation Function')
grid()
dev.off()
bitmap(file='test7.png')
pacf(mysum$resid, lag.max=length(mysum$resid)/2, main='Residual Partial Autocorrelation Function')
grid()
dev.off()
bitmap(file='test8.png')
opar <- par(mfrow = c(2,2), oma = c(0, 0, 1.1, 0))
plot(mylm, las = 1, sub='Residual Diagnostics')
par(opar)
dev.off()
if (n > n25) {
bitmap(file='test9.png')
plot(kp3:nmkm3,gqarr[,2], main='Goldfeld-Quandt test',ylab='2-sided p-value',xlab='breakpoint')
grid()
dev.off()
}
load(file='createtable')
a<-table.start()
a<-table.row.start(a)
a<-table.element(a, 'Multiple Linear Regression - Estimated Regression Equation', 1, TRUE)
a<-table.row.end(a)
myeq <- colnames(x)[1]
myeq <- paste(myeq, '[t] = ', sep='')
for (i in 1:k){
if (mysum$coefficients[i,1] > 0) myeq <- paste(myeq, '+', '')
myeq <- paste(myeq, mysum$coefficients[i,1], sep=' ')
if (rownames(mysum$coefficients)[i] != '(Intercept)') {
myeq <- paste(myeq, rownames(mysum$coefficients)[i], sep='')
if (rownames(mysum$coefficients)[i] != 't') myeq <- paste(myeq, '[t]', sep='')
}
}
myeq <- paste(myeq, ' + e[t]')
a<-table.row.start(a)
a<-table.element(a, myeq)
a<-table.row.end(a)
a<-table.end(a)
table.save(a,file='mytable1.tab')
a<-table.start()
a<-table.row.start(a)
a<-table.element(a,hyperlink('ols1.htm','Multiple Linear Regression - Ordinary Least Squares',''), 6, TRUE)
a<-table.row.end(a)
a<-table.row.start(a)
a<-table.element(a,'Variable',header=TRUE)
a<-table.element(a,'Parameter',header=TRUE)
a<-table.element(a,'S.D.',header=TRUE)
a<-table.element(a,'T-STAT
H0: parameter = 0',header=TRUE)
a<-table.element(a,'2-tail p-value',header=TRUE)
a<-table.element(a,'1-tail p-value',header=TRUE)
a<-table.row.end(a)
for (i in 1:k){
a<-table.row.start(a)
a<-table.element(a,rownames(mysum$coefficients)[i],header=TRUE)
a<-table.element(a,mysum$coefficients[i,1])
a<-table.element(a, round(mysum$coefficients[i,2],6))
a<-table.element(a, round(mysum$coefficients[i,3],4))
a<-table.element(a, round(mysum$coefficients[i,4],6))
a<-table.element(a, round(mysum$coefficients[i,4]/2,6))
a<-table.row.end(a)
}
a<-table.end(a)
table.save(a,file='mytable2.tab')
a<-table.start()
a<-table.row.start(a)
a<-table.element(a, 'Multiple Linear Regression - Regression Statistics', 2, TRUE)
a<-table.row.end(a)
a<-table.row.start(a)
a<-table.element(a, 'Multiple R',1,TRUE)
a<-table.element(a, sqrt(mysum$r.squared))
a<-table.row.end(a)
a<-table.row.start(a)
a<-table.element(a, 'R-squared',1,TRUE)
a<-table.element(a, mysum$r.squared)
a<-table.row.end(a)
a<-table.row.start(a)
a<-table.element(a, 'Adjusted R-squared',1,TRUE)
a<-table.element(a, mysum$adj.r.squared)
a<-table.row.end(a)
a<-table.row.start(a)
a<-table.element(a, 'F-TEST (value)',1,TRUE)
a<-table.element(a, mysum$fstatistic[1])
a<-table.row.end(a)
a<-table.row.start(a)
a<-table.element(a, 'F-TEST (DF numerator)',1,TRUE)
a<-table.element(a, mysum$fstatistic[2])
a<-table.row.end(a)
a<-table.row.start(a)
a<-table.element(a, 'F-TEST (DF denominator)',1,TRUE)
a<-table.element(a, mysum$fstatistic[3])
a<-table.row.end(a)
a<-table.row.start(a)
a<-table.element(a, 'p-value',1,TRUE)
a<-table.element(a, 1-pf(mysum$fstatistic[1],mysum$fstatistic[2],mysum$fstatistic[3]))
a<-table.row.end(a)
a<-table.row.start(a)
a<-table.element(a, 'Multiple Linear Regression - Residual Statistics', 2, TRUE)
a<-table.row.end(a)
a<-table.row.start(a)
a<-table.element(a, 'Residual Standard Deviation',1,TRUE)
a<-table.element(a, mysum$sigma)
a<-table.row.end(a)
a<-table.row.start(a)
a<-table.element(a, 'Sum Squared Residuals',1,TRUE)
a<-table.element(a, sum(myerror*myerror))
a<-table.row.end(a)
a<-table.end(a)
table.save(a,file='mytable3.tab')
a<-table.start()
a<-table.row.start(a)
a<-table.element(a, 'Multiple Linear Regression - Actuals, Interpolation, and Residuals', 4, TRUE)
a<-table.row.end(a)
a<-table.row.start(a)
a<-table.element(a, 'Time or Index', 1, TRUE)
a<-table.element(a, 'Actuals', 1, TRUE)
a<-table.element(a, 'Interpolation
Forecast', 1, TRUE)
a<-table.element(a, 'Residuals
Prediction Error', 1, TRUE)
a<-table.row.end(a)
for (i in 1:n) {
a<-table.row.start(a)
a<-table.element(a,i, 1, TRUE)
a<-table.element(a,x[i])
a<-table.element(a,x[i]-mysum$resid[i])
a<-table.element(a,mysum$resid[i])
a<-table.row.end(a)
}
a<-table.end(a)
table.save(a,file='mytable4.tab')
if (n > n25) {
a<-table.start()
a<-table.row.start(a)
a<-table.element(a,'Goldfeld-Quandt test for Heteroskedasticity',4,TRUE)
a<-table.row.end(a)
a<-table.row.start(a)
a<-table.element(a,'p-values',header=TRUE)
a<-table.element(a,'Alternative Hypothesis',3,header=TRUE)
a<-table.row.end(a)
a<-table.row.start(a)
a<-table.element(a,'breakpoint index',header=TRUE)
a<-table.element(a,'greater',header=TRUE)
a<-table.element(a,'2-sided',header=TRUE)
a<-table.element(a,'less',header=TRUE)
a<-table.row.end(a)
for (mypoint in kp3:nmkm3) {
a<-table.row.start(a)
a<-table.element(a,mypoint,header=TRUE)
a<-table.element(a,gqarr[mypoint-kp3+1,1])
a<-table.element(a,gqarr[mypoint-kp3+1,2])
a<-table.element(a,gqarr[mypoint-kp3+1,3])
a<-table.row.end(a)
}
a<-table.end(a)
table.save(a,file='mytable5.tab')
a<-table.start()
a<-table.row.start(a)
a<-table.element(a,'Meta Analysis of Goldfeld-Quandt test for Heteroskedasticity',4,TRUE)
a<-table.row.end(a)
a<-table.row.start(a)
a<-table.element(a,'Description',header=TRUE)
a<-table.element(a,'# significant tests',header=TRUE)
a<-table.element(a,'% significant tests',header=TRUE)
a<-table.element(a,'OK/NOK',header=TRUE)
a<-table.row.end(a)
a<-table.row.start(a)
a<-table.element(a,'1% type I error level',header=TRUE)
a<-table.element(a,numsignificant1)
a<-table.element(a,numsignificant1/numgqtests)
if (numsignificant1/numgqtests < 0.01) dum <- 'OK' else dum <- 'NOK'
a<-table.element(a,dum)
a<-table.row.end(a)
a<-table.row.start(a)
a<-table.element(a,'5% type I error level',header=TRUE)
a<-table.element(a,numsignificant5)
a<-table.element(a,numsignificant5/numgqtests)
if (numsignificant5/numgqtests < 0.05) dum <- 'OK' else dum <- 'NOK'
a<-table.element(a,dum)
a<-table.row.end(a)
a<-table.row.start(a)
a<-table.element(a,'10% type I error level',header=TRUE)
a<-table.element(a,numsignificant10)
a<-table.element(a,numsignificant10/numgqtests)
if (numsignificant10/numgqtests < 0.1) dum <- 'OK' else dum <- 'NOK'
a<-table.element(a,dum)
a<-table.row.end(a)
a<-table.end(a)
table.save(a,file='mytable6.tab')
}