| Multiple Linear Regression - Estimated Regression Equation |
| Y[t] = + 2798.64582612754 -1.29649455104450X[t] + 126.573614428065M1[t] -101.914798649428M2[t] + 865.440994811826M3[t] + 334.730478464959M4[t] + 338.982766477257M5[t] + 393.997858848719M6[t] + 298.931549040599M7[t] + 440.968744681435M8[t] -190.497565126685M9[t] + 148.998929424360M10[t] + 205.866309808120M11[t] + e[t] |
| Multiple Linear Regression - Ordinary Least Squares | |||||
| Variable | Parameter | S.D. | T-STAT H0: parameter = 0 | 2-tail p-value | 1-tail p-value |
| (Intercept) | 2798.64582612754 | 310.55353 | 9.0118 | 0 | 0 |
| X | -1.29649455104450 | 0.792395 | -1.6362 | 0.108484 | 0.054242 |
| M1 | 126.573614428065 | 106.094938 | 1.193 | 0.238849 | 0.119424 |
| M2 | -101.914798649428 | 105.813332 | -0.9632 | 0.340399 | 0.170199 |
| M3 | 865.440994811826 | 105.685081 | 8.1889 | 0 | 0 |
| M4 | 334.730478464959 | 105.401308 | 3.1758 | 0.002639 | 0.001319 |
| M5 | 338.982766477257 | 105.226858 | 3.2214 | 0.002318 | 0.001159 |
| M6 | 393.997858848719 | 105.130745 | 3.7477 | 0.000488 | 0.000244 |
| M7 | 298.931549040599 | 105.024261 | 2.8463 | 0.006536 | 0.003268 |
| M8 | 440.968744681435 | 104.983121 | 4.2004 | 0.000118 | 5.9e-05 |
| M9 | -190.497565126685 | 104.904503 | -1.8159 | 0.075765 | 0.037883 |
| M10 | 148.998929424360 | 104.869184 | 1.4208 | 0.161974 | 0.080987 |
| M11 | 205.866309808120 | 104.791559 | 1.9645 | 0.055396 | 0.027698 |
| Multiple Linear Regression - Regression Statistics | |
| Multiple R | 0.880399109517796 |
| R-squared | 0.775102592039729 |
| Adjusted R-squared | 0.717681977241361 |
| F-TEST (value) | 13.4986815233781 |
| F-TEST (DF numerator) | 12 |
| F-TEST (DF denominator) | 47 |
| p-value | 1.89890325685838e-11 |
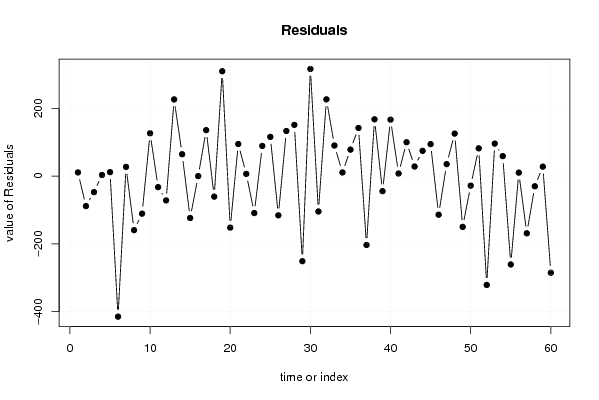
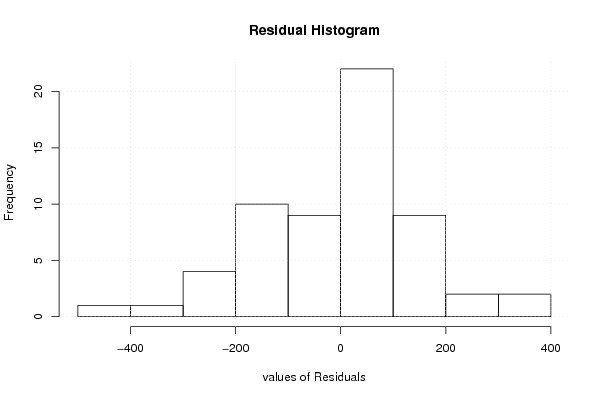
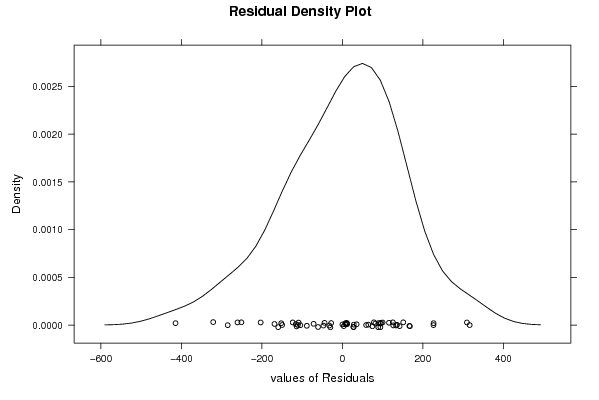
| Multiple Linear Regression - Residual Statistics | |
| Residual Standard Deviation | 165.674653926675 |
| Sum Squared Residuals | 1290060.27482500 |
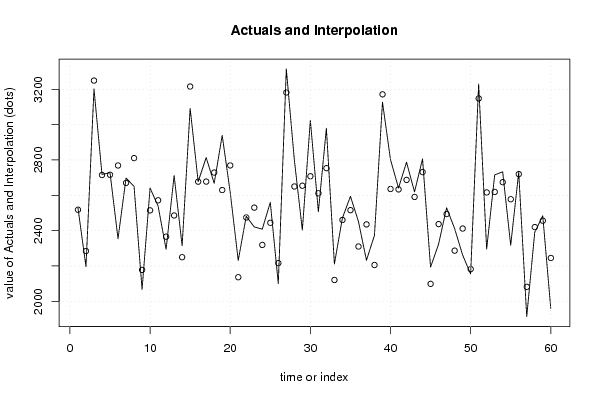
| Multiple Linear Regression - Actuals, Interpolation, and Residuals | |||
| Time or Index | Actuals | Interpolation Forecast | Residuals Prediction Error |
| 1 | 2529 | 2518.12015152763 | 10.8798484723707 |
| 2 | 2196 | 2284.44576024596 | -88.4457602459581 |
| 3 | 3202 | 3249.20856460512 | -47.2085646051217 |
| 4 | 2718 | 2714.60856460512 | 3.3914353948774 |
| 5 | 2728 | 2716.26786351533 | 11.7321364846685 |
| 6 | 2354 | 2768.68996678470 | -414.689966784705 |
| 7 | 2697 | 2669.73417332345 | 27.265826676549 |
| 8 | 2651 | 2810.47487441324 | -159.474874413242 |
| 9 | 2067 | 2177.71207005408 | -110.712070054078 |
| 10 | 2641 | 2514.61557550303 | 126.384424496967 |
| 11 | 2539 | 2571.48295588679 | -32.4829558867934 |
| 12 | 2294 | 2365.61664607867 | -71.6166460786734 |
| 13 | 2712 | 2485.70778775152 | 226.292212248483 |
| 14 | 2314 | 2249.44040736776 | 64.5595926322436 |
| 15 | 3092 | 3215.49970627797 | -123.499706277965 |
| 16 | 2677 | 2677.01022262483 | -0.0102226248318100 |
| 17 | 2813 | 2677.37302698400 | 135.626973016004 |
| 18 | 2668 | 2728.49863570232 | -60.498635702325 |
| 19 | 2939 | 2629.54284224107 | 309.457157758928 |
| 20 | 2617 | 2768.98704877982 | -151.987048779818 |
| 21 | 2231 | 2136.22424442065 | 94.775755579346 |
| 22 | 2481 | 2474.42424442065 | 6.575755579346 |
| 23 | 2421 | 2529.99513025337 | -108.995130253370 |
| 24 | 2408 | 2318.94284224107 | 89.0571577589282 |
| 25 | 2560 | 2444.21996211809 | 115.780037881907 |
| 26 | 2100 | 2215.7315490406 | -115.731549040599 |
| 27 | 3315 | 3181.79084795081 | 133.209152049191 |
| 28 | 2801 | 2649.78383705290 | 151.216162947103 |
| 29 | 2403 | 2654.03612506519 | -251.036125065195 |
| 30 | 3024 | 2707.75472288561 | 316.245277114387 |
| 31 | 2507 | 2611.39191852645 | -104.391918526449 |
| 32 | 2980 | 2753.42911416728 | 226.570885832716 |
| 33 | 2211 | 2120.66630980812 | 90.33369019188 |
| 34 | 2471 | 2460.16280435916 | 10.8371956408356 |
| 35 | 2594 | 2515.73369019188 | 78.2663098081199 |
| 36 | 2452 | 2309.86738038376 | 142.132619616240 |
| 37 | 2232 | 2435.14450026078 | -203.144500260781 |
| 38 | 2373 | 2205.35959263224 | 167.640407367757 |
| 39 | 3127 | 3171.41889154245 | -44.4188915424526 |
| 40 | 2802 | 2635.52239699141 | 166.477603008592 |
| 41 | 2641 | 2633.29221224848 | 7.70778775151669 |
| 42 | 2787 | 2687.0108100689 | 99.989189931099 |
| 43 | 2619 | 2590.64800570974 | 28.3519942902633 |
| 44 | 2806 | 2731.38870679953 | 74.611293200472 |
| 45 | 2193 | 2098.62590244036 | 94.3740975596365 |
| 46 | 2323 | 2436.82590244036 | -113.825902440363 |
| 47 | 2529 | 2493.69328282412 | 35.3067171758764 |
| 48 | 2412 | 2286.53047846496 | 125.469521535041 |
| 49 | 2262 | 2411.80759834198 | -149.807598341980 |
| 50 | 2154 | 2182.02269071344 | -28.0226907134425 |
| 51 | 3230 | 3148.08198962365 | 81.9180103763483 |
| 52 | 2295 | 2616.07497872574 | -321.074978725741 |
| 53 | 2715 | 2619.03077218699 | 95.9692278130061 |
| 54 | 2733 | 2674.04586455846 | 58.9541354415439 |
| 55 | 2317 | 2577.68306019929 | -260.683060199292 |
| 56 | 2730 | 2719.72025584013 | 10.2797441598727 |
| 57 | 1913 | 2081.77147327678 | -168.771473276785 |
| 58 | 2390 | 2419.97147327679 | -29.971473276785 |
| 59 | 2484 | 2456.09494084383 | 27.9050591561669 |
| 60 | 1960 | 2245.04265283154 | -285.042652831535 |
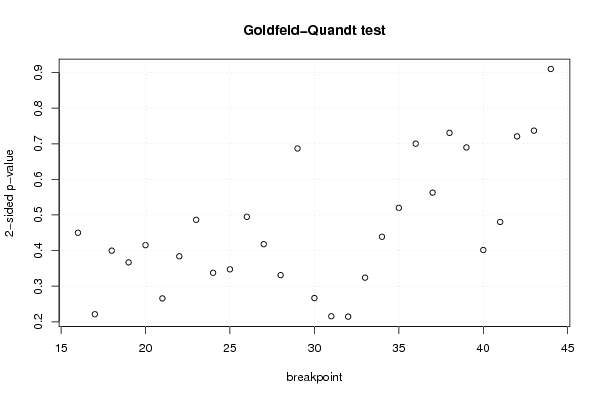
| Goldfeld-Quandt test for Heteroskedasticity | |||
| p-values | Alternative Hypothesis | ||
| breakpoint index | greater | 2-sided | less |
| 16 | 0.225067800411415 | 0.450135600822829 | 0.774932199588585 |
| 17 | 0.110570907755643 | 0.221141815511287 | 0.889429092244357 |
| 18 | 0.199867376175430 | 0.399734752350861 | 0.80013262382457 |
| 19 | 0.183440812248812 | 0.366881624497624 | 0.816559187751188 |
| 20 | 0.207608909084904 | 0.415217818169809 | 0.792391090915096 |
| 21 | 0.132826767258500 | 0.265653534517001 | 0.8671732327415 |
| 22 | 0.191980966159829 | 0.383961932319658 | 0.808019033840171 |
| 23 | 0.243210845217772 | 0.486421690435544 | 0.756789154782228 |
| 24 | 0.168795802250753 | 0.337591604501506 | 0.831204197749247 |
| 25 | 0.173660632442977 | 0.347321264885953 | 0.826339367557023 |
| 26 | 0.247439781394709 | 0.494879562789417 | 0.752560218605291 |
| 27 | 0.208980044580183 | 0.417960089160366 | 0.791019955419817 |
| 28 | 0.165478969068599 | 0.330957938137197 | 0.834521030931401 |
| 29 | 0.656544100657989 | 0.686911798684022 | 0.343455899342011 |
| 30 | 0.866721199215898 | 0.266557601568204 | 0.133278800784102 |
| 31 | 0.89224428396882 | 0.21551143206236 | 0.10775571603118 |
| 32 | 0.892820605546796 | 0.214358788906407 | 0.107179394453204 |
| 33 | 0.83803127993128 | 0.323937440137439 | 0.161968720068720 |
| 34 | 0.780603491946686 | 0.438793016106628 | 0.219396508053314 |
| 35 | 0.7399530848272 | 0.520093830345599 | 0.260046915172799 |
| 36 | 0.649845316391598 | 0.700309367216804 | 0.350154683608402 |
| 37 | 0.7185812261257 | 0.5628375477486 | 0.2814187738743 |
| 38 | 0.63459767466886 | 0.73080465066228 | 0.36540232533114 |
| 39 | 0.65510476137925 | 0.6897904772415 | 0.34489523862075 |
| 40 | 0.79922450057203 | 0.401550998855939 | 0.200775499427969 |
| 41 | 0.759763701652091 | 0.480472596695817 | 0.240236298347909 |
| 42 | 0.639582945924749 | 0.720834108150501 | 0.360417054075251 |
| 43 | 0.631530261318727 | 0.736939477362545 | 0.368469738681272 |
| 44 | 0.455156638330279 | 0.910313276660559 | 0.544843361669721 |
| Meta Analysis of Goldfeld-Quandt test for Heteroskedasticity | |||
| Description | # significant tests | % significant tests | OK/NOK |
| 1% type I error level | 0 | 0 | OK |
| 5% type I error level | 0 | 0 | OK |
| 10% type I error level | 0 | 0 | OK |