| Multiple Linear Regression - Estimated Regression Equation |
| Broodprijs[t] = -0.817116564417187 + 4.36503067484664Bakmeelprijs[t] -0.00707975460122839M1[t] + 0.00419018404907976M2[t] -0.00253987730061343M3[t] + 0.00819018404907986M4[t] -0.0092699386503067M5[t] -0.000539877300613433M6[t] + 0.00346012269938658M7[t] -0.0127300613496933M8[t] + 0.0067300613496933M9[t] + 0.0174601226993866M10[t] + 3.07197928500461e-17M11[t] + e[t] |
| Multiple Linear Regression - Ordinary Least Squares | |||||
| Variable | Parameter | S.D. | T-STAT H0: parameter = 0 | 2-tail p-value | 1-tail p-value |
| (Intercept) | -0.817116564417187 | 0.190581 | -4.2875 | 8.9e-05 | 4.5e-05 |
| Bakmeelprijs | 4.36503067484664 | 0.35136 | 12.4232 | 0 | 0 |
| M1 | -0.00707975460122839 | 0.025531 | -0.2773 | 0.782766 | 0.391383 |
| M2 | 0.00419018404907976 | 0.025463 | 0.1646 | 0.869998 | 0.434999 |
| M3 | -0.00253987730061343 | 0.025415 | -0.0999 | 0.920819 | 0.46041 |
| M4 | 0.00819018404907986 | 0.025463 | 0.3216 | 0.749147 | 0.374573 |
| M5 | -0.0092699386503067 | 0.025386 | -0.3652 | 0.716626 | 0.358313 |
| M6 | -0.000539877300613433 | 0.025415 | -0.0212 | 0.983142 | 0.491571 |
| M7 | 0.00346012269938658 | 0.025415 | 0.1361 | 0.892287 | 0.446144 |
| M8 | -0.0127300613496933 | 0.025386 | -0.5015 | 0.618383 | 0.309192 |
| M9 | 0.0067300613496933 | 0.025386 | 0.2651 | 0.792082 | 0.396041 |
| M10 | 0.0174601226993866 | 0.025415 | 0.687 | 0.495455 | 0.247727 |
| M11 | 3.07197928500461e-17 | 0.025376 | 0 | 1 | 0.5 |
| Multiple Linear Regression - Regression Statistics | |
| Multiple R | 0.879042679543587 |
| R-squared | 0.77271603245917 |
| Adjusted R-squared | 0.71468608329981 |
| F-TEST (value) | 13.3158143967549 |
| F-TEST (DF numerator) | 12 |
| F-TEST (DF denominator) | 47 |
| p-value | 2.39830377779526e-11 |
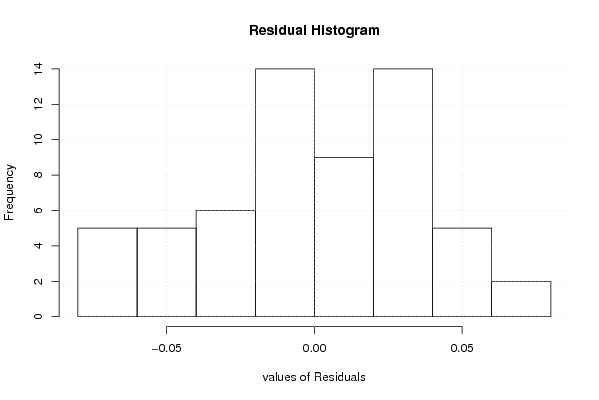
| Multiple Linear Regression - Residual Statistics | |
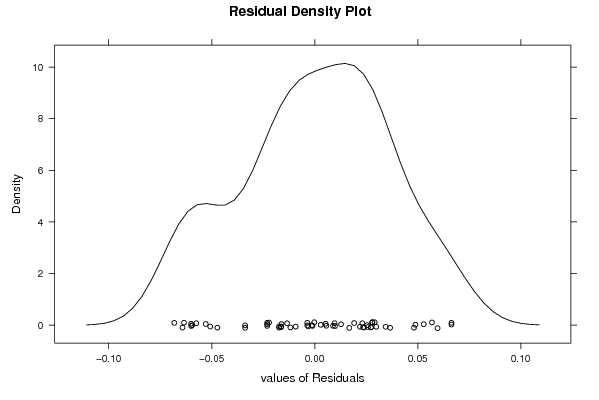
| Residual Standard Deviation | 0.0401228045698134 |
| Sum Squared Residuals | 0.0756624539877296 |
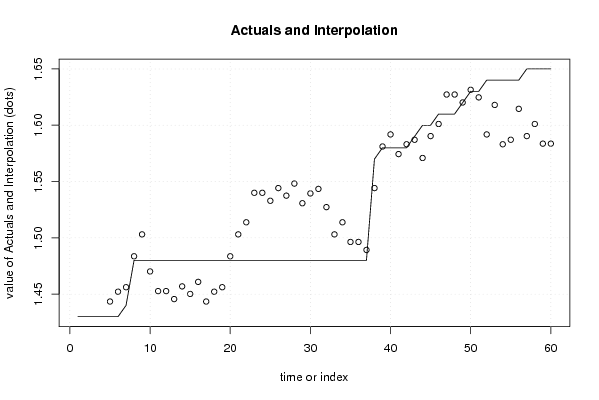
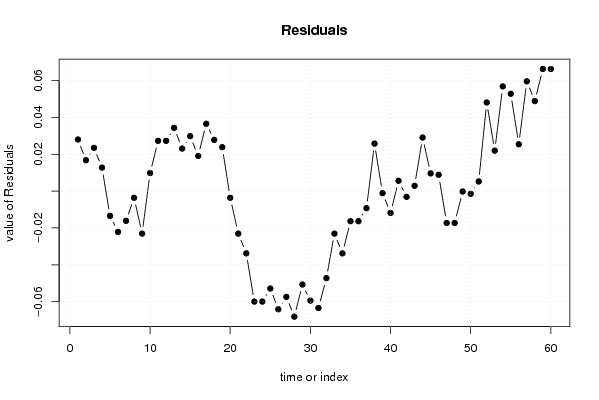
| Multiple Linear Regression - Actuals, Interpolation, and Residuals | |||
| Time or Index | Actuals | Interpolation Forecast | Residuals Prediction Error |
| 1 | 1.43 | 1.40196932515338 | 0.0280306748466199 |
| 2 | 1.43 | 1.41323926380368 | 0.0167607361963190 |
| 3 | 1.43 | 1.40650920245399 | 0.0234907975460126 |
| 4 | 1.43 | 1.41723926380368 | 0.0127607361963194 |
| 5 | 1.43 | 1.44342944785276 | -0.0134294478527605 |
| 6 | 1.43 | 1.45215950920245 | -0.0221595092024538 |
| 7 | 1.44 | 1.45615950920245 | -0.0161595092024538 |
| 8 | 1.48 | 1.48361963190184 | -0.00361963190184033 |
| 9 | 1.48 | 1.50307975460123 | -0.0230797546012269 |
| 10 | 1.48 | 1.47015950920245 | 0.00984049079754623 |
| 11 | 1.48 | 1.45269938650307 | 0.0273006134969328 |
| 12 | 1.48 | 1.45269938650307 | 0.0273006134969328 |
| 13 | 1.48 | 1.44561963190184 | 0.0343803680981612 |
| 14 | 1.48 | 1.45688957055215 | 0.0231104294478531 |
| 15 | 1.48 | 1.45015950920245 | 0.0298404907975462 |
| 16 | 1.48 | 1.46088957055215 | 0.0191104294478530 |
| 17 | 1.48 | 1.44342944785276 | 0.0365705521472395 |
| 18 | 1.48 | 1.45215950920245 | 0.0278404907975463 |
| 19 | 1.48 | 1.45615950920245 | 0.0238404907975462 |
| 20 | 1.48 | 1.48361963190184 | -0.00361963190184032 |
| 21 | 1.48 | 1.50307975460123 | -0.0230797546012269 |
| 22 | 1.48 | 1.51380981595092 | -0.0338098159509202 |
| 23 | 1.48 | 1.54 | -0.06 |
| 24 | 1.48 | 1.54 | -0.06 |
| 25 | 1.48 | 1.53292024539877 | -0.0529202453987716 |
| 26 | 1.48 | 1.54419018404908 | -0.0641901840490798 |
| 27 | 1.48 | 1.53746012269939 | -0.0574601226993866 |
| 28 | 1.48 | 1.54819018404908 | -0.0681901840490799 |
| 29 | 1.48 | 1.53073006134969 | -0.0507300613496933 |
| 30 | 1.48 | 1.53946012269939 | -0.0594601226993866 |
| 31 | 1.48 | 1.54346012269939 | -0.0634601226993866 |
| 32 | 1.48 | 1.52726993865031 | -0.0472699386503067 |
| 33 | 1.48 | 1.50307975460123 | -0.0230797546012269 |
| 34 | 1.48 | 1.51380981595092 | -0.0338098159509202 |
| 35 | 1.48 | 1.49634969325153 | -0.0163496932515336 |
| 36 | 1.48 | 1.49634969325153 | -0.0163496932515336 |
| 37 | 1.48 | 1.48926993865031 | -0.0092699386503052 |
| 38 | 1.57 | 1.54419018404908 | 0.0258098159509203 |
| 39 | 1.58 | 1.58111042944785 | -0.00111042944785288 |
| 40 | 1.58 | 1.59184049079755 | -0.0118404907975461 |
| 41 | 1.58 | 1.57438036809816 | 0.0056196319018404 |
| 42 | 1.58 | 1.58311042944785 | -0.00311042944785286 |
| 43 | 1.59 | 1.58711042944785 | 0.00288957055214713 |
| 44 | 1.6 | 1.57092024539877 | 0.0290797546012270 |
| 45 | 1.6 | 1.59038036809816 | 0.0096196319018404 |
| 46 | 1.61 | 1.60111042944785 | 0.00888957055214713 |
| 47 | 1.61 | 1.62730061349693 | -0.0173006134969327 |
| 48 | 1.61 | 1.62730061349693 | -0.0173006134969327 |
| 49 | 1.62 | 1.62022085889570 | -0.000220858895704272 |
| 50 | 1.63 | 1.63149079754601 | -0.00149079754601264 |
| 51 | 1.63 | 1.62476073619632 | 0.00523926380368055 |
| 52 | 1.64 | 1.59184049079755 | 0.0481595092024537 |
| 53 | 1.64 | 1.61803067484663 | 0.0219693251533738 |
| 54 | 1.64 | 1.58311042944785 | 0.056889570552147 |
| 55 | 1.64 | 1.58711042944785 | 0.052889570552147 |
| 56 | 1.64 | 1.61457055214724 | 0.0254294478527604 |
| 57 | 1.65 | 1.59038036809816 | 0.0596196319018402 |
| 58 | 1.65 | 1.60111042944785 | 0.048889570552147 |
| 59 | 1.65 | 1.58365030674847 | 0.0663496932515335 |
| 60 | 1.65 | 1.58365030674847 | 0.0663496932515335 |
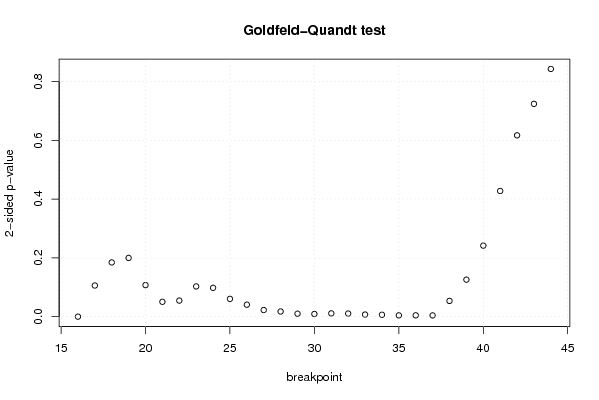
| Goldfeld-Quandt test for Heteroskedasticity | |||
| p-values | Alternative Hypothesis | ||
| breakpoint index | greater | 2-sided | less |
| 16 | 9.09830190722437e-41 | 1.81966038144487e-40 | 1 |
| 17 | 0.0529772391907858 | 0.105954478381572 | 0.947022760809214 |
| 18 | 0.0922338824274767 | 0.184467764854953 | 0.907766117572523 |
| 19 | 0.0999237697105454 | 0.199847539421091 | 0.900076230289455 |
| 20 | 0.0536783156836692 | 0.107356631367338 | 0.94632168431633 |
| 21 | 0.0252712073270077 | 0.0505424146540155 | 0.974728792672992 |
| 22 | 0.0273194909039926 | 0.0546389818079853 | 0.972680509096007 |
| 23 | 0.0514336776896875 | 0.102867355379375 | 0.948566322310313 |
| 24 | 0.0490441837146739 | 0.0980883674293477 | 0.950955816285326 |
| 25 | 0.0302574617926899 | 0.0605149235853799 | 0.96974253820731 |
| 26 | 0.0203649048124582 | 0.0407298096249165 | 0.979635095187542 |
| 27 | 0.0112551006822571 | 0.0225102013645143 | 0.988744899317743 |
| 28 | 0.00877346009045352 | 0.0175469201809070 | 0.991226539909546 |
| 29 | 0.00502845269630191 | 0.0100569053926038 | 0.994971547303698 |
| 30 | 0.00455428890504904 | 0.00910857781009808 | 0.99544571109495 |
| 31 | 0.00554133737437694 | 0.0110826747487539 | 0.994458662625623 |
| 32 | 0.00528106890672979 | 0.0105621378134596 | 0.99471893109327 |
| 33 | 0.00357076754403276 | 0.00714153508806552 | 0.996429232455967 |
| 34 | 0.00321505498096523 | 0.00643010996193045 | 0.996784945019035 |
| 35 | 0.00216332986811938 | 0.00432665973623876 | 0.99783667013188 |
| 36 | 0.00224143320389850 | 0.00448286640779699 | 0.997758566796102 |
| 37 | 0.00216984335181859 | 0.00433968670363718 | 0.997830156648181 |
| 38 | 0.0268079444647863 | 0.0536158889295725 | 0.973192055535214 |
| 39 | 0.0629778596450452 | 0.125955719290090 | 0.937022140354955 |
| 40 | 0.120846704990485 | 0.241693409980970 | 0.879153295009515 |
| 41 | 0.213817255574354 | 0.427634511148708 | 0.786182744425646 |
| 42 | 0.308491809087187 | 0.616983618174375 | 0.691508190912813 |
| 43 | 0.362035707143125 | 0.724071414286251 | 0.637964292856875 |
| 44 | 0.578565933736128 | 0.842868132527745 | 0.421434066263872 |
| Meta Analysis of Goldfeld-Quandt test for Heteroskedasticity | |||
| Description | # significant tests | % significant tests | OK/NOK |
| 1% type I error level | 7 | 0.241379310344828 | NOK |
| 5% type I error level | 13 | 0.448275862068966 | NOK |
| 10% type I error level | 18 | 0.620689655172414 | NOK |