| Multiple Linear Regression - Estimated Regression Equation |
| Y[t] = + 38700.4448705963 -357.374472052318X[t] + 0.855647370845933Y1[t] + 0.0401402690200562Y2[t] -3281.03169319582M1[t] -3516.7130856408M2[t] -5821.00541143949M3[t] -2989.17761744896M4[t] + 20876.6717415511M5[t] + 5718.67789938775M6[t] + 908.13223657077M7[t] -4151.43097655575M8[t] -5064.07466478773M9[t] + 2531.01839913112M10[t] + 3396.50452876132M11[t] -78.2294747601183t + e[t] |
| Multiple Linear Regression - Ordinary Least Squares | |||||
| Variable | Parameter | S.D. | T-STAT H0: parameter = 0 | 2-tail p-value | 1-tail p-value |
| (Intercept) | 38700.4448705963 | 12104.709906 | 3.1971 | 0.002385 | 0.001192 |
| X | -357.374472052318 | 86.779454 | -4.1182 | 0.00014 | 7e-05 |
| Y1 | 0.855647370845933 | 0.150132 | 5.6993 | 1e-06 | 0 |
| Y2 | 0.0401402690200562 | 0.14173 | 0.2832 | 0.778158 | 0.389079 |
| M1 | -3281.03169319582 | 2079.842465 | -1.5775 | 0.120855 | 0.060427 |
| M2 | -3516.7130856408 | 2282.880196 | -1.5405 | 0.129628 | 0.064814 |
| M3 | -5821.00541143949 | 2148.087604 | -2.7099 | 0.009145 | 0.004572 |
| M4 | -2989.17761744896 | 2406.723714 | -1.242 | 0.219914 | 0.109957 |
| M5 | 20876.6717415511 | 2148.958423 | 9.7148 | 0 | 0 |
| M6 | 5718.67789938775 | 3465.391881 | 1.6502 | 0.105043 | 0.052521 |
| M7 | 908.13223657077 | 2075.026862 | 0.4376 | 0.663489 | 0.331745 |
| M8 | -4151.43097655575 | 2155.721403 | -1.9258 | 0.059716 | 0.029858 |
| M9 | -5064.07466478773 | 2367.82398 | -2.1387 | 0.037271 | 0.018635 |
| M10 | 2531.01839913112 | 2373.771239 | 1.0662 | 0.291335 | 0.145668 |
| M11 | 3396.50452876132 | 2125.042774 | 1.5983 | 0.116149 | 0.058075 |
| t | -78.2294747601183 | 32.387464 | -2.4154 | 0.019339 | 0.009669 |
| Multiple Linear Regression - Regression Statistics | |
| Multiple R | 0.986040149162972 |
| R-squared | 0.972275175761335 |
| Adjusted R-squared | 0.96412081569114 |
| F-TEST (value) | 119.233780136229 |
| F-TEST (DF numerator) | 15 |
| F-TEST (DF denominator) | 51 |
| p-value | 0 |
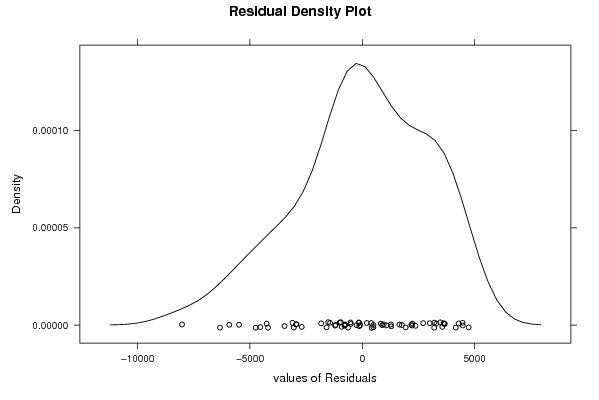
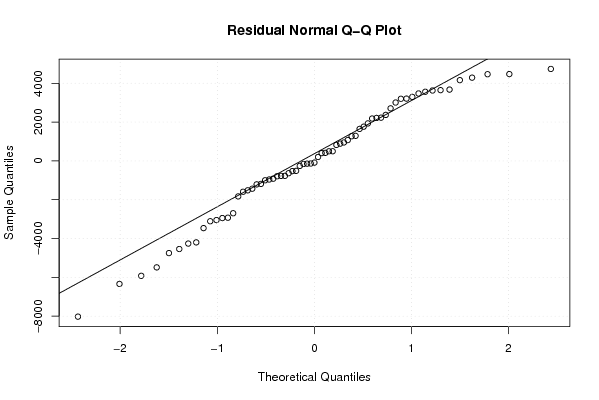
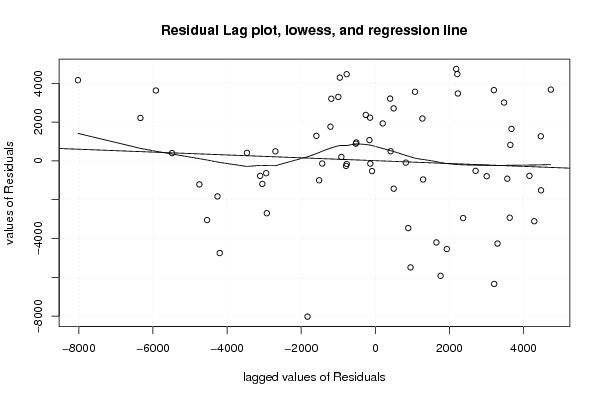
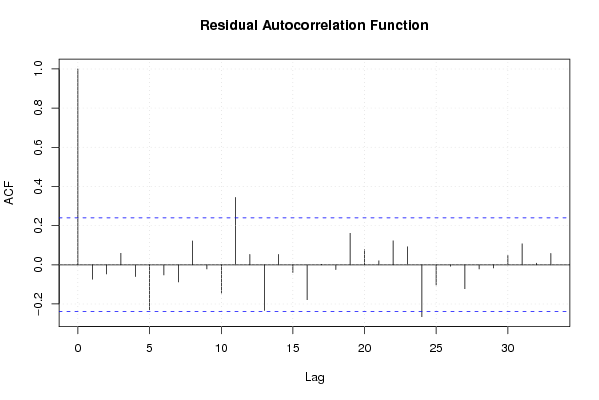
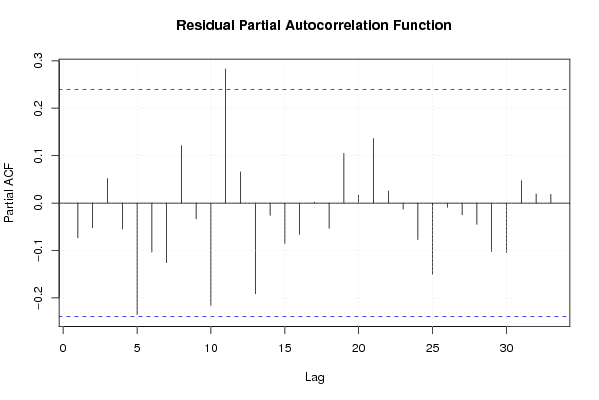
| Multiple Linear Regression - Residual Statistics | |
| Residual Standard Deviation | 3345.57670827937 |
| Sum Squared Residuals | 570837059.060053 |
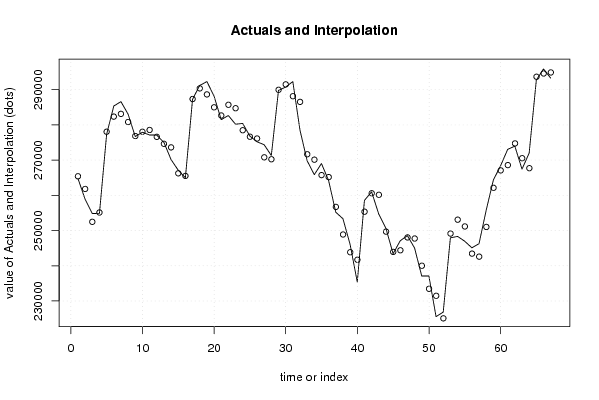
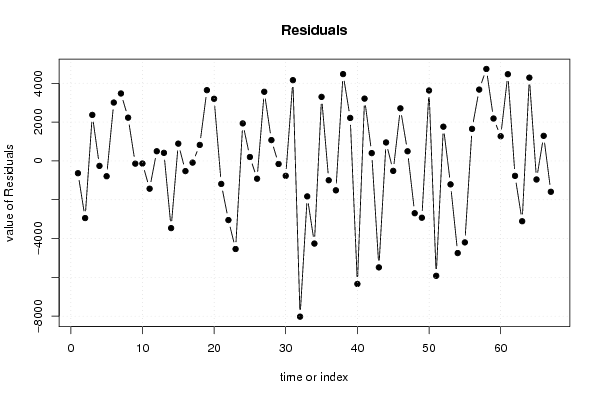
| Multiple Linear Regression - Actuals, Interpolation, and Residuals | |||
| Time or Index | Actuals | Interpolation Forecast | Residuals Prediction Error |
| 1 | 264777 | 265411.542353513 | -634.542353513001 |
| 2 | 258863 | 261808.350434387 | -2945.3504343871 |
| 3 | 254844 | 252474.734565891 | 2369.26543410906 |
| 4 | 254868 | 255125.84127123 | -257.841271230105 |
| 5 | 277267 | 278057.924007074 | -790.924007074084 |
| 6 | 285351 | 282345.683988238 | 3005.3160117625 |
| 7 | 286602 | 283128.817250045 | 3473.18274995475 |
| 8 | 283042 | 280815.431246054 | 2226.56875394572 |
| 9 | 276687 | 276828.668919395 | -141.668919394760 |
| 10 | 277915 | 278050.245165012 | -135.245165011543 |
| 11 | 277128 | 278561.021965501 | -1433.02196550102 |
| 12 | 277103 | 276606.432563794 | 496.567436205625 |
| 13 | 275037 | 274623.687708058 | 413.312291942228 |
| 14 | 270150 | 273613.129282116 | -3463.12928211643 |
| 15 | 267140 | 266251.380040333 | 888.619959666526 |
| 16 | 264993 | 265518.565334512 | -525.565334511973 |
| 17 | 287259 | 287348.288103795 | -89.2881037952946 |
| 18 | 291186 | 290362.979044437 | 823.02095556329 |
| 19 | 292300 | 288655.970946015 | 3644.02905398478 |
| 20 | 288186 | 284986.374737745 | 3199.62526225498 |
| 21 | 281477 | 282664.331383095 | -1187.33138309501 |
| 22 | 282656 | 285705.017582709 | -3049.01758270913 |
| 23 | 280190 | 284730.160118585 | -4540.16011858479 |
| 24 | 280408 | 278477.976131627 | 1930.02386837271 |
| 25 | 276836 | 276635.758075322 | 200.241924678429 |
| 26 | 275216 | 276133.22115452 | -917.221154519716 |
| 27 | 274352 | 270791.671684042 | 3560.32831595841 |
| 28 | 271311 | 270239.342134682 | 1071.65786531760 |
| 29 | 289802 | 289960.759283537 | -158.759283537221 |
| 30 | 290726 | 291496.368358993 | -770.368358992896 |
| 31 | 292300 | 288140.445106527 | 4159.5548934727 |
| 32 | 278506 | 286530.777821241 | -8024.7778212406 |
| 33 | 269826 | 271656.038775923 | -1830.03877592337 |
| 34 | 265861 | 270120.06489912 | -4259.06489911978 |
| 35 | 269034 | 265736.764305282 | 3297.23569471762 |
| 36 | 264176 | 265175.217714843 | -999.217714842883 |
| 37 | 255198 | 256714.463276761 | -1516.46327676108 |
| 38 | 253353 | 248880.923359254 | 4472.07664074592 |
| 39 | 246057 | 243844.603880118 | 2212.39611988217 |
| 40 | 235372 | 241710.838073524 | -6338.83807352357 |
| 41 | 258556 | 255348.2534534 | 3207.74654660028 |
| 42 | 260993 | 260592.583423846 | 400.416576153945 |
| 43 | 254663 | 260149.130814191 | -5486.13081419076 |
| 44 | 250643 | 249692.912104451 | 950.087895548771 |
| 45 | 243422 | 243936.125191605 | -514.125191604582 |
| 46 | 247105 | 244398.246290320 | 2706.75370968044 |
| 47 | 248541 | 248046.999329421 | 494.000670578608 |
| 48 | 245039 | 247735.683921497 | -2696.68392149716 |
| 49 | 237080 | 240008.089198942 | -2928.08919894229 |
| 50 | 237085 | 233458.258629171 | 3626.74137082918 |
| 51 | 225554 | 231475.287608440 | -5921.28760844024 |
| 52 | 226839 | 225077.365739896 | 1761.63426010406 |
| 53 | 247934 | 249144.260581550 | -1210.26058155028 |
| 54 | 248333 | 253081.622214470 | -4748.62221446953 |
| 55 | 246969 | 251167.881713100 | -4198.88171309964 |
| 56 | 245098 | 243449.504090509 | 1648.49590949112 |
| 57 | 246263 | 242589.835729982 | 3673.16427001772 |
| 58 | 255765 | 251028.42606284 | 4736.57393716001 |
| 59 | 264319 | 262137.054281210 | 2181.94571878959 |
| 60 | 268347 | 267077.689668238 | 1269.31033176171 |
| 61 | 273046 | 268580.459387404 | 4465.54061259572 |
| 62 | 273963 | 274736.117140552 | -773.117140551849 |
| 63 | 267430 | 270539.322221176 | -3109.32222117593 |
| 64 | 271993 | 267704.047446156 | 4288.95255384398 |
| 65 | 292710 | 293668.514570643 | -958.514570643393 |
| 66 | 295881 | 294590.762970017 | 1290.23702998269 |
| 67 | 293299 | 294890.754170122 | -1591.75417012184 |
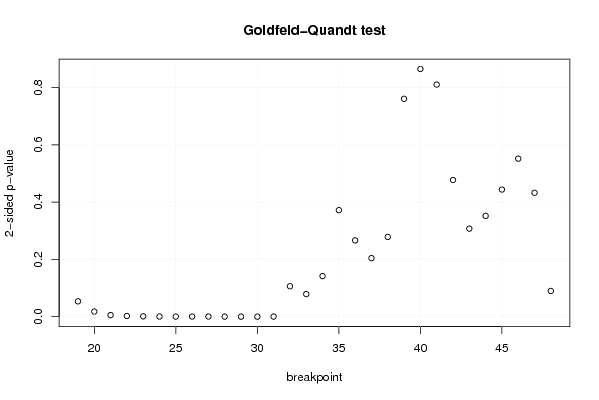
| Goldfeld-Quandt test for Heteroskedasticity | |||
| p-values | Alternative Hypothesis | ||
| breakpoint index | greater | 2-sided | less |
| 19 | 0.0268048603408347 | 0.0536097206816693 | 0.973195139659165 |
| 20 | 0.00888050386709873 | 0.0177610077341975 | 0.991119496132901 |
| 21 | 0.00267390253593636 | 0.00534780507187272 | 0.997326097464064 |
| 22 | 0.00123002983133951 | 0.00246005966267902 | 0.99876997016866 |
| 23 | 0.000605231439091229 | 0.00121046287818246 | 0.999394768560909 |
| 24 | 0.00030069865810754 | 0.00060139731621508 | 0.999699301341892 |
| 25 | 8.2610373773177e-05 | 0.000165220747546354 | 0.999917389626227 |
| 26 | 0.000278331308391881 | 0.000556662616783762 | 0.999721668691608 |
| 27 | 0.000314389322885023 | 0.000628778645770046 | 0.999685610677115 |
| 28 | 0.000114358107751812 | 0.000228716215503624 | 0.999885641892248 |
| 29 | 3.88131572442882e-05 | 7.76263144885764e-05 | 0.999961186842756 |
| 30 | 4.65425799582758e-05 | 9.30851599165517e-05 | 0.999953457420042 |
| 31 | 0.000175083915008972 | 0.000350167830017944 | 0.999824916084991 |
| 32 | 0.0530987724496575 | 0.106197544899315 | 0.946901227550343 |
| 33 | 0.0393941069133485 | 0.078788213826697 | 0.960605893086651 |
| 34 | 0.0707997573252944 | 0.141599514650589 | 0.929200242674706 |
| 35 | 0.185982650032092 | 0.371965300064184 | 0.814017349967908 |
| 36 | 0.133225166264555 | 0.266450332529111 | 0.866774833735445 |
| 37 | 0.102169022884274 | 0.204338045768548 | 0.897830977115726 |
| 38 | 0.139251271252852 | 0.278502542505705 | 0.860748728747148 |
| 39 | 0.380340299677466 | 0.760680599354933 | 0.619659700322533 |
| 40 | 0.567532857117105 | 0.86493428576579 | 0.432467142882895 |
| 41 | 0.594819939103072 | 0.810360121793856 | 0.405180060896928 |
| 42 | 0.761431369922407 | 0.477137260155185 | 0.238568630077593 |
| 43 | 0.846337746717805 | 0.307324506564389 | 0.153662253282195 |
| 44 | 0.824086546252655 | 0.351826907494689 | 0.175913453747345 |
| 45 | 0.778059570073201 | 0.443880859853599 | 0.221940429926799 |
| 46 | 0.724107375925224 | 0.551785248149552 | 0.275892624074776 |
| 47 | 0.783687312195525 | 0.432625375608950 | 0.216312687804475 |
| 48 | 0.955077021348614 | 0.0898459573027725 | 0.0449229786513863 |
| Meta Analysis of Goldfeld-Quandt test for Heteroskedasticity | |||
| Description | # significant tests | % significant tests | OK/NOK |
| 1% type I error level | 11 | 0.366666666666667 | NOK |
| 5% type I error level | 12 | 0.4 | NOK |
| 10% type I error level | 15 | 0.5 | NOK |