| Multiple Linear Regression - Estimated Regression Equation |
| Y[t] = + 53.8696872319329 + 15.8488814290603X[t] + 0.133329923008086Y1[t] + 0.0532221071152637Y2[t] + 0.273745155025843Y3[t] + 0.0670592193928907Y4[t] -18.6035909016196M1[t] -3.10158370166338M2[t] -11.8809514270766M3[t] -7.94282530553286M4[t] + 3.99151966561568M5[t] -10.0326693378833M6[t] -3.40836044891388M7[t] + 0.564263857054042M8[t] -18.5636243442575M9[t] -9.04511375520523M10[t] -9.35771026063743M11[t] -0.174195328979543t + e[t] |
| Multiple Linear Regression - Ordinary Least Squares | |||||
| Variable | Parameter | S.D. | T-STAT H0: parameter = 0 | 2-tail p-value | 1-tail p-value |
| (Intercept) | 53.8696872319329 | 22.794464 | 2.3633 | 0.023333 | 0.011666 |
| X | 15.8488814290603 | 5.162977 | 3.0697 | 0.003943 | 0.001971 |
| Y1 | 0.133329923008086 | 0.142827 | 0.9335 | 0.356451 | 0.178226 |
| Y2 | 0.0532221071152637 | 0.133863 | 0.3976 | 0.693159 | 0.34658 |
| Y3 | 0.273745155025843 | 0.131522 | 2.0814 | 0.04419 | 0.022095 |
| Y4 | 0.0670592193928907 | 0.141487 | 0.474 | 0.638241 | 0.31912 |
| M1 | -18.6035909016196 | 8.435979 | -2.2053 | 0.033559 | 0.016779 |
| M2 | -3.10158370166338 | 8.170224 | -0.3796 | 0.706341 | 0.35317 |
| M3 | -11.8809514270766 | 8.303704 | -1.4308 | 0.16066 | 0.08033 |
| M4 | -7.94282530553286 | 7.447672 | -1.0665 | 0.292934 | 0.146467 |
| M5 | 3.99151966561568 | 8.380269 | 0.4763 | 0.636588 | 0.318294 |
| M6 | -10.0326693378833 | 7.867426 | -1.2752 | 0.209974 | 0.104987 |
| M7 | -3.40836044891388 | 8.056909 | -0.423 | 0.674654 | 0.337327 |
| M8 | 0.564263857054042 | 8.458629 | 0.0667 | 0.947163 | 0.473582 |
| M9 | -18.5636243442575 | 8.116399 | -2.2872 | 0.027844 | 0.013922 |
| M10 | -9.04511375520523 | 8.747493 | -1.034 | 0.307661 | 0.153831 |
| M11 | -9.35771026063743 | 8.863449 | -1.0558 | 0.297742 | 0.148871 |
| t | -0.174195328979543 | 0.126072 | -1.3817 | 0.175129 | 0.087564 |
| Multiple Linear Regression - Regression Statistics | |
| Multiple R | 0.829265907056123 |
| R-squared | 0.687681944605614 |
| Adjusted R-squared | 0.547960709297599 |
| F-TEST (value) | 4.92181408996007 |
| F-TEST (DF numerator) | 17 |
| F-TEST (DF denominator) | 38 |
| p-value | 2.20257367186116e-05 |
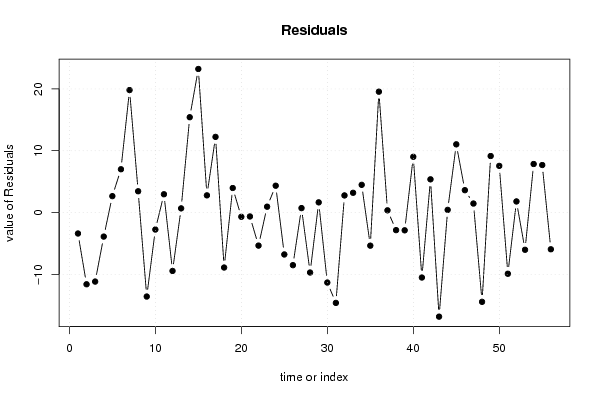
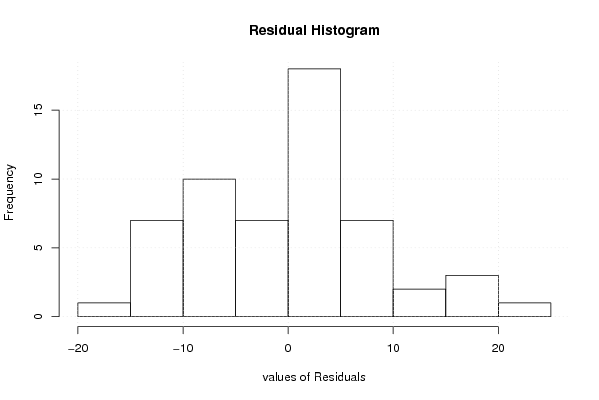
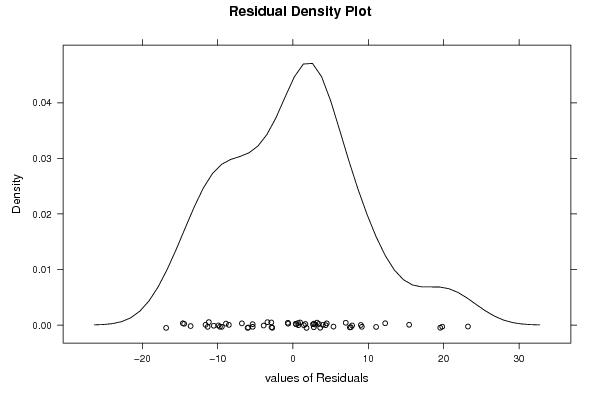
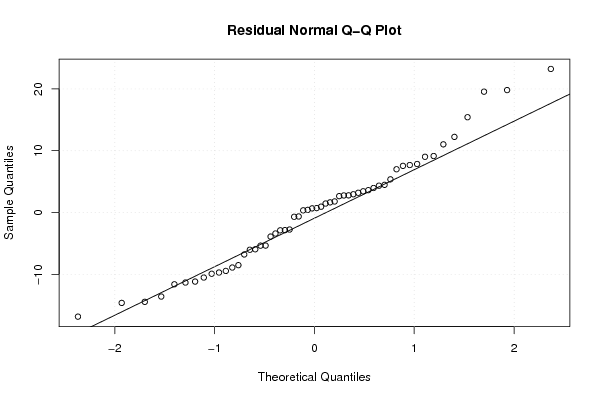
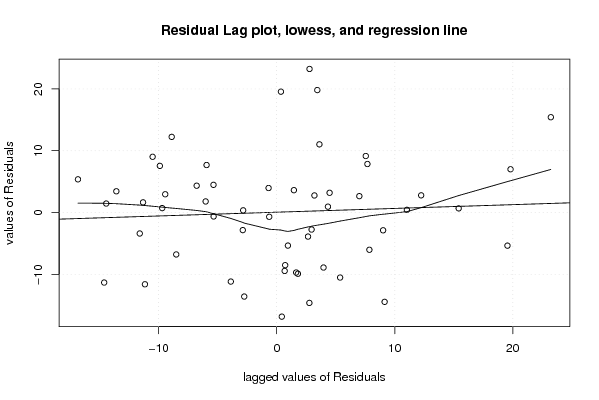
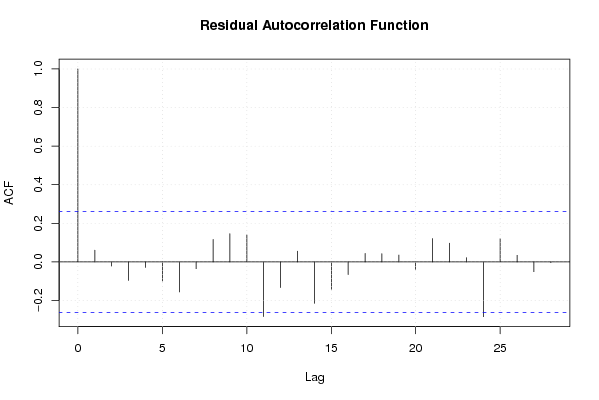
| Multiple Linear Regression - Residual Statistics | |
| Residual Standard Deviation | 10.7884149852318 |
| Sum Squared Residuals | 4422.81611995582 |
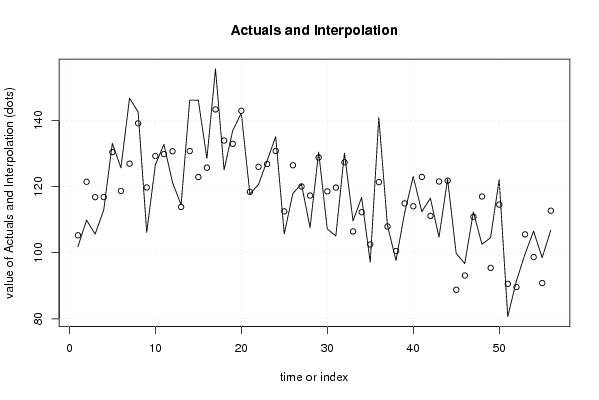
| Multiple Linear Regression - Actuals, Interpolation, and Residuals | |||
| Time or Index | Actuals | Interpolation Forecast | Residuals Prediction Error |
| 1 | 101.8612953 | 105.252313252722 | -3.39101795272242 |
| 2 | 109.8419174 | 121.447516902636 | -11.6055995026361 |
| 3 | 105.6348802 | 116.800847797100 | -11.1659675971001 |
| 4 | 112.927078 | 116.816622066248 | -3.88954406624821 |
| 5 | 133.0698623 | 130.417212862257 | 2.65264943774267 |
| 6 | 125.6756757 | 118.676088779866 | 6.99958692013424 |
| 7 | 146.736359 | 126.926460620036 | 19.8098983799643 |
| 8 | 142.5803162 | 139.142373391638 | 3.43794280836247 |
| 9 | 106.1448241 | 119.733695571768 | -13.5888714717678 |
| 10 | 126.5170831 | 129.268287753776 | -2.75120465377585 |
| 11 | 132.7893932 | 129.833170381390 | 2.95622281860982 |
| 12 | 121.2391637 | 130.684486067153 | -9.44532236715297 |
| 13 | 114.5079041 | 113.834005726355 | 0.673898373644709 |
| 14 | 146.1499235 | 130.732774007966 | 15.4171494920339 |
| 15 | 146.1244263 | 122.898583998578 | 23.2258423014216 |
| 16 | 128.5058644 | 125.725971120480 | 2.77989327952023 |
| 17 | 155.5838858 | 143.346138737976 | 12.2377470620241 |
| 18 | 125.0382458 | 133.935277311324 | -8.89703151132393 |
| 19 | 136.8944416 | 132.929186616325 | 3.9652549836753 |
| 20 | 142.2233554 | 142.913688100608 | -0.690332700608349 |
| 21 | 117.7715451 | 118.407229980460 | -0.635684880459542 |
| 22 | 120.627231 | 125.972212659928 | -5.34498165992803 |
| 23 | 127.7664457 | 126.818623909367 | 0.947821790632525 |
| 24 | 135.1096379 | 130.769783606576 | 4.3398542934241 |
| 25 | 105.7113717 | 112.493039544058 | -6.7816678440582 |
| 26 | 117.9245283 | 126.437828509954 | -8.51330020995356 |
| 27 | 120.754717 | 120.036920464059 | 0.71779653594113 |
| 28 | 107.572667 | 117.273005825247 | -9.70033882524707 |
| 29 | 130.4436512 | 128.798090025921 | 1.64556117407938 |
| 30 | 107.2157063 | 118.541270971202 | -11.3255646712015 |
| 31 | 105.0739419 | 119.692914321110 | -14.6189724211104 |
| 32 | 130.1121877 | 127.346384976435 | 2.76580272356536 |
| 33 | 109.6379398 | 106.443832586220 | 3.19410721378048 |
| 34 | 116.7261601 | 112.246960669281 | 4.47919943071924 |
| 35 | 97.11881693 | 102.477150087142 | -5.35833315714248 |
| 36 | 140.8975013 | 121.346869965567 | 19.5506313344331 |
| 37 | 108.2865885 | 107.929927116026 | 0.356661383973961 |
| 38 | 97.65425803 | 100.498756218487 | -2.8444981884867 |
| 39 | 112.0346762 | 114.910194908369 | -2.87551870836887 |
| 40 | 123.0494646 | 114.034275737134 | 9.01518886286626 |
| 41 | 112.4171341 | 122.930971115977 | -10.5138370159773 |
| 42 | 116.4966854 | 111.124783244252 | 5.3719021557483 |
| 43 | 104.6914839 | 121.532532607381 | -16.8410487073806 |
| 44 | 122.2335543 | 121.802191444423 | 0.431362855576731 |
| 45 | 99.79602244 | 88.7655733015532 | 11.0304491384468 |
| 46 | 96.71086181 | 93.0938749270153 | 3.61698688298465 |
| 47 | 112.3151453 | 110.860856752100 | 1.45428854790014 |
| 48 | 102.5497195 | 116.994882760704 | -14.4451632607043 |
| 49 | 104.5385008 | 95.396374760838 | 9.14212603916197 |
| 50 | 122.0805711 | 114.534322690958 | 7.54624840904241 |
| 51 | 80.64762876 | 90.5497812918938 | -9.90215253189376 |
| 52 | 91.40744518 | 89.6126444308912 | 1.7948007491088 |
| 53 | 99.51555329 | 105.537673947869 | -6.02212065786882 |
| 54 | 106.527282 | 98.676174893357 | 7.85110710664293 |
| 55 | 98.49566548 | 90.8107977151485 | 7.68486776485149 |
| 56 | 106.7567568 | 112.701532486896 | -5.94477568689619 |
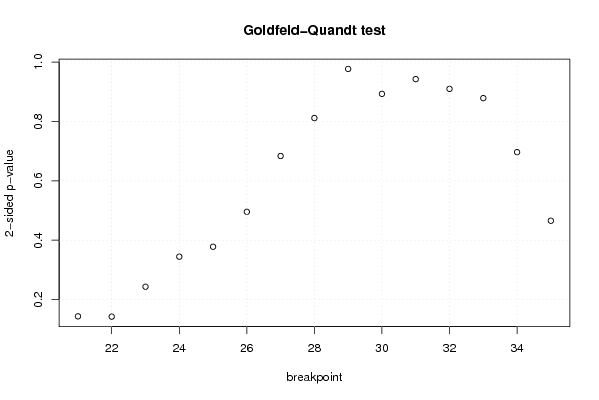
| Goldfeld-Quandt test for Heteroskedasticity | |||
| p-values | Alternative Hypothesis | ||
| breakpoint index | greater | 2-sided | less |
| 21 | 0.928239601615206 | 0.143520796769588 | 0.0717603983847939 |
| 22 | 0.928767890427032 | 0.142464219145937 | 0.0712321095729685 |
| 23 | 0.878340022418805 | 0.243319955162390 | 0.121659977581195 |
| 24 | 0.82777064227862 | 0.344458715442759 | 0.172229357721379 |
| 25 | 0.811051026809998 | 0.377897946380003 | 0.188948973190002 |
| 26 | 0.752190062655804 | 0.495619874688392 | 0.247809937344196 |
| 27 | 0.658220725469022 | 0.683558549061955 | 0.341779274530978 |
| 28 | 0.594333300686514 | 0.811333398626973 | 0.405666699313486 |
| 29 | 0.48837974109318 | 0.97675948218636 | 0.51162025890682 |
| 30 | 0.446401505846252 | 0.892803011692504 | 0.553598494153748 |
| 31 | 0.47124142380337 | 0.94248284760674 | 0.52875857619663 |
| 32 | 0.45479924784171 | 0.90959849568342 | 0.54520075215829 |
| 33 | 0.439264208038213 | 0.878528416076427 | 0.560735791961787 |
| 34 | 0.348294809685982 | 0.696589619371965 | 0.651705190314018 |
| 35 | 0.232739428589462 | 0.465478857178924 | 0.767260571410538 |
| Meta Analysis of Goldfeld-Quandt test for Heteroskedasticity | |||
| Description | # significant tests | % significant tests | OK/NOK |
| 1% type I error level | 0 | 0 | OK |
| 5% type I error level | 0 | 0 | OK |
| 10% type I error level | 0 | 0 | OK |