| Multiple Linear Regression - Estimated Regression Equation |
| Inflatie[t] = + 0.94880597817748 + 0.547454363004362rente[t] -0.174305476439478M1[t] -0.114305476439477M2[t] -0.0526272818497814M3[t] + 0.0109490872600876M4[t] + 0.270949087260088M5[t] + 0.319196734205835M6[t] + 0.296495293891495M7[t] + 0.149122575741277M8[t] + 0.101458214659215M9[t] + 0.113502210645311M10[t] -0.0150370792322786M11[t] + e[t] |
| Multiple Linear Regression - Ordinary Least Squares | |||||
| Variable | Parameter | S.D. | T-STAT H0: parameter = 0 | 2-tail p-value | 1-tail p-value |
| (Intercept) | 0.94880597817748 | 0.72387 | 1.3107 | 0.196314 | 0.098157 |
| rente | 0.547454363004362 | 0.173988 | 3.1465 | 0.002866 | 0.001433 |
| M1 | -0.174305476439478 | 0.74143 | -0.2351 | 0.815157 | 0.407579 |
| M2 | -0.114305476439477 | 0.74143 | -0.1542 | 0.878137 | 0.439068 |
| M3 | -0.0526272818497814 | 0.741187 | -0.071 | 0.943696 | 0.471848 |
| M4 | 0.0109490872600876 | 0.741144 | 0.0148 | 0.988276 | 0.494138 |
| M5 | 0.270949087260088 | 0.741144 | 0.3656 | 0.716317 | 0.358158 |
| M6 | 0.319196734205835 | 0.741165 | 0.4307 | 0.668678 | 0.334339 |
| M7 | 0.296495293891495 | 0.74141 | 0.3999 | 0.691037 | 0.345518 |
| M8 | 0.149122575741277 | 0.741698 | 0.2011 | 0.841523 | 0.420761 |
| M9 | 0.101458214659215 | 0.741797 | 0.1368 | 0.891794 | 0.445897 |
| M10 | 0.113502210645311 | 0.741645 | 0.153 | 0.879021 | 0.439511 |
| M11 | -0.0150370792322786 | 0.741219 | -0.0203 | 0.9839 | 0.49195 |
| Multiple Linear Regression - Regression Statistics | |
| Multiple R | 0.443564739811477 |
| R-squared | 0.196749678404024 |
| Adjusted R-squared | -0.00833551008856603 |
| F-TEST (value) | 0.959355864995257 |
| F-TEST (DF numerator) | 12 |
| F-TEST (DF denominator) | 47 |
| p-value | 0.499354669494684 |
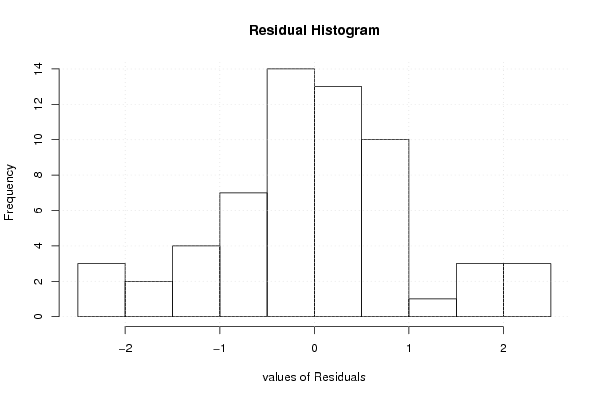
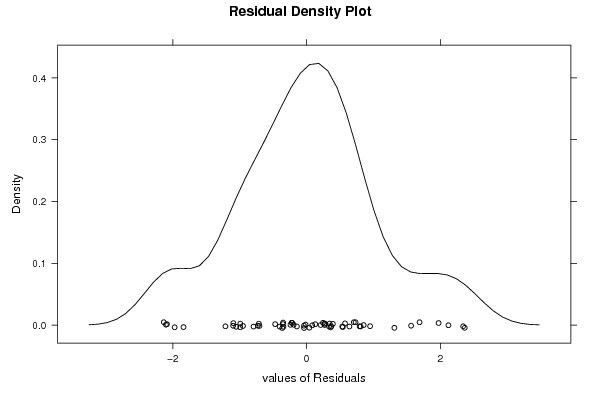
| Multiple Linear Regression - Residual Statistics | |
| Residual Standard Deviation | 1.17183823442489 |
| Sum Squared Residuals | 64.5406278400223 |
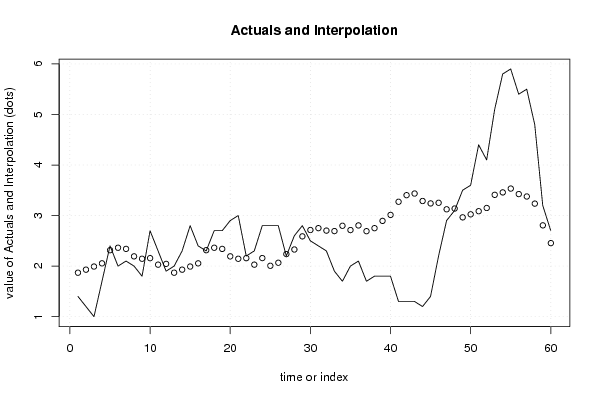
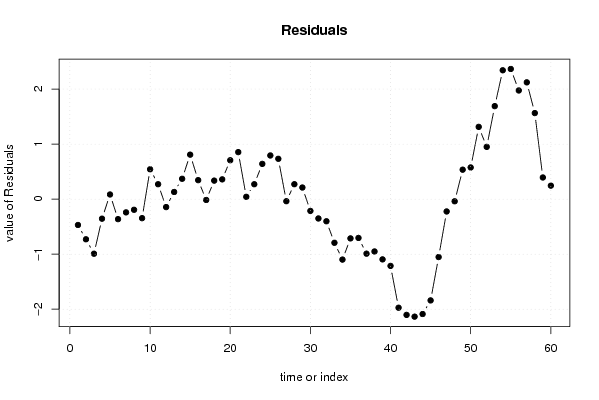
| Multiple Linear Regression - Actuals, Interpolation, and Residuals | |||
| Time or Index | Actuals | Interpolation Forecast | Residuals Prediction Error |
| 1 | 1.4 | 1.86940922774674 | -0.469409227746737 |
| 2 | 1.2 | 1.92940922774673 | -0.729409227746731 |
| 3 | 1 | 1.99108742233642 | -0.991087422336423 |
| 4 | 1.7 | 2.05466379144629 | -0.354663791446293 |
| 5 | 2.4 | 2.31466379144629 | 0.085336208553708 |
| 6 | 2 | 2.36291143839204 | -0.36291143839204 |
| 7 | 2.1 | 2.3402099980777 | -0.2402099980777 |
| 8 | 2 | 2.19283727992748 | -0.192837279927482 |
| 9 | 1.8 | 2.14517291884542 | -0.34517291884542 |
| 10 | 2.7 | 2.15721691483152 | 0.542783085168484 |
| 11 | 2.3 | 2.02867762495393 | 0.271322375046073 |
| 12 | 1.9 | 2.04371470418620 | -0.143714704186205 |
| 13 | 2 | 1.86940922774673 | 0.130590772253273 |
| 14 | 2.3 | 1.92940922774673 | 0.370590772253272 |
| 15 | 2.8 | 1.99108742233642 | 0.808912577663576 |
| 16 | 2.4 | 2.05466379144629 | 0.345336208553707 |
| 17 | 2.3 | 2.31466379144629 | -0.0146637914462926 |
| 18 | 2.7 | 2.36291143839204 | 0.33708856160796 |
| 19 | 2.7 | 2.3402099980777 | 0.3597900019223 |
| 20 | 2.9 | 2.19283727992748 | 0.707162720072518 |
| 21 | 3 | 2.14517291884542 | 0.85482708115458 |
| 22 | 2.2 | 2.15721691483152 | 0.0427830851684838 |
| 23 | 2.3 | 2.02867762495393 | 0.271322375046073 |
| 24 | 2.8 | 2.15868012041712 | 0.641319879582879 |
| 25 | 2.8 | 2.00627281849782 | 0.793727181502182 |
| 26 | 2.8 | 2.06627281849782 | 0.733727181502181 |
| 27 | 2.2 | 2.23744188568839 | -0.0374418856883864 |
| 28 | 2.6 | 2.32839097294847 | 0.271609027051527 |
| 29 | 2.8 | 2.58839097294847 | 0.211609027051527 |
| 30 | 2.5 | 2.71328223071483 | -0.213282230714831 |
| 31 | 2.4 | 2.75080077033097 | -0.350800770330971 |
| 32 | 2.3 | 2.70196983752154 | -0.401969837521538 |
| 33 | 1.9 | 2.69262728184978 | -0.792627281849782 |
| 34 | 1.7 | 2.79773851954662 | -1.09773851954662 |
| 35 | 2 | 2.71299557870938 | -0.712995578709378 |
| 36 | 2.1 | 2.80467626876227 | -0.704676268762268 |
| 37 | 1.7 | 2.69059077225327 | -0.99059077225327 |
| 38 | 1.8 | 2.75059077225327 | -0.95059077225327 |
| 39 | 1.8 | 2.89438712129362 | -1.09438712129362 |
| 40 | 1.8 | 3.01270892670393 | -1.21270892670393 |
| 41 | 1.3 | 3.27270892670392 | -1.97270892670392 |
| 42 | 1.3 | 3.40307472810033 | -2.10307472810033 |
| 43 | 1.3 | 3.43511872408642 | -2.13511872408642 |
| 44 | 1.2 | 3.28774600593620 | -2.08774600593620 |
| 45 | 1.4 | 3.24008164485414 | -1.84008164485414 |
| 46 | 2.2 | 3.25212564084024 | -1.05212564084024 |
| 47 | 2.9 | 3.12358635096265 | -0.223586350962649 |
| 48 | 3.1 | 3.13862343019493 | -0.0386234301949278 |
| 49 | 3.5 | 2.96431795375545 | 0.53568204624455 |
| 50 | 3.6 | 3.02431795375545 | 0.575682046244549 |
| 51 | 4.4 | 3.08599614834515 | 1.31400385165485 |
| 52 | 4.1 | 3.14957251745502 | 0.950427482544984 |
| 53 | 5.1 | 3.40957251745502 | 1.69042748254498 |
| 54 | 5.8 | 3.45782016440076 | 2.34217983559924 |
| 55 | 5.9 | 3.53366050942721 | 2.36633949057279 |
| 56 | 5.4 | 3.42460959668729 | 1.97539040331271 |
| 57 | 5.5 | 3.37694523560523 | 2.12305476439477 |
| 58 | 4.8 | 3.23570200995011 | 1.56429799004989 |
| 59 | 3.2 | 2.80606282042012 | 0.393937179579881 |
| 60 | 2.7 | 2.45430547643948 | 0.245694523560524 |
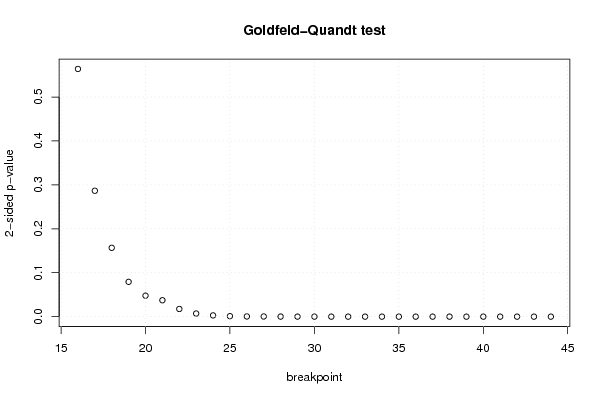
| Goldfeld-Quandt test for Heteroskedasticity | |||
| p-values | Alternative Hypothesis | ||
| breakpoint index | greater | 2-sided | less |
| 16 | 0.281987355283330 | 0.563974710566661 | 0.71801264471667 |
| 17 | 0.14332944793089 | 0.28665889586178 | 0.85667055206911 |
| 18 | 0.0783636646758306 | 0.156727329351661 | 0.92163633532417 |
| 19 | 0.0396360311480216 | 0.0792720622960432 | 0.960363968851978 |
| 20 | 0.0238664254168793 | 0.0477328508337586 | 0.97613357458312 |
| 21 | 0.0186720637229132 | 0.0373441274458264 | 0.981327936277087 |
| 22 | 0.00875301045083862 | 0.0175060209016772 | 0.991246989549161 |
| 23 | 0.00356757805837451 | 0.00713515611674902 | 0.996432421941626 |
| 24 | 0.00142544316878395 | 0.00285088633756789 | 0.998574556831216 |
| 25 | 0.000575130477490016 | 0.00115026095498003 | 0.99942486952251 |
| 26 | 0.000229836935056387 | 0.000459673870112774 | 0.999770163064944 |
| 27 | 0.000200396096535288 | 0.000400792193070577 | 0.999799603903465 |
| 28 | 8.88327004843554e-05 | 0.000177665400968711 | 0.999911167299516 |
| 29 | 3.86730824985778e-05 | 7.73461649971555e-05 | 0.999961326917501 |
| 30 | 1.95028617443509e-05 | 3.90057234887018e-05 | 0.999980497138256 |
| 31 | 1.01399014324411e-05 | 2.02798028648822e-05 | 0.999989860098567 |
| 32 | 5.7716199531706e-06 | 1.15432399063412e-05 | 0.999994228380047 |
| 33 | 3.46090948963644e-06 | 6.92181897927289e-06 | 0.99999653909051 |
| 34 | 1.79815219201476e-06 | 3.59630438402952e-06 | 0.999998201847808 |
| 35 | 5.24234058123672e-07 | 1.04846811624734e-06 | 0.999999475765942 |
| 36 | 1.52038077527634e-07 | 3.04076155055268e-07 | 0.999999847961923 |
| 37 | 3.93388972215717e-08 | 7.86777944431433e-08 | 0.999999960661103 |
| 38 | 9.23729786479997e-09 | 1.84745957295999e-08 | 0.999999990762702 |
| 39 | 2.75422225580247e-09 | 5.50844451160495e-09 | 0.999999997245778 |
| 40 | 8.18741184863495e-10 | 1.63748236972699e-09 | 0.999999999181259 |
| 41 | 1.62840713312882e-09 | 3.25681426625765e-09 | 0.999999998371593 |
| 42 | 1.10011936209979e-08 | 2.20023872419958e-08 | 0.999999988998806 |
| 43 | 1.98048392775034e-07 | 3.96096785550067e-07 | 0.999999801951607 |
| 44 | 7.71802307836185e-06 | 1.54360461567237e-05 | 0.999992281976922 |
| Meta Analysis of Goldfeld-Quandt test for Heteroskedasticity | |||
| Description | # significant tests | % significant tests | OK/NOK |
| 1% type I error level | 22 | 0.758620689655172 | NOK |
| 5% type I error level | 25 | 0.862068965517241 | NOK |
| 10% type I error level | 26 | 0.896551724137931 | NOK |