Free Statistics

of Irreproducible Research!

Author's title

Author*The author of this computation has been verified*
R Software Modulerwasp_multipleregression.wasp
Title produced by softwareMultiple Regression
Date of computationFri, 20 Nov 2009 05:29:01 -0700
Cite this page as followsStatistical Computations at FreeStatistics.org, Office for Research Development and Education, URL https://freestatistics.org/blog/index.php?v=date/2009/Nov/20/t12587204668kvy03o89ih7q0h.htm/, Retrieved Sat, 20 Apr 2024 04:38:00 +0000
Statistical Computations at FreeStatistics.org, Office for Research Development and Education, URL https://freestatistics.org/blog/index.php?pk=58085, Retrieved Sat, 20 Apr 2024 04:38:00 +0000
QR Codes:

Original text written by user:
IsPrivate?No (this computation is public)
User-defined keywords
Estimated Impact155
Family? (F = Feedback message, R = changed R code, M = changed R Module, P = changed Parameters, D = changed Data)
-     [Multiple Regression] [Q1 The Seatbeltlaw] [2007-11-14 19:27:43] [8cd6641b921d30ebe00b648d1481bba0]
- RM D  [Multiple Regression] [Seatbelt] [2009-11-12 14:06:21] [b98453cac15ba1066b407e146608df68]
-    D      [Multiple Regression] [Model 3] [2009-11-20 12:29:01] [d79e31a57591875d497c91f296c77132] [Current]
Feedback Forum

Post a new message
Dataseries X:
98.71	153.4
98.54	145
98.2	137.7
96.92	148.3
99.06	152.2
99.65	169.4
99.82	168.6
99.99	161.1
100.33	174.1
99.31	179
101.1	190.6
101.1	190
100.93	181.6
100.85	174.8
100.93	180.5
99.6	196.8
101.88	193.8
101.81	197
102.38	216.3
102.74	221.4
102.82	217.9
101.72	229.7
103.47	227.4
102.98	204.2
102.68	196.6
102.9	198.8
103.03	207.5
101.29	190.7
103.69	201.6
103.68	210.5
104.2	223.5
104.08	223.8
104.16	231.2
103.05	244
104.66	234.7
104.46	250.2
104.95	265.7
105.85	287.6
106.23	283.3
104.86	295.4
107.44	312.3
108.23	333.8
108.45	347.7
109.39	383.2
110.15	407.1
109.13	413.6
110.28	362.7
110.17	321.9
109.99	239.4
109.26	191
109.11	159.7
107.06	163.4
109.53	157.6
108.92	166.2
109.24	176.7
109.12	198.3
109	226.2
107.23	216.2
109.49	235.9
109.04	226.9


Summary of computational transaction
Raw Inputview raw input (R code)
Raw Outputview raw output of R engine
Computing time3 seconds
R Server'Gwilym Jenkins' @ 72.249.127.135

\begin{tabular}{lllllllll}
\hline
Summary of computational transaction \tabularnewline
Raw Input & view raw input (R code)  \tabularnewline
Raw Output & view raw output of R engine  \tabularnewline
Computing time & 3 seconds \tabularnewline
R Server & 'Gwilym Jenkins' @ 72.249.127.135 \tabularnewline
\hline
\end{tabular}
%Source: https://freestatistics.org/blog/index.php?pk=58085&T=0

[TABLE]
[ROW][C]Summary of computational transaction[/C][/ROW]
[ROW][C]Raw Input[/C][C]view raw input (R code) [/C][/ROW]
[ROW][C]Raw Output[/C][C]view raw output of R engine [/C][/ROW]
[ROW][C]Computing time[/C][C]3 seconds[/C][/ROW]
[ROW][C]R Server[/C][C]'Gwilym Jenkins' @ 72.249.127.135[/C][/ROW]
[/TABLE]
Source: https://freestatistics.org/blog/index.php?pk=58085&T=0

Globally Unique Identifier (entire table): ba.freestatistics.org/blog/index.php?pk=58085&T=0

As an alternative you can also use a QR Code:  

The GUIDs for individual cells are displayed in the table below:

Summary of computational transaction
Raw Inputview raw input (R code)
Raw Outputview raw output of R engine
Computing time3 seconds
R Server'Gwilym Jenkins' @ 72.249.127.135


Multiple Linear Regression - Estimated Regression Equation
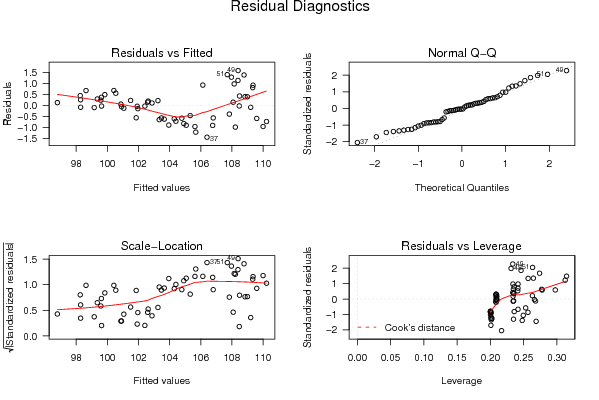
Y[t] = + 95.9882710311442 + 0.0112456275625973X[t] + 0.355621378278568M1[t] + 0.281404269153141M2[t] + 0.174446779390013M3[t] -1.62886313825417M4[t] + 0.502574320639195M5[t] + 0.315918698325612M6[t] + 0.359135015305834M7[t] + 0.290375545247334M8[t] + 0.172803055667315M9[t] -1.28073177452812M10[t] + 0.310383374592550M11[t] + 0.191057566869932t + e[t]

\begin{tabular}{lllllllll}
\hline
Multiple Linear Regression - Estimated Regression Equation \tabularnewline
Y[t] =  +  95.9882710311442 +  0.0112456275625973X[t] +  0.355621378278568M1[t] +  0.281404269153141M2[t] +  0.174446779390013M3[t] -1.62886313825417M4[t] +  0.502574320639195M5[t] +  0.315918698325612M6[t] +  0.359135015305834M7[t] +  0.290375545247334M8[t] +  0.172803055667315M9[t] -1.28073177452812M10[t] +  0.310383374592550M11[t] +  0.191057566869932t  + e[t] \tabularnewline
\hline
\end{tabular}
%Source: https://freestatistics.org/blog/index.php?pk=58085&T=1

[TABLE]
[ROW][C]Multiple Linear Regression - Estimated Regression Equation[/C][/ROW]
[ROW][C]Y[t] =  +  95.9882710311442 +  0.0112456275625973X[t] +  0.355621378278568M1[t] +  0.281404269153141M2[t] +  0.174446779390013M3[t] -1.62886313825417M4[t] +  0.502574320639195M5[t] +  0.315918698325612M6[t] +  0.359135015305834M7[t] +  0.290375545247334M8[t] +  0.172803055667315M9[t] -1.28073177452812M10[t] +  0.310383374592550M11[t] +  0.191057566869932t  + e[t][/C][/ROW]
[/TABLE]
Source: https://freestatistics.org/blog/index.php?pk=58085&T=1

Globally Unique Identifier (entire table): ba.freestatistics.org/blog/index.php?pk=58085&T=1

As an alternative you can also use a QR Code:  

The GUIDs for individual cells are displayed in the table below:

Multiple Linear Regression - Estimated Regression Equation
Y[t] = + 95.9882710311442 + 0.0112456275625973X[t] + 0.355621378278568M1[t] + 0.281404269153141M2[t] + 0.174446779390013M3[t] -1.62886313825417M4[t] + 0.502574320639195M5[t] + 0.315918698325612M6[t] + 0.359135015305834M7[t] + 0.290375545247334M8[t] + 0.172803055667315M9[t] -1.28073177452812M10[t] + 0.310383374592550M11[t] + 0.191057566869932t + e[t]


Multiple Linear Regression - Ordinary Least Squares
VariableParameterS.D.T-STATH0: parameter = 02-tail p-value1-tail p-value
(Intercept)95.98827103114420.540531177.581300
X0.01124562756259730.0018955.934900
M10.3556213782785680.5109410.6960.4899230.244961
M20.2814042691531410.5113930.55030.5847970.292398
M30.1744467793900130.5120720.34070.7349040.367452
M4-1.628863138254170.510748-3.18920.0025690.001284
M50.5025743206391950.5096810.98610.3292630.164632
M60.3159186983256120.5078630.62210.5369770.268488
M70.3591350153058340.5068740.70850.4821920.241096
M80.2903755452473340.5065950.57320.5693070.284654
M90.1728030556673150.5073260.34060.7349440.367472
M10-1.280731774528120.507632-2.5230.0151580.007579
M110.3103833745925500.5065640.61270.5430770.271539
t0.1910575668699320.00682527.99300

\begin{tabular}{lllllllll}
\hline
Multiple Linear Regression - Ordinary Least Squares \tabularnewline
Variable & Parameter & S.D. & T-STATH0: parameter = 0 & 2-tail p-value & 1-tail p-value \tabularnewline
(Intercept) & 95.9882710311442 & 0.540531 & 177.5813 & 0 & 0 \tabularnewline
X & 0.0112456275625973 & 0.001895 & 5.9349 & 0 & 0 \tabularnewline
M1 & 0.355621378278568 & 0.510941 & 0.696 & 0.489923 & 0.244961 \tabularnewline
M2 & 0.281404269153141 & 0.511393 & 0.5503 & 0.584797 & 0.292398 \tabularnewline
M3 & 0.174446779390013 & 0.512072 & 0.3407 & 0.734904 & 0.367452 \tabularnewline
M4 & -1.62886313825417 & 0.510748 & -3.1892 & 0.002569 & 0.001284 \tabularnewline
M5 & 0.502574320639195 & 0.509681 & 0.9861 & 0.329263 & 0.164632 \tabularnewline
M6 & 0.315918698325612 & 0.507863 & 0.6221 & 0.536977 & 0.268488 \tabularnewline
M7 & 0.359135015305834 & 0.506874 & 0.7085 & 0.482192 & 0.241096 \tabularnewline
M8 & 0.290375545247334 & 0.506595 & 0.5732 & 0.569307 & 0.284654 \tabularnewline
M9 & 0.172803055667315 & 0.507326 & 0.3406 & 0.734944 & 0.367472 \tabularnewline
M10 & -1.28073177452812 & 0.507632 & -2.523 & 0.015158 & 0.007579 \tabularnewline
M11 & 0.310383374592550 & 0.506564 & 0.6127 & 0.543077 & 0.271539 \tabularnewline
t & 0.191057566869932 & 0.006825 & 27.993 & 0 & 0 \tabularnewline
\hline
\end{tabular}
%Source: https://freestatistics.org/blog/index.php?pk=58085&T=2

[TABLE]
[ROW][C]Multiple Linear Regression - Ordinary Least Squares[/C][/ROW]
[ROW][C]Variable[/C][C]Parameter[/C][C]S.D.[/C][C]T-STATH0: parameter = 0[/C][C]2-tail p-value[/C][C]1-tail p-value[/C][/ROW]
[ROW][C](Intercept)[/C][C]95.9882710311442[/C][C]0.540531[/C][C]177.5813[/C][C]0[/C][C]0[/C][/ROW]
[ROW][C]X[/C][C]0.0112456275625973[/C][C]0.001895[/C][C]5.9349[/C][C]0[/C][C]0[/C][/ROW]
[ROW][C]M1[/C][C]0.355621378278568[/C][C]0.510941[/C][C]0.696[/C][C]0.489923[/C][C]0.244961[/C][/ROW]
[ROW][C]M2[/C][C]0.281404269153141[/C][C]0.511393[/C][C]0.5503[/C][C]0.584797[/C][C]0.292398[/C][/ROW]
[ROW][C]M3[/C][C]0.174446779390013[/C][C]0.512072[/C][C]0.3407[/C][C]0.734904[/C][C]0.367452[/C][/ROW]
[ROW][C]M4[/C][C]-1.62886313825417[/C][C]0.510748[/C][C]-3.1892[/C][C]0.002569[/C][C]0.001284[/C][/ROW]
[ROW][C]M5[/C][C]0.502574320639195[/C][C]0.509681[/C][C]0.9861[/C][C]0.329263[/C][C]0.164632[/C][/ROW]
[ROW][C]M6[/C][C]0.315918698325612[/C][C]0.507863[/C][C]0.6221[/C][C]0.536977[/C][C]0.268488[/C][/ROW]
[ROW][C]M7[/C][C]0.359135015305834[/C][C]0.506874[/C][C]0.7085[/C][C]0.482192[/C][C]0.241096[/C][/ROW]
[ROW][C]M8[/C][C]0.290375545247334[/C][C]0.506595[/C][C]0.5732[/C][C]0.569307[/C][C]0.284654[/C][/ROW]
[ROW][C]M9[/C][C]0.172803055667315[/C][C]0.507326[/C][C]0.3406[/C][C]0.734944[/C][C]0.367472[/C][/ROW]
[ROW][C]M10[/C][C]-1.28073177452812[/C][C]0.507632[/C][C]-2.523[/C][C]0.015158[/C][C]0.007579[/C][/ROW]
[ROW][C]M11[/C][C]0.310383374592550[/C][C]0.506564[/C][C]0.6127[/C][C]0.543077[/C][C]0.271539[/C][/ROW]
[ROW][C]t[/C][C]0.191057566869932[/C][C]0.006825[/C][C]27.993[/C][C]0[/C][C]0[/C][/ROW]
[/TABLE]
Source: https://freestatistics.org/blog/index.php?pk=58085&T=2

Globally Unique Identifier (entire table): ba.freestatistics.org/blog/index.php?pk=58085&T=2

As an alternative you can also use a QR Code:  

The GUIDs for individual cells are displayed in the table below:

Multiple Linear Regression - Ordinary Least Squares
VariableParameterS.D.T-STATH0: parameter = 02-tail p-value1-tail p-value
(Intercept)95.98827103114420.540531177.581300
X0.01124562756259730.0018955.934900
M10.3556213782785680.5109410.6960.4899230.244961
M20.2814042691531410.5113930.55030.5847970.292398
M30.1744467793900130.5120720.34070.7349040.367452
M4-1.628863138254170.510748-3.18920.0025690.001284
M50.5025743206391950.5096810.98610.3292630.164632
M60.3159186983256120.5078630.62210.5369770.268488
M70.3591350153058340.5068740.70850.4821920.241096
M80.2903755452473340.5065950.57320.5693070.284654
M90.1728030556673150.5073260.34060.7349440.367472
M10-1.280731774528120.507632-2.5230.0151580.007579
M110.3103833745925500.5065640.61270.5430770.271539
t0.1910575668699320.00682527.99300


Multiple Linear Regression - Regression Statistics
Multiple R0.983059435402643
R-squared0.966405853534163
Adjusted R-squared0.956911855619905
F-TEST (value)101.791243505837
F-TEST (DF numerator)13
F-TEST (DF denominator)46
p-value0
Multiple Linear Regression - Residual Statistics
Residual Standard Deviation0.799905919004726
Sum Squared Residuals29.4330760459046

\begin{tabular}{lllllllll}
\hline
Multiple Linear Regression - Regression Statistics \tabularnewline
Multiple R & 0.983059435402643 \tabularnewline
R-squared & 0.966405853534163 \tabularnewline
Adjusted R-squared & 0.956911855619905 \tabularnewline
F-TEST (value) & 101.791243505837 \tabularnewline
F-TEST (DF numerator) & 13 \tabularnewline
F-TEST (DF denominator) & 46 \tabularnewline
p-value & 0 \tabularnewline
Multiple Linear Regression - Residual Statistics \tabularnewline
Residual Standard Deviation & 0.799905919004726 \tabularnewline
Sum Squared Residuals & 29.4330760459046 \tabularnewline
\hline
\end{tabular}
%Source: https://freestatistics.org/blog/index.php?pk=58085&T=3

[TABLE]
[ROW][C]Multiple Linear Regression - Regression Statistics[/C][/ROW]
[ROW][C]Multiple R[/C][C]0.983059435402643[/C][/ROW]
[ROW][C]R-squared[/C][C]0.966405853534163[/C][/ROW]
[ROW][C]Adjusted R-squared[/C][C]0.956911855619905[/C][/ROW]
[ROW][C]F-TEST (value)[/C][C]101.791243505837[/C][/ROW]
[ROW][C]F-TEST (DF numerator)[/C][C]13[/C][/ROW]
[ROW][C]F-TEST (DF denominator)[/C][C]46[/C][/ROW]
[ROW][C]p-value[/C][C]0[/C][/ROW]
[ROW][C]Multiple Linear Regression - Residual Statistics[/C][/ROW]
[ROW][C]Residual Standard Deviation[/C][C]0.799905919004726[/C][/ROW]
[ROW][C]Sum Squared Residuals[/C][C]29.4330760459046[/C][/ROW]
[/TABLE]
Source: https://freestatistics.org/blog/index.php?pk=58085&T=3

Globally Unique Identifier (entire table): ba.freestatistics.org/blog/index.php?pk=58085&T=3

As an alternative you can also use a QR Code:  

The GUIDs for individual cells are displayed in the table below:

Multiple Linear Regression - Regression Statistics
Multiple R0.983059435402643
R-squared0.966405853534163
Adjusted R-squared0.956911855619905
F-TEST (value)101.791243505837
F-TEST (DF numerator)13
F-TEST (DF denominator)46
p-value0
Multiple Linear Regression - Residual Statistics
Residual Standard Deviation0.799905919004726
Sum Squared Residuals29.4330760459046


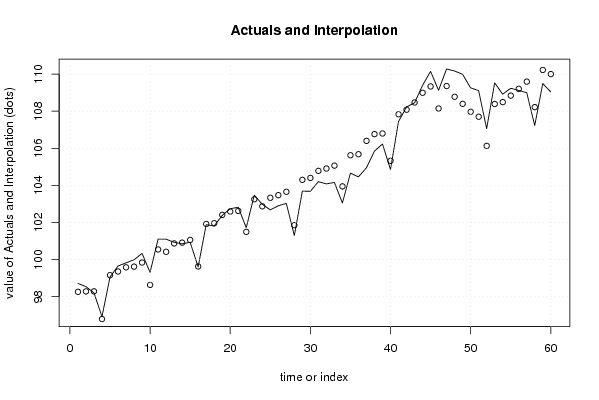
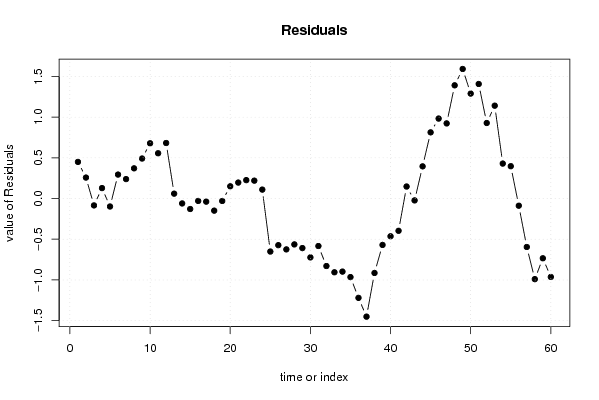
Multiple Linear Regression - Actuals, Interpolation, and Residuals
Time or IndexActualsInterpolationForecastResidualsPrediction Error
198.7198.2600292443950.449970755604924
298.5498.28240643061380.257593569386186
398.298.2844134265137-0.0844134265136707
496.9296.7913647279030.128635272097050
599.0699.1577177011604-0.0977177011603769
699.6599.35554443979340.2944555602066
799.8299.58082182159350.23917817840651
899.9999.61877771168540.371222288314563
9100.3399.8384559472890.49154405271089
1099.3198.63108225902030.678917740979667
11101.1100.5437042547370.556295745262929
12101.1100.4176310704770.682368929523104
13100.93100.8698467441000.0601532559004348
14100.85100.910216934418-0.0602169344184278
15100.93101.058417088632-0.12841708863202
1699.699.6294684671281-0.0294684671281111
17101.88101.918226610204-0.0382266102036215
18101.81101.958614562960-0.148614562960275
19102.38102.409929058769-0.0299290587685652
20102.74102.5895798561490.150420143850757
21102.82102.623705236970.196294763029932
22101.72101.4939263788830.226073621116796
23103.47103.2502341514800.219765848520165
24102.98102.8700097843050.109990215695044
25102.68103.331221959978-0.651221959977714
26102.9103.47280279836-0.572802798359934
27103.03103.654739835261-0.624739835261341
28101.29101.853560941435-0.563560941435444
29103.69104.298633307631-0.608633307631066
30103.68104.403121337495-0.723121337494523
31104.2104.783588379658-0.583588379658447
32104.08104.909260164739-0.829260164738662
33104.16105.065962885992-0.905962885991797
34103.05103.947429655468-0.897429655467536
35104.66105.625018035126-0.965018035125986
36104.46105.679999454624-1.21999945462363
37104.95106.400985626992-1.45098562699238
38105.85106.764105328358-0.914105328357773
39106.23106.799849206945-0.569849206945402
40104.86105.323668949679-0.463668949678577
41107.44107.836215081250-0.396215081249775
42108.23108.0823980184020.14760198159804
43108.45108.472986125372-0.0229861253722201
44109.39108.9945040006560.395495999344144
45110.15109.3367595766920.81324042330816
46109.13108.1473788925230.982621107476772
47110.28109.3571491655780.922850834422376
48110.17108.7790017533011.39099824669896
49109.99108.3979164245351.59208357546473
50109.26107.970468508251.28953149174995
51109.11107.7025804426481.40741955735243
52107.06106.1319369138550.928063086145082
53109.53108.3892072997551.14079270024484
54108.92108.4903216413500.429678358650158
55109.24108.8426746146070.397325385392722
56109.12109.207878266771-0.0878782667708028
57109109.595116353057-0.595116353057185
58107.23108.220182814106-0.9901828141057
59109.49110.223894393079-0.733894393079484
60109.04110.003357937293-0.963357937293478

\begin{tabular}{lllllllll}
\hline
Multiple Linear Regression - Actuals, Interpolation, and Residuals \tabularnewline
Time or Index & Actuals & InterpolationForecast & ResidualsPrediction Error \tabularnewline
1 & 98.71 & 98.260029244395 & 0.449970755604924 \tabularnewline
2 & 98.54 & 98.2824064306138 & 0.257593569386186 \tabularnewline
3 & 98.2 & 98.2844134265137 & -0.0844134265136707 \tabularnewline
4 & 96.92 & 96.791364727903 & 0.128635272097050 \tabularnewline
5 & 99.06 & 99.1577177011604 & -0.0977177011603769 \tabularnewline
6 & 99.65 & 99.3555444397934 & 0.2944555602066 \tabularnewline
7 & 99.82 & 99.5808218215935 & 0.23917817840651 \tabularnewline
8 & 99.99 & 99.6187777116854 & 0.371222288314563 \tabularnewline
9 & 100.33 & 99.838455947289 & 0.49154405271089 \tabularnewline
10 & 99.31 & 98.6310822590203 & 0.678917740979667 \tabularnewline
11 & 101.1 & 100.543704254737 & 0.556295745262929 \tabularnewline
12 & 101.1 & 100.417631070477 & 0.682368929523104 \tabularnewline
13 & 100.93 & 100.869846744100 & 0.0601532559004348 \tabularnewline
14 & 100.85 & 100.910216934418 & -0.0602169344184278 \tabularnewline
15 & 100.93 & 101.058417088632 & -0.12841708863202 \tabularnewline
16 & 99.6 & 99.6294684671281 & -0.0294684671281111 \tabularnewline
17 & 101.88 & 101.918226610204 & -0.0382266102036215 \tabularnewline
18 & 101.81 & 101.958614562960 & -0.148614562960275 \tabularnewline
19 & 102.38 & 102.409929058769 & -0.0299290587685652 \tabularnewline
20 & 102.74 & 102.589579856149 & 0.150420143850757 \tabularnewline
21 & 102.82 & 102.62370523697 & 0.196294763029932 \tabularnewline
22 & 101.72 & 101.493926378883 & 0.226073621116796 \tabularnewline
23 & 103.47 & 103.250234151480 & 0.219765848520165 \tabularnewline
24 & 102.98 & 102.870009784305 & 0.109990215695044 \tabularnewline
25 & 102.68 & 103.331221959978 & -0.651221959977714 \tabularnewline
26 & 102.9 & 103.47280279836 & -0.572802798359934 \tabularnewline
27 & 103.03 & 103.654739835261 & -0.624739835261341 \tabularnewline
28 & 101.29 & 101.853560941435 & -0.563560941435444 \tabularnewline
29 & 103.69 & 104.298633307631 & -0.608633307631066 \tabularnewline
30 & 103.68 & 104.403121337495 & -0.723121337494523 \tabularnewline
31 & 104.2 & 104.783588379658 & -0.583588379658447 \tabularnewline
32 & 104.08 & 104.909260164739 & -0.829260164738662 \tabularnewline
33 & 104.16 & 105.065962885992 & -0.905962885991797 \tabularnewline
34 & 103.05 & 103.947429655468 & -0.897429655467536 \tabularnewline
35 & 104.66 & 105.625018035126 & -0.965018035125986 \tabularnewline
36 & 104.46 & 105.679999454624 & -1.21999945462363 \tabularnewline
37 & 104.95 & 106.400985626992 & -1.45098562699238 \tabularnewline
38 & 105.85 & 106.764105328358 & -0.914105328357773 \tabularnewline
39 & 106.23 & 106.799849206945 & -0.569849206945402 \tabularnewline
40 & 104.86 & 105.323668949679 & -0.463668949678577 \tabularnewline
41 & 107.44 & 107.836215081250 & -0.396215081249775 \tabularnewline
42 & 108.23 & 108.082398018402 & 0.14760198159804 \tabularnewline
43 & 108.45 & 108.472986125372 & -0.0229861253722201 \tabularnewline
44 & 109.39 & 108.994504000656 & 0.395495999344144 \tabularnewline
45 & 110.15 & 109.336759576692 & 0.81324042330816 \tabularnewline
46 & 109.13 & 108.147378892523 & 0.982621107476772 \tabularnewline
47 & 110.28 & 109.357149165578 & 0.922850834422376 \tabularnewline
48 & 110.17 & 108.779001753301 & 1.39099824669896 \tabularnewline
49 & 109.99 & 108.397916424535 & 1.59208357546473 \tabularnewline
50 & 109.26 & 107.97046850825 & 1.28953149174995 \tabularnewline
51 & 109.11 & 107.702580442648 & 1.40741955735243 \tabularnewline
52 & 107.06 & 106.131936913855 & 0.928063086145082 \tabularnewline
53 & 109.53 & 108.389207299755 & 1.14079270024484 \tabularnewline
54 & 108.92 & 108.490321641350 & 0.429678358650158 \tabularnewline
55 & 109.24 & 108.842674614607 & 0.397325385392722 \tabularnewline
56 & 109.12 & 109.207878266771 & -0.0878782667708028 \tabularnewline
57 & 109 & 109.595116353057 & -0.595116353057185 \tabularnewline
58 & 107.23 & 108.220182814106 & -0.9901828141057 \tabularnewline
59 & 109.49 & 110.223894393079 & -0.733894393079484 \tabularnewline
60 & 109.04 & 110.003357937293 & -0.963357937293478 \tabularnewline
\hline
\end{tabular}
%Source: https://freestatistics.org/blog/index.php?pk=58085&T=4

[TABLE]
[ROW][C]Multiple Linear Regression - Actuals, Interpolation, and Residuals[/C][/ROW]
[ROW][C]Time or Index[/C][C]Actuals[/C][C]InterpolationForecast[/C][C]ResidualsPrediction Error[/C][/ROW]
[ROW][C]1[/C][C]98.71[/C][C]98.260029244395[/C][C]0.449970755604924[/C][/ROW]
[ROW][C]2[/C][C]98.54[/C][C]98.2824064306138[/C][C]0.257593569386186[/C][/ROW]
[ROW][C]3[/C][C]98.2[/C][C]98.2844134265137[/C][C]-0.0844134265136707[/C][/ROW]
[ROW][C]4[/C][C]96.92[/C][C]96.791364727903[/C][C]0.128635272097050[/C][/ROW]
[ROW][C]5[/C][C]99.06[/C][C]99.1577177011604[/C][C]-0.0977177011603769[/C][/ROW]
[ROW][C]6[/C][C]99.65[/C][C]99.3555444397934[/C][C]0.2944555602066[/C][/ROW]
[ROW][C]7[/C][C]99.82[/C][C]99.5808218215935[/C][C]0.23917817840651[/C][/ROW]
[ROW][C]8[/C][C]99.99[/C][C]99.6187777116854[/C][C]0.371222288314563[/C][/ROW]
[ROW][C]9[/C][C]100.33[/C][C]99.838455947289[/C][C]0.49154405271089[/C][/ROW]
[ROW][C]10[/C][C]99.31[/C][C]98.6310822590203[/C][C]0.678917740979667[/C][/ROW]
[ROW][C]11[/C][C]101.1[/C][C]100.543704254737[/C][C]0.556295745262929[/C][/ROW]
[ROW][C]12[/C][C]101.1[/C][C]100.417631070477[/C][C]0.682368929523104[/C][/ROW]
[ROW][C]13[/C][C]100.93[/C][C]100.869846744100[/C][C]0.0601532559004348[/C][/ROW]
[ROW][C]14[/C][C]100.85[/C][C]100.910216934418[/C][C]-0.0602169344184278[/C][/ROW]
[ROW][C]15[/C][C]100.93[/C][C]101.058417088632[/C][C]-0.12841708863202[/C][/ROW]
[ROW][C]16[/C][C]99.6[/C][C]99.6294684671281[/C][C]-0.0294684671281111[/C][/ROW]
[ROW][C]17[/C][C]101.88[/C][C]101.918226610204[/C][C]-0.0382266102036215[/C][/ROW]
[ROW][C]18[/C][C]101.81[/C][C]101.958614562960[/C][C]-0.148614562960275[/C][/ROW]
[ROW][C]19[/C][C]102.38[/C][C]102.409929058769[/C][C]-0.0299290587685652[/C][/ROW]
[ROW][C]20[/C][C]102.74[/C][C]102.589579856149[/C][C]0.150420143850757[/C][/ROW]
[ROW][C]21[/C][C]102.82[/C][C]102.62370523697[/C][C]0.196294763029932[/C][/ROW]
[ROW][C]22[/C][C]101.72[/C][C]101.493926378883[/C][C]0.226073621116796[/C][/ROW]
[ROW][C]23[/C][C]103.47[/C][C]103.250234151480[/C][C]0.219765848520165[/C][/ROW]
[ROW][C]24[/C][C]102.98[/C][C]102.870009784305[/C][C]0.109990215695044[/C][/ROW]
[ROW][C]25[/C][C]102.68[/C][C]103.331221959978[/C][C]-0.651221959977714[/C][/ROW]
[ROW][C]26[/C][C]102.9[/C][C]103.47280279836[/C][C]-0.572802798359934[/C][/ROW]
[ROW][C]27[/C][C]103.03[/C][C]103.654739835261[/C][C]-0.624739835261341[/C][/ROW]
[ROW][C]28[/C][C]101.29[/C][C]101.853560941435[/C][C]-0.563560941435444[/C][/ROW]
[ROW][C]29[/C][C]103.69[/C][C]104.298633307631[/C][C]-0.608633307631066[/C][/ROW]
[ROW][C]30[/C][C]103.68[/C][C]104.403121337495[/C][C]-0.723121337494523[/C][/ROW]
[ROW][C]31[/C][C]104.2[/C][C]104.783588379658[/C][C]-0.583588379658447[/C][/ROW]
[ROW][C]32[/C][C]104.08[/C][C]104.909260164739[/C][C]-0.829260164738662[/C][/ROW]
[ROW][C]33[/C][C]104.16[/C][C]105.065962885992[/C][C]-0.905962885991797[/C][/ROW]
[ROW][C]34[/C][C]103.05[/C][C]103.947429655468[/C][C]-0.897429655467536[/C][/ROW]
[ROW][C]35[/C][C]104.66[/C][C]105.625018035126[/C][C]-0.965018035125986[/C][/ROW]
[ROW][C]36[/C][C]104.46[/C][C]105.679999454624[/C][C]-1.21999945462363[/C][/ROW]
[ROW][C]37[/C][C]104.95[/C][C]106.400985626992[/C][C]-1.45098562699238[/C][/ROW]
[ROW][C]38[/C][C]105.85[/C][C]106.764105328358[/C][C]-0.914105328357773[/C][/ROW]
[ROW][C]39[/C][C]106.23[/C][C]106.799849206945[/C][C]-0.569849206945402[/C][/ROW]
[ROW][C]40[/C][C]104.86[/C][C]105.323668949679[/C][C]-0.463668949678577[/C][/ROW]
[ROW][C]41[/C][C]107.44[/C][C]107.836215081250[/C][C]-0.396215081249775[/C][/ROW]
[ROW][C]42[/C][C]108.23[/C][C]108.082398018402[/C][C]0.14760198159804[/C][/ROW]
[ROW][C]43[/C][C]108.45[/C][C]108.472986125372[/C][C]-0.0229861253722201[/C][/ROW]
[ROW][C]44[/C][C]109.39[/C][C]108.994504000656[/C][C]0.395495999344144[/C][/ROW]
[ROW][C]45[/C][C]110.15[/C][C]109.336759576692[/C][C]0.81324042330816[/C][/ROW]
[ROW][C]46[/C][C]109.13[/C][C]108.147378892523[/C][C]0.982621107476772[/C][/ROW]
[ROW][C]47[/C][C]110.28[/C][C]109.357149165578[/C][C]0.922850834422376[/C][/ROW]
[ROW][C]48[/C][C]110.17[/C][C]108.779001753301[/C][C]1.39099824669896[/C][/ROW]
[ROW][C]49[/C][C]109.99[/C][C]108.397916424535[/C][C]1.59208357546473[/C][/ROW]
[ROW][C]50[/C][C]109.26[/C][C]107.97046850825[/C][C]1.28953149174995[/C][/ROW]
[ROW][C]51[/C][C]109.11[/C][C]107.702580442648[/C][C]1.40741955735243[/C][/ROW]
[ROW][C]52[/C][C]107.06[/C][C]106.131936913855[/C][C]0.928063086145082[/C][/ROW]
[ROW][C]53[/C][C]109.53[/C][C]108.389207299755[/C][C]1.14079270024484[/C][/ROW]
[ROW][C]54[/C][C]108.92[/C][C]108.490321641350[/C][C]0.429678358650158[/C][/ROW]
[ROW][C]55[/C][C]109.24[/C][C]108.842674614607[/C][C]0.397325385392722[/C][/ROW]
[ROW][C]56[/C][C]109.12[/C][C]109.207878266771[/C][C]-0.0878782667708028[/C][/ROW]
[ROW][C]57[/C][C]109[/C][C]109.595116353057[/C][C]-0.595116353057185[/C][/ROW]
[ROW][C]58[/C][C]107.23[/C][C]108.220182814106[/C][C]-0.9901828141057[/C][/ROW]
[ROW][C]59[/C][C]109.49[/C][C]110.223894393079[/C][C]-0.733894393079484[/C][/ROW]
[ROW][C]60[/C][C]109.04[/C][C]110.003357937293[/C][C]-0.963357937293478[/C][/ROW]
[/TABLE]
Source: https://freestatistics.org/blog/index.php?pk=58085&T=4

Globally Unique Identifier (entire table): ba.freestatistics.org/blog/index.php?pk=58085&T=4

As an alternative you can also use a QR Code:  

The GUIDs for individual cells are displayed in the table below:

Multiple Linear Regression - Actuals, Interpolation, and Residuals
Time or IndexActualsInterpolationForecastResidualsPrediction Error
198.7198.2600292443950.449970755604924
298.5498.28240643061380.257593569386186
398.298.2844134265137-0.0844134265136707
496.9296.7913647279030.128635272097050
599.0699.1577177011604-0.0977177011603769
699.6599.35554443979340.2944555602066
799.8299.58082182159350.23917817840651
899.9999.61877771168540.371222288314563
9100.3399.8384559472890.49154405271089
1099.3198.63108225902030.678917740979667
11101.1100.5437042547370.556295745262929
12101.1100.4176310704770.682368929523104
13100.93100.8698467441000.0601532559004348
14100.85100.910216934418-0.0602169344184278
15100.93101.058417088632-0.12841708863202
1699.699.6294684671281-0.0294684671281111
17101.88101.918226610204-0.0382266102036215
18101.81101.958614562960-0.148614562960275
19102.38102.409929058769-0.0299290587685652
20102.74102.5895798561490.150420143850757
21102.82102.623705236970.196294763029932
22101.72101.4939263788830.226073621116796
23103.47103.2502341514800.219765848520165
24102.98102.8700097843050.109990215695044
25102.68103.331221959978-0.651221959977714
26102.9103.47280279836-0.572802798359934
27103.03103.654739835261-0.624739835261341
28101.29101.853560941435-0.563560941435444
29103.69104.298633307631-0.608633307631066
30103.68104.403121337495-0.723121337494523
31104.2104.783588379658-0.583588379658447
32104.08104.909260164739-0.829260164738662
33104.16105.065962885992-0.905962885991797
34103.05103.947429655468-0.897429655467536
35104.66105.625018035126-0.965018035125986
36104.46105.679999454624-1.21999945462363
37104.95106.400985626992-1.45098562699238
38105.85106.764105328358-0.914105328357773
39106.23106.799849206945-0.569849206945402
40104.86105.323668949679-0.463668949678577
41107.44107.836215081250-0.396215081249775
42108.23108.0823980184020.14760198159804
43108.45108.472986125372-0.0229861253722201
44109.39108.9945040006560.395495999344144
45110.15109.3367595766920.81324042330816
46109.13108.1473788925230.982621107476772
47110.28109.3571491655780.922850834422376
48110.17108.7790017533011.39099824669896
49109.99108.3979164245351.59208357546473
50109.26107.970468508251.28953149174995
51109.11107.7025804426481.40741955735243
52107.06106.1319369138550.928063086145082
53109.53108.3892072997551.14079270024484
54108.92108.4903216413500.429678358650158
55109.24108.8426746146070.397325385392722
56109.12109.207878266771-0.0878782667708028
57109109.595116353057-0.595116353057185
58107.23108.220182814106-0.9901828141057
59109.49110.223894393079-0.733894393079484
60109.04110.003357937293-0.963357937293478


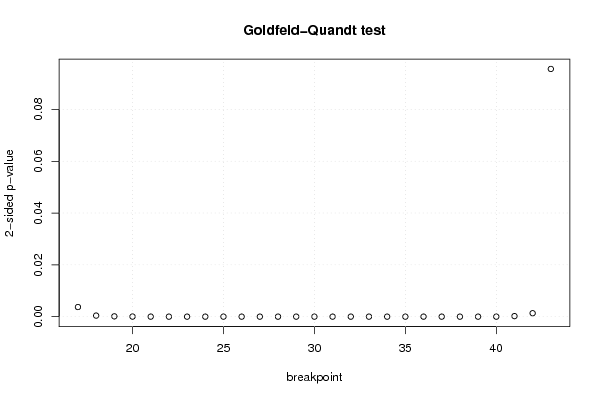
Goldfeld-Quandt test for Heteroskedasticity
p-valuesAlternative Hypothesis
breakpoint indexgreater2-sidedless
170.001856888527098520.003713777054197040.998143111472901
180.0002027335299758280.0004054670599516560.999797266470024
196.0573593497185e-050.000121147186994370.999939426406503
201.57929101545725e-053.15858203091449e-050.999984207089845
212.27212665418015e-064.54425330836029e-060.999997727873346
221.21136027346300e-062.42272054692599e-060.999998788639727
232.13266540452214e-074.26533080904428e-070.99999978673346
245.89006119327157e-081.17801223865431e-070.999999941099388
251.67515974243679e-083.35031948487358e-080.999999983248403
261.99193396655019e-093.98386793310039e-090.999999998008066
272.34764861818634e-104.69529723637268e-100.999999999765235
288.40896352235791e-111.68179270447158e-100.99999999991591
291.49233513051788e-112.98467026103577e-110.999999999985077
302.13557463945499e-124.27114927890998e-120.999999999997864
312.24078089118563e-134.48156178237126e-130.999999999999776
321.08855820067812e-122.17711640135623e-120.999999999998911
331.21436964402142e-112.42873928804284e-110.999999999987856
341.19128820982817e-102.38257641965634e-100.99999999988087
351.53409912999757e-103.06819825999514e-100.99999999984659
361.27231370971582e-082.54462741943165e-080.999999987276863
371.15842401551478e-082.31684803102957e-080.99999998841576
381.03033910712324e-082.06067821424647e-080.99999998969661
391.00064023707592e-072.00128047415185e-070.999999899935976
407.9178416342053e-071.58356832684106e-060.999999208215837
410.000102286347178680.000204572694357360.999897713652821
420.0006621152389959220.001324230477991840.999337884761004
430.04781809890879260.09563619781758530.952181901091207

\begin{tabular}{lllllllll}
\hline
Goldfeld-Quandt test for Heteroskedasticity \tabularnewline
p-values & Alternative Hypothesis \tabularnewline
breakpoint index & greater & 2-sided & less \tabularnewline
17 & 0.00185688852709852 & 0.00371377705419704 & 0.998143111472901 \tabularnewline
18 & 0.000202733529975828 & 0.000405467059951656 & 0.999797266470024 \tabularnewline
19 & 6.0573593497185e-05 & 0.00012114718699437 & 0.999939426406503 \tabularnewline
20 & 1.57929101545725e-05 & 3.15858203091449e-05 & 0.999984207089845 \tabularnewline
21 & 2.27212665418015e-06 & 4.54425330836029e-06 & 0.999997727873346 \tabularnewline
22 & 1.21136027346300e-06 & 2.42272054692599e-06 & 0.999998788639727 \tabularnewline
23 & 2.13266540452214e-07 & 4.26533080904428e-07 & 0.99999978673346 \tabularnewline
24 & 5.89006119327157e-08 & 1.17801223865431e-07 & 0.999999941099388 \tabularnewline
25 & 1.67515974243679e-08 & 3.35031948487358e-08 & 0.999999983248403 \tabularnewline
26 & 1.99193396655019e-09 & 3.98386793310039e-09 & 0.999999998008066 \tabularnewline
27 & 2.34764861818634e-10 & 4.69529723637268e-10 & 0.999999999765235 \tabularnewline
28 & 8.40896352235791e-11 & 1.68179270447158e-10 & 0.99999999991591 \tabularnewline
29 & 1.49233513051788e-11 & 2.98467026103577e-11 & 0.999999999985077 \tabularnewline
30 & 2.13557463945499e-12 & 4.27114927890998e-12 & 0.999999999997864 \tabularnewline
31 & 2.24078089118563e-13 & 4.48156178237126e-13 & 0.999999999999776 \tabularnewline
32 & 1.08855820067812e-12 & 2.17711640135623e-12 & 0.999999999998911 \tabularnewline
33 & 1.21436964402142e-11 & 2.42873928804284e-11 & 0.999999999987856 \tabularnewline
34 & 1.19128820982817e-10 & 2.38257641965634e-10 & 0.99999999988087 \tabularnewline
35 & 1.53409912999757e-10 & 3.06819825999514e-10 & 0.99999999984659 \tabularnewline
36 & 1.27231370971582e-08 & 2.54462741943165e-08 & 0.999999987276863 \tabularnewline
37 & 1.15842401551478e-08 & 2.31684803102957e-08 & 0.99999998841576 \tabularnewline
38 & 1.03033910712324e-08 & 2.06067821424647e-08 & 0.99999998969661 \tabularnewline
39 & 1.00064023707592e-07 & 2.00128047415185e-07 & 0.999999899935976 \tabularnewline
40 & 7.9178416342053e-07 & 1.58356832684106e-06 & 0.999999208215837 \tabularnewline
41 & 0.00010228634717868 & 0.00020457269435736 & 0.999897713652821 \tabularnewline
42 & 0.000662115238995922 & 0.00132423047799184 & 0.999337884761004 \tabularnewline
43 & 0.0478180989087926 & 0.0956361978175853 & 0.952181901091207 \tabularnewline
\hline
\end{tabular}
%Source: https://freestatistics.org/blog/index.php?pk=58085&T=5

[TABLE]
[ROW][C]Goldfeld-Quandt test for Heteroskedasticity[/C][/ROW]
[ROW][C]p-values[/C][C]Alternative Hypothesis[/C][/ROW]
[ROW][C]breakpoint index[/C][C]greater[/C][C]2-sided[/C][C]less[/C][/ROW]
[ROW][C]17[/C][C]0.00185688852709852[/C][C]0.00371377705419704[/C][C]0.998143111472901[/C][/ROW]
[ROW][C]18[/C][C]0.000202733529975828[/C][C]0.000405467059951656[/C][C]0.999797266470024[/C][/ROW]
[ROW][C]19[/C][C]6.0573593497185e-05[/C][C]0.00012114718699437[/C][C]0.999939426406503[/C][/ROW]
[ROW][C]20[/C][C]1.57929101545725e-05[/C][C]3.15858203091449e-05[/C][C]0.999984207089845[/C][/ROW]
[ROW][C]21[/C][C]2.27212665418015e-06[/C][C]4.54425330836029e-06[/C][C]0.999997727873346[/C][/ROW]
[ROW][C]22[/C][C]1.21136027346300e-06[/C][C]2.42272054692599e-06[/C][C]0.999998788639727[/C][/ROW]
[ROW][C]23[/C][C]2.13266540452214e-07[/C][C]4.26533080904428e-07[/C][C]0.99999978673346[/C][/ROW]
[ROW][C]24[/C][C]5.89006119327157e-08[/C][C]1.17801223865431e-07[/C][C]0.999999941099388[/C][/ROW]
[ROW][C]25[/C][C]1.67515974243679e-08[/C][C]3.35031948487358e-08[/C][C]0.999999983248403[/C][/ROW]
[ROW][C]26[/C][C]1.99193396655019e-09[/C][C]3.98386793310039e-09[/C][C]0.999999998008066[/C][/ROW]
[ROW][C]27[/C][C]2.34764861818634e-10[/C][C]4.69529723637268e-10[/C][C]0.999999999765235[/C][/ROW]
[ROW][C]28[/C][C]8.40896352235791e-11[/C][C]1.68179270447158e-10[/C][C]0.99999999991591[/C][/ROW]
[ROW][C]29[/C][C]1.49233513051788e-11[/C][C]2.98467026103577e-11[/C][C]0.999999999985077[/C][/ROW]
[ROW][C]30[/C][C]2.13557463945499e-12[/C][C]4.27114927890998e-12[/C][C]0.999999999997864[/C][/ROW]
[ROW][C]31[/C][C]2.24078089118563e-13[/C][C]4.48156178237126e-13[/C][C]0.999999999999776[/C][/ROW]
[ROW][C]32[/C][C]1.08855820067812e-12[/C][C]2.17711640135623e-12[/C][C]0.999999999998911[/C][/ROW]
[ROW][C]33[/C][C]1.21436964402142e-11[/C][C]2.42873928804284e-11[/C][C]0.999999999987856[/C][/ROW]
[ROW][C]34[/C][C]1.19128820982817e-10[/C][C]2.38257641965634e-10[/C][C]0.99999999988087[/C][/ROW]
[ROW][C]35[/C][C]1.53409912999757e-10[/C][C]3.06819825999514e-10[/C][C]0.99999999984659[/C][/ROW]
[ROW][C]36[/C][C]1.27231370971582e-08[/C][C]2.54462741943165e-08[/C][C]0.999999987276863[/C][/ROW]
[ROW][C]37[/C][C]1.15842401551478e-08[/C][C]2.31684803102957e-08[/C][C]0.99999998841576[/C][/ROW]
[ROW][C]38[/C][C]1.03033910712324e-08[/C][C]2.06067821424647e-08[/C][C]0.99999998969661[/C][/ROW]
[ROW][C]39[/C][C]1.00064023707592e-07[/C][C]2.00128047415185e-07[/C][C]0.999999899935976[/C][/ROW]
[ROW][C]40[/C][C]7.9178416342053e-07[/C][C]1.58356832684106e-06[/C][C]0.999999208215837[/C][/ROW]
[ROW][C]41[/C][C]0.00010228634717868[/C][C]0.00020457269435736[/C][C]0.999897713652821[/C][/ROW]
[ROW][C]42[/C][C]0.000662115238995922[/C][C]0.00132423047799184[/C][C]0.999337884761004[/C][/ROW]
[ROW][C]43[/C][C]0.0478180989087926[/C][C]0.0956361978175853[/C][C]0.952181901091207[/C][/ROW]
[/TABLE]
Source: https://freestatistics.org/blog/index.php?pk=58085&T=5

Globally Unique Identifier (entire table): ba.freestatistics.org/blog/index.php?pk=58085&T=5

As an alternative you can also use a QR Code:  

The GUIDs for individual cells are displayed in the table below:

Goldfeld-Quandt test for Heteroskedasticity
p-valuesAlternative Hypothesis
breakpoint indexgreater2-sidedless
170.001856888527098520.003713777054197040.998143111472901
180.0002027335299758280.0004054670599516560.999797266470024
196.0573593497185e-050.000121147186994370.999939426406503
201.57929101545725e-053.15858203091449e-050.999984207089845
212.27212665418015e-064.54425330836029e-060.999997727873346
221.21136027346300e-062.42272054692599e-060.999998788639727
232.13266540452214e-074.26533080904428e-070.99999978673346
245.89006119327157e-081.17801223865431e-070.999999941099388
251.67515974243679e-083.35031948487358e-080.999999983248403
261.99193396655019e-093.98386793310039e-090.999999998008066
272.34764861818634e-104.69529723637268e-100.999999999765235
288.40896352235791e-111.68179270447158e-100.99999999991591
291.49233513051788e-112.98467026103577e-110.999999999985077
302.13557463945499e-124.27114927890998e-120.999999999997864
312.24078089118563e-134.48156178237126e-130.999999999999776
321.08855820067812e-122.17711640135623e-120.999999999998911
331.21436964402142e-112.42873928804284e-110.999999999987856
341.19128820982817e-102.38257641965634e-100.99999999988087
351.53409912999757e-103.06819825999514e-100.99999999984659
361.27231370971582e-082.54462741943165e-080.999999987276863
371.15842401551478e-082.31684803102957e-080.99999998841576
381.03033910712324e-082.06067821424647e-080.99999998969661
391.00064023707592e-072.00128047415185e-070.999999899935976
407.9178416342053e-071.58356832684106e-060.999999208215837
410.000102286347178680.000204572694357360.999897713652821
420.0006621152389959220.001324230477991840.999337884761004
430.04781809890879260.09563619781758530.952181901091207


Meta Analysis of Goldfeld-Quandt test for Heteroskedasticity
Description# significant tests% significant testsOK/NOK
1% type I error level260.962962962962963NOK
5% type I error level260.962962962962963NOK
10% type I error level271NOK

\begin{tabular}{lllllllll}
\hline
Meta Analysis of Goldfeld-Quandt test for Heteroskedasticity \tabularnewline
Description & # significant tests & % significant tests & OK/NOK \tabularnewline
1% type I error level & 26 & 0.962962962962963 & NOK \tabularnewline
5% type I error level & 26 & 0.962962962962963 & NOK \tabularnewline
10% type I error level & 27 & 1 & NOK \tabularnewline
\hline
\end{tabular}
%Source: https://freestatistics.org/blog/index.php?pk=58085&T=6

[TABLE]
[ROW][C]Meta Analysis of Goldfeld-Quandt test for Heteroskedasticity[/C][/ROW]
[ROW][C]Description[/C][C]# significant tests[/C][C]% significant tests[/C][C]OK/NOK[/C][/ROW]
[ROW][C]1% type I error level[/C][C]26[/C][C]0.962962962962963[/C][C]NOK[/C][/ROW]
[ROW][C]5% type I error level[/C][C]26[/C][C]0.962962962962963[/C][C]NOK[/C][/ROW]
[ROW][C]10% type I error level[/C][C]27[/C][C]1[/C][C]NOK[/C][/ROW]
[/TABLE]
Source: https://freestatistics.org/blog/index.php?pk=58085&T=6

Globally Unique Identifier (entire table): ba.freestatistics.org/blog/index.php?pk=58085&T=6

As an alternative you can also use a QR Code:  

The GUIDs for individual cells are displayed in the table below:

Meta Analysis of Goldfeld-Quandt test for Heteroskedasticity
Description# significant tests% significant testsOK/NOK
1% type I error level260.962962962962963NOK
5% type I error level260.962962962962963NOK
10% type I error level271NOK


Parameters (Session):
par1 = 1 ; par2 = Include Monthly Dummies ; par3 = Linear Trend ;
Parameters (R input):
par1 = 1 ; par2 = Include Monthly Dummies ; par3 = Linear Trend ;
R code (references can be found in the software module):
library(lattice)
library(lmtest)
n25 <- 25 #minimum number of obs. for Goldfeld-Quandt test
par1 <- as.numeric(par1)
x <- t(y)
k <- length(x[1,])
n <- length(x[,1])
x1 <- cbind(x[,par1], x[,1:k!=par1])
mycolnames <- c(colnames(x)[par1], colnames(x)[1:k!=par1])
colnames(x1) <- mycolnames #colnames(x)[par1]
x <- x1
if (par3 == 'First Differences'){
x2 <- array(0, dim=c(n-1,k), dimnames=list(1:(n-1), paste('(1-B)',colnames(x),sep='')))
for (i in 1:n-1) {
for (j in 1:k) {
x2[i,j] <- x[i+1,j] - x[i,j]
}
}
x <- x2
}
if (par2 == 'Include Monthly Dummies'){
x2 <- array(0, dim=c(n,11), dimnames=list(1:n, paste('M', seq(1:11), sep ='')))
for (i in 1:11){
x2[seq(i,n,12),i] <- 1
}
x <- cbind(x, x2)
}
if (par2 == 'Include Quarterly Dummies'){
x2 <- array(0, dim=c(n,3), dimnames=list(1:n, paste('Q', seq(1:3), sep ='')))
for (i in 1:3){
x2[seq(i,n,4),i] <- 1
}
x <- cbind(x, x2)
}
k <- length(x[1,])
if (par3 == 'Linear Trend'){
x <- cbind(x, c(1:n))
colnames(x)[k+1] <- 't'
}
x
k <- length(x[1,])
df <- as.data.frame(x)
(mylm <- lm(df))
(mysum <- summary(mylm))
if (n > n25) {
kp3 <- k + 3
nmkm3 <- n - k - 3
gqarr <- array(NA, dim=c(nmkm3-kp3+1,3))
numgqtests <- 0
numsignificant1 <- 0
numsignificant5 <- 0
numsignificant10 <- 0
for (mypoint in kp3:nmkm3) {
j <- 0
numgqtests <- numgqtests + 1
for (myalt in c('greater', 'two.sided', 'less')) {
j <- j + 1
gqarr[mypoint-kp3+1,j] <- gqtest(mylm, point=mypoint, alternative=myalt)$p.value
}
if (gqarr[mypoint-kp3+1,2] < 0.01) numsignificant1 <- numsignificant1 + 1
if (gqarr[mypoint-kp3+1,2] < 0.05) numsignificant5 <- numsignificant5 + 1
if (gqarr[mypoint-kp3+1,2] < 0.10) numsignificant10 <- numsignificant10 + 1
}
gqarr
}
bitmap(file='test0.png')
plot(x[,1], type='l', main='Actuals and Interpolation', ylab='value of Actuals and Interpolation (dots)', xlab='time or index')
points(x[,1]-mysum$resid)
grid()
dev.off()
bitmap(file='test1.png')
plot(mysum$resid, type='b', pch=19, main='Residuals', ylab='value of Residuals', xlab='time or index')
grid()
dev.off()
bitmap(file='test2.png')
hist(mysum$resid, main='Residual Histogram', xlab='values of Residuals')
grid()
dev.off()
bitmap(file='test3.png')
densityplot(~mysum$resid,col='black',main='Residual Density Plot', xlab='values of Residuals')
dev.off()
bitmap(file='test4.png')
qqnorm(mysum$resid, main='Residual Normal Q-Q Plot')
qqline(mysum$resid)
grid()
dev.off()
(myerror <- as.ts(mysum$resid))
bitmap(file='test5.png')
dum <- cbind(lag(myerror,k=1),myerror)
dum
dum1 <- dum[2:length(myerror),]
dum1
z <- as.data.frame(dum1)
z
plot(z,main=paste('Residual Lag plot, lowess, and regression line'), ylab='values of Residuals', xlab='lagged values of Residuals')
lines(lowess(z))
abline(lm(z))
grid()
dev.off()
bitmap(file='test6.png')
acf(mysum$resid, lag.max=length(mysum$resid)/2, main='Residual Autocorrelation Function')
grid()
dev.off()
bitmap(file='test7.png')
pacf(mysum$resid, lag.max=length(mysum$resid)/2, main='Residual Partial Autocorrelation Function')
grid()
dev.off()
bitmap(file='test8.png')
opar <- par(mfrow = c(2,2), oma = c(0, 0, 1.1, 0))
plot(mylm, las = 1, sub='Residual Diagnostics')
par(opar)
dev.off()
if (n > n25) {
bitmap(file='test9.png')
plot(kp3:nmkm3,gqarr[,2], main='Goldfeld-Quandt test',ylab='2-sided p-value',xlab='breakpoint')
grid()
dev.off()
}
load(file='createtable')
a<-table.start()
a<-table.row.start(a)
a<-table.element(a, 'Multiple Linear Regression - Estimated Regression Equation', 1, TRUE)
a<-table.row.end(a)
myeq <- colnames(x)[1]
myeq <- paste(myeq, '[t] = ', sep='')
for (i in 1:k){
if (mysum$coefficients[i,1] > 0) myeq <- paste(myeq, '+', '')
myeq <- paste(myeq, mysum$coefficients[i,1], sep=' ')
if (rownames(mysum$coefficients)[i] != '(Intercept)') {
myeq <- paste(myeq, rownames(mysum$coefficients)[i], sep='')
if (rownames(mysum$coefficients)[i] != 't') myeq <- paste(myeq, '[t]', sep='')
}
}
myeq <- paste(myeq, ' + e[t]')
a<-table.row.start(a)
a<-table.element(a, myeq)
a<-table.row.end(a)
a<-table.end(a)
table.save(a,file='mytable1.tab')
a<-table.start()
a<-table.row.start(a)
a<-table.element(a,hyperlink('ols1.htm','Multiple Linear Regression - Ordinary Least Squares',''), 6, TRUE)
a<-table.row.end(a)
a<-table.row.start(a)
a<-table.element(a,'Variable',header=TRUE)
a<-table.element(a,'Parameter',header=TRUE)
a<-table.element(a,'S.D.',header=TRUE)
a<-table.element(a,'T-STAT
H0: parameter = 0',header=TRUE)
a<-table.element(a,'2-tail p-value',header=TRUE)
a<-table.element(a,'1-tail p-value',header=TRUE)
a<-table.row.end(a)
for (i in 1:k){
a<-table.row.start(a)
a<-table.element(a,rownames(mysum$coefficients)[i],header=TRUE)
a<-table.element(a,mysum$coefficients[i,1])
a<-table.element(a, round(mysum$coefficients[i,2],6))
a<-table.element(a, round(mysum$coefficients[i,3],4))
a<-table.element(a, round(mysum$coefficients[i,4],6))
a<-table.element(a, round(mysum$coefficients[i,4]/2,6))
a<-table.row.end(a)
}
a<-table.end(a)
table.save(a,file='mytable2.tab')
a<-table.start()
a<-table.row.start(a)
a<-table.element(a, 'Multiple Linear Regression - Regression Statistics', 2, TRUE)
a<-table.row.end(a)
a<-table.row.start(a)
a<-table.element(a, 'Multiple R',1,TRUE)
a<-table.element(a, sqrt(mysum$r.squared))
a<-table.row.end(a)
a<-table.row.start(a)
a<-table.element(a, 'R-squared',1,TRUE)
a<-table.element(a, mysum$r.squared)
a<-table.row.end(a)
a<-table.row.start(a)
a<-table.element(a, 'Adjusted R-squared',1,TRUE)
a<-table.element(a, mysum$adj.r.squared)
a<-table.row.end(a)
a<-table.row.start(a)
a<-table.element(a, 'F-TEST (value)',1,TRUE)
a<-table.element(a, mysum$fstatistic[1])
a<-table.row.end(a)
a<-table.row.start(a)
a<-table.element(a, 'F-TEST (DF numerator)',1,TRUE)
a<-table.element(a, mysum$fstatistic[2])
a<-table.row.end(a)
a<-table.row.start(a)
a<-table.element(a, 'F-TEST (DF denominator)',1,TRUE)
a<-table.element(a, mysum$fstatistic[3])
a<-table.row.end(a)
a<-table.row.start(a)
a<-table.element(a, 'p-value',1,TRUE)
a<-table.element(a, 1-pf(mysum$fstatistic[1],mysum$fstatistic[2],mysum$fstatistic[3]))
a<-table.row.end(a)
a<-table.row.start(a)
a<-table.element(a, 'Multiple Linear Regression - Residual Statistics', 2, TRUE)
a<-table.row.end(a)
a<-table.row.start(a)
a<-table.element(a, 'Residual Standard Deviation',1,TRUE)
a<-table.element(a, mysum$sigma)
a<-table.row.end(a)
a<-table.row.start(a)
a<-table.element(a, 'Sum Squared Residuals',1,TRUE)
a<-table.element(a, sum(myerror*myerror))
a<-table.row.end(a)
a<-table.end(a)
table.save(a,file='mytable3.tab')
a<-table.start()
a<-table.row.start(a)
a<-table.element(a, 'Multiple Linear Regression - Actuals, Interpolation, and Residuals', 4, TRUE)
a<-table.row.end(a)
a<-table.row.start(a)
a<-table.element(a, 'Time or Index', 1, TRUE)
a<-table.element(a, 'Actuals', 1, TRUE)
a<-table.element(a, 'Interpolation
Forecast', 1, TRUE)
a<-table.element(a, 'Residuals
Prediction Error', 1, TRUE)
a<-table.row.end(a)
for (i in 1:n) {
a<-table.row.start(a)
a<-table.element(a,i, 1, TRUE)
a<-table.element(a,x[i])
a<-table.element(a,x[i]-mysum$resid[i])
a<-table.element(a,mysum$resid[i])
a<-table.row.end(a)
}
a<-table.end(a)
table.save(a,file='mytable4.tab')
if (n > n25) {
a<-table.start()
a<-table.row.start(a)
a<-table.element(a,'Goldfeld-Quandt test for Heteroskedasticity',4,TRUE)
a<-table.row.end(a)
a<-table.row.start(a)
a<-table.element(a,'p-values',header=TRUE)
a<-table.element(a,'Alternative Hypothesis',3,header=TRUE)
a<-table.row.end(a)
a<-table.row.start(a)
a<-table.element(a,'breakpoint index',header=TRUE)
a<-table.element(a,'greater',header=TRUE)
a<-table.element(a,'2-sided',header=TRUE)
a<-table.element(a,'less',header=TRUE)
a<-table.row.end(a)
for (mypoint in kp3:nmkm3) {
a<-table.row.start(a)
a<-table.element(a,mypoint,header=TRUE)
a<-table.element(a,gqarr[mypoint-kp3+1,1])
a<-table.element(a,gqarr[mypoint-kp3+1,2])
a<-table.element(a,gqarr[mypoint-kp3+1,3])
a<-table.row.end(a)
}
a<-table.end(a)
table.save(a,file='mytable5.tab')
a<-table.start()
a<-table.row.start(a)
a<-table.element(a,'Meta Analysis of Goldfeld-Quandt test for Heteroskedasticity',4,TRUE)
a<-table.row.end(a)
a<-table.row.start(a)
a<-table.element(a,'Description',header=TRUE)
a<-table.element(a,'# significant tests',header=TRUE)
a<-table.element(a,'% significant tests',header=TRUE)
a<-table.element(a,'OK/NOK',header=TRUE)
a<-table.row.end(a)
a<-table.row.start(a)
a<-table.element(a,'1% type I error level',header=TRUE)
a<-table.element(a,numsignificant1)
a<-table.element(a,numsignificant1/numgqtests)
if (numsignificant1/numgqtests < 0.01) dum <- 'OK' else dum <- 'NOK'
a<-table.element(a,dum)
a<-table.row.end(a)
a<-table.row.start(a)
a<-table.element(a,'5% type I error level',header=TRUE)
a<-table.element(a,numsignificant5)
a<-table.element(a,numsignificant5/numgqtests)
if (numsignificant5/numgqtests < 0.05) dum <- 'OK' else dum <- 'NOK'
a<-table.element(a,dum)
a<-table.row.end(a)
a<-table.row.start(a)
a<-table.element(a,'10% type I error level',header=TRUE)
a<-table.element(a,numsignificant10)
a<-table.element(a,numsignificant10/numgqtests)
if (numsignificant10/numgqtests < 0.1) dum <- 'OK' else dum <- 'NOK'
a<-table.element(a,dum)
a<-table.row.end(a)
a<-table.end(a)
table.save(a,file='mytable6.tab')
}