| Multiple Linear Regression - Estimated Regression Equation |
| Y[t] = + 157.408340638105 + 6.71775436425413X[t] + 73.6190344690601M1[t] -152.621373147782M2[t] + 811.82046487112M3[t] + 281.236506381427M4[t] + 269.186386544672M5[t] + 321.028224563574M6[t] + 309.149687087614M7[t] + 379.447974233666M8[t] -204.535984256028M9[t] + 89.5445485257692M10[t] + 126.913397080757M11[t] -10.7337958745601t + e[t] |
| Multiple Linear Regression - Ordinary Least Squares | |||||
| Variable | Parameter | S.D. | T-STAT H0: parameter = 0 | 2-tail p-value | 1-tail p-value |
| (Intercept) | 157.408340638105 | 1372.401415 | 0.1147 | 0.90926 | 0.45463 |
| X | 6.71775436425413 | 4.070619 | 1.6503 | 0.106713 | 0.053356 |
| M1 | 73.6190344690601 | 104.558244 | 0.7041 | 0.485452 | 0.242726 |
| M2 | -152.621373147782 | 104.67863 | -1.458 | 0.152648 | 0.076324 |
| M3 | 811.82046487112 | 104.507974 | 7.768 | 0 | 0 |
| M4 | 281.236506381427 | 104.621485 | 2.6881 | 0.010422 | 0.005211 |
| M5 | 269.186386544672 | 104.155534 | 2.5845 | 0.013509 | 0.006754 |
| M6 | 321.028224563574 | 104.143122 | 3.0826 | 0.003708 | 0.001854 |
| M7 | 309.149687087614 | 110.338 | 2.8018 | 0.007794 | 0.003897 |
| M8 | 379.447974233666 | 110.11064 | 3.4461 | 0.00135 | 0.000675 |
| M9 | -204.535984256028 | 110.182641 | -1.8563 | 0.070782 | 0.035391 |
| M10 | 89.5445485257692 | 109.833515 | 0.8153 | 0.419743 | 0.209871 |
| M11 | 126.913397080757 | 109.787709 | 1.156 | 0.254544 | 0.127272 |
| t | -10.7337958745601 | 6.129518 | -1.7512 | 0.087583 | 0.043792 |
| Multiple Linear Regression - Regression Statistics | |
| Multiple R | 0.89393475993487 |
| R-squared | 0.799119355019813 |
| Adjusted R-squared | 0.733833145401252 |
| F-TEST (value) | 12.2402473614064 |
| F-TEST (DF numerator) | 13 |
| F-TEST (DF denominator) | 40 |
| p-value | 4.00819044621414e-10 |
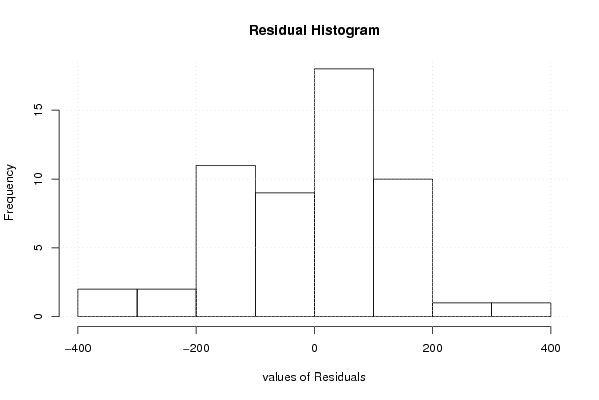
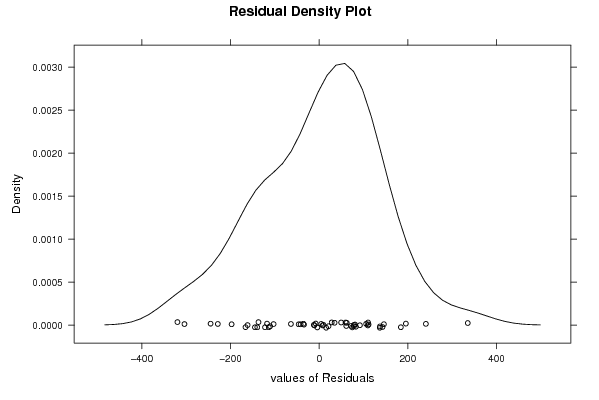
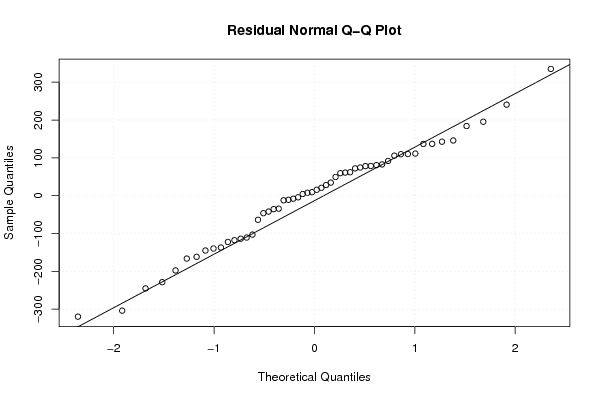
| Multiple Linear Regression - Residual Statistics | |
| Residual Standard Deviation | 155.246214471875 |
| Sum Squared Residuals | 964055.484313893 |
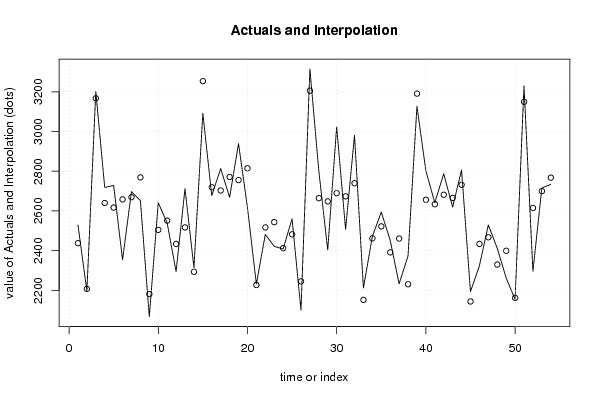
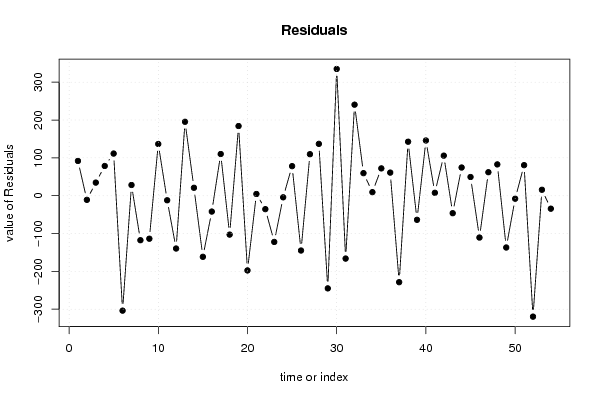
| Multiple Linear Regression - Actuals, Interpolation, and Residuals | |||
| Time or Index | Actuals | Interpolation Forecast | Residuals Prediction Error |
| 1 | 2529 | 2437.15251943648 | 91.8474805635247 |
| 2 | 2196 | 2206.89607030932 | -10.8960703093216 |
| 3 | 3202 | 3167.32186681792 | 34.6781331820815 |
| 4 | 2718 | 2639.43962118217 | 78.5603788178279 |
| 5 | 2728 | 2616.65570547086 | 111.344294529143 |
| 6 | 2354 | 2657.7637476152 | -303.7637476152 |
| 7 | 2697 | 2668.74018608595 | 28.2598139140501 |
| 8 | 2651 | 2768.61120354297 | -117.611203542966 |
| 9 | 2067 | 2180.61120354297 | -113.611203542966 |
| 10 | 2641 | 2504.26446663573 | 136.735533364272 |
| 11 | 2539 | 2551.05278240892 | -12.0527824089194 |
| 12 | 2294 | 2433.55885254636 | -139.558852546364 |
| 13 | 2712 | 2516.59735423363 | 195.402645766374 |
| 14 | 2314 | 2293.05865947073 | 20.9413405292676 |
| 15 | 3092 | 3253.48445597933 | -161.484455979329 |
| 16 | 2677 | 2718.88445597933 | -41.8844559793291 |
| 17 | 2813 | 2702.81829463227 | 110.181705367731 |
| 18 | 2668 | 2770.79735423363 | -102.797354233627 |
| 19 | 2939 | 2754.90277524736 | 184.097224752639 |
| 20 | 2617 | 2814.46726651885 | -197.467266518853 |
| 21 | 2231 | 2226.46726651885 | 4.53273348114763 |
| 22 | 2481 | 2516.53175779034 | -35.5317577903442 |
| 23 | 2421 | 2543.16681047077 | -122.166810470772 |
| 24 | 2408 | 2412.23737187971 | -4.23737187970886 |
| 25 | 2560 | 2481.84036483846 | 78.1596351615372 |
| 26 | 2100 | 2244.86616134706 | -144.866161347061 |
| 27 | 3315 | 3205.29195785566 | 109.708042144343 |
| 28 | 2801 | 2663.9742034914 | 137.025796508597 |
| 29 | 2403 | 2647.90804214434 | -244.908042144343 |
| 30 | 3024 | 2689.01608428868 | 334.983915711315 |
| 31 | 2507 | 2673.12150530242 | -166.121505302418 |
| 32 | 2980 | 2739.40375093816 | 240.596249061836 |
| 33 | 2211 | 2151.40375093816 | 59.5962490618359 |
| 34 | 2471 | 2461.62150530242 | 9.37849469758168 |
| 35 | 2594 | 2521.84532980412 | 72.1546701958829 |
| 36 | 2452 | 2390.91589121305 | 61.0841087869463 |
| 37 | 2232 | 2460.51888417181 | -228.518884171808 |
| 38 | 2373 | 2230.26243504466 | 142.737564955340 |
| 39 | 3127 | 3190.68823155326 | -63.6882315532563 |
| 40 | 2802 | 2656.08823155326 | 145.911768446744 |
| 41 | 2641 | 2633.30431584194 | 7.69568415805832 |
| 42 | 2787 | 2681.13011235054 | 105.869887649462 |
| 43 | 2619 | 2665.23553336427 | -46.2355333642713 |
| 44 | 2806 | 2731.51777900002 | 74.4822209999828 |
| 45 | 2193 | 2143.51777900002 | 49.4822209999828 |
| 46 | 2323 | 2433.58227027151 | -110.582270271509 |
| 47 | 2529 | 2466.93507731619 | 62.0649226838087 |
| 48 | 2412 | 2329.28788436087 | 82.7121156391262 |
| 49 | 2262 | 2398.89087731963 | -136.890877319628 |
| 50 | 2154 | 2161.91667382823 | -7.91667382822561 |
| 51 | 3230 | 3149.21348779384 | 80.7865122061612 |
| 52 | 2295 | 2614.61348779384 | -319.613487793839 |
| 53 | 2715 | 2699.31364191059 | 15.6863580894098 |
| 54 | 2733 | 2767.29270151195 | -34.2927015119492 |
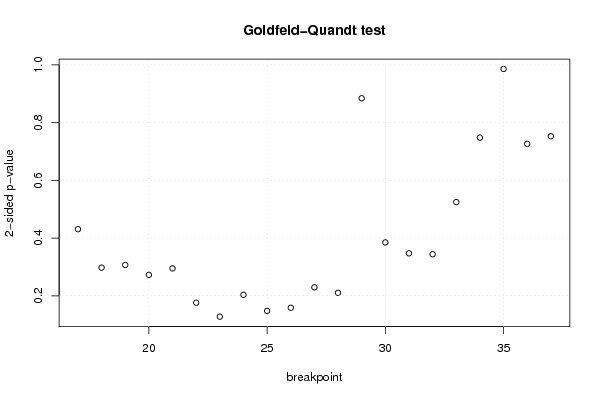
| Goldfeld-Quandt test for Heteroskedasticity | |||
| p-values | Alternative Hypothesis | ||
| breakpoint index | greater | 2-sided | less |
| 17 | 0.215374159893631 | 0.430748319787262 | 0.784625840106369 |
| 18 | 0.148745898559208 | 0.297491797118416 | 0.851254101440792 |
| 19 | 0.153381465084438 | 0.306762930168877 | 0.846618534915562 |
| 20 | 0.136226775698975 | 0.272453551397950 | 0.863773224301025 |
| 21 | 0.147510415877808 | 0.295020831755616 | 0.852489584122192 |
| 22 | 0.0880164781449349 | 0.176032956289870 | 0.911983521855065 |
| 23 | 0.0638486205621537 | 0.127697241124307 | 0.936151379437846 |
| 24 | 0.101623647893315 | 0.203247295786629 | 0.898376352106685 |
| 25 | 0.0738008410490863 | 0.147601682098173 | 0.926199158950914 |
| 26 | 0.0791824365509498 | 0.158364873101900 | 0.92081756344905 |
| 27 | 0.114646077313128 | 0.229292154626256 | 0.885353922686872 |
| 28 | 0.105127255208191 | 0.210254510416381 | 0.894872744791809 |
| 29 | 0.442146252460393 | 0.884292504920786 | 0.557853747539607 |
| 30 | 0.807551620248241 | 0.384896759503517 | 0.192448379751759 |
| 31 | 0.826433686357034 | 0.347132627285931 | 0.173566313642966 |
| 32 | 0.828063796035259 | 0.343872407929482 | 0.171936203964741 |
| 33 | 0.73772238366556 | 0.524555232668881 | 0.262277616334440 |
| 34 | 0.626039308550935 | 0.74792138289813 | 0.373960691449065 |
| 35 | 0.49292114324439 | 0.98584228648878 | 0.50707885675561 |
| 36 | 0.363284529499238 | 0.726569058998476 | 0.636715470500762 |
| 37 | 0.376408469887565 | 0.75281693977513 | 0.623591530112435 |
| Meta Analysis of Goldfeld-Quandt test for Heteroskedasticity | |||
| Description | # significant tests | % significant tests | OK/NOK |
| 1% type I error level | 0 | 0 | OK |
| 5% type I error level | 0 | 0 | OK |
| 10% type I error level | 0 | 0 | OK |