| Multiple Linear Regression - Estimated Regression Equation |
| Y[t] = + 632.244505651929 + 6.14920105647311X[t] + 70.0919714626187M1[t] -21.2602057945611M2[t] + 119.638415891786M3[t] -509.343601576689M4[t] -182.313541791994M5[t] -130.214920105647M6[t] -247.918507903497M7[t] -199.249726428445M8[t] -400.681743896919M9[t] + 547.587836521659M10[t] -2.53068226740704M11[t] -10.9671835879982t + e[t] |
| Multiple Linear Regression - Ordinary Least Squares | |||||
| Variable | Parameter | S.D. | T-STAT H0: parameter = 0 | 2-tail p-value | 1-tail p-value |
| (Intercept) | 632.244505651929 | 1461.420121 | 0.4326 | 0.667612 | 0.333806 |
| X | 6.14920105647311 | 4.334653 | 1.4186 | 0.163757 | 0.081878 |
| M1 | 70.0919714626187 | 111.340253 | 0.6295 | 0.532582 | 0.266291 |
| M2 | -21.2602057945611 | 111.468448 | -0.1907 | 0.849703 | 0.424852 |
| M3 | 119.638415891786 | 111.286723 | 1.075 | 0.288796 | 0.144398 |
| M4 | -509.343601576689 | 111.407597 | -4.5719 | 4.6e-05 | 2.3e-05 |
| M5 | -182.313541791994 | 110.911423 | -1.6438 | 0.108061 | 0.05403 |
| M6 | -130.214920105647 | 110.898206 | -1.1742 | 0.247265 | 0.123632 |
| M7 | -247.918507903497 | 117.494905 | -2.11 | 0.041158 | 0.020579 |
| M8 | -199.249726428445 | 117.252797 | -1.6993 | 0.097025 | 0.048513 |
| M9 | -400.681743896919 | 117.329468 | -3.415 | 0.001475 | 0.000738 |
| M10 | 547.587836521659 | 116.957697 | 4.6819 | 3.2e-05 | 1.6e-05 |
| M11 | -2.53068226740704 | 116.90892 | -0.0216 | 0.982837 | 0.491419 |
| t | -10.9671835879982 | 6.5271 | -1.6803 | 0.100703 | 0.050351 |
| Multiple Linear Regression - Regression Statistics | |
| Multiple R | 0.878170238609815 |
| R-squared | 0.77118296798002 |
| Adjusted R-squared | 0.696817432573527 |
| F-TEST (value) | 10.3701662842151 |
| F-TEST (DF numerator) | 13 |
| F-TEST (DF denominator) | 40 |
| p-value | 4.5114849633876e-09 |
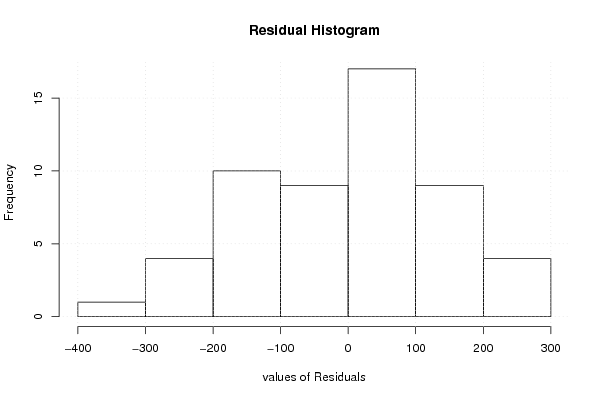
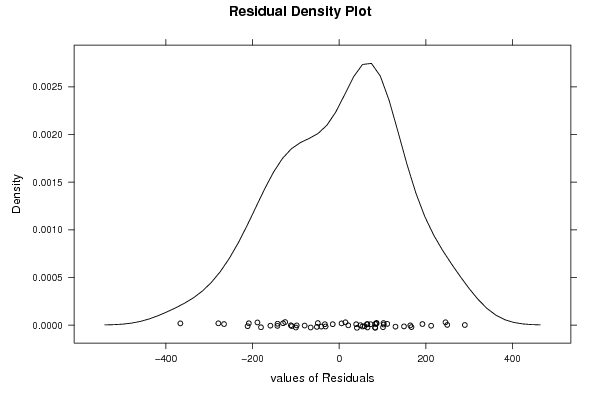
| Multiple Linear Regression - Residual Statistics | |
| Residual Standard Deviation | 165.316021337892 |
| Sum Squared Residuals | 1093175.47643962 |
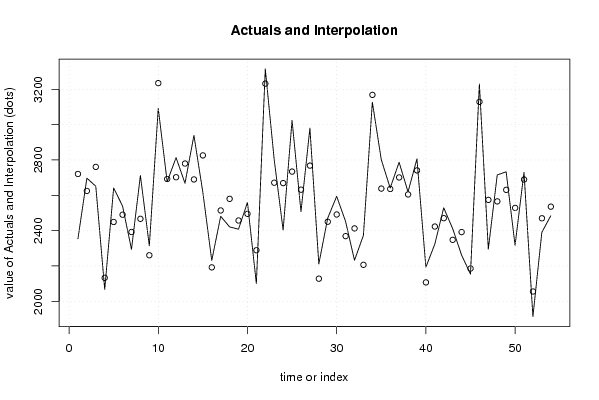
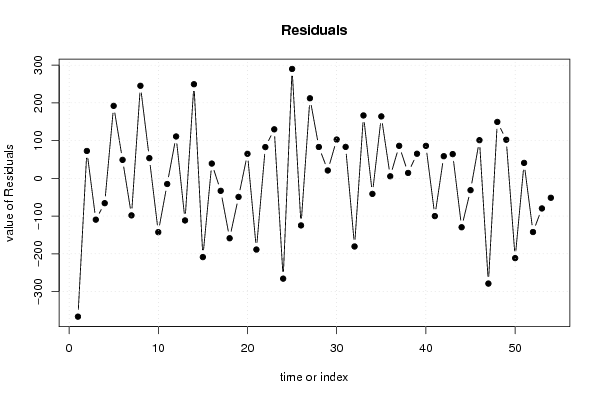
| Multiple Linear Regression - Actuals, Interpolation, and Residuals | |||
| Time or Index | Actuals | Interpolation Forecast | Residuals Prediction Error |
| 1 | 2354 | 2720.60564216268 | -366.60564216268 |
| 2 | 2697 | 2624.43548237397 | 72.5645176260287 |
| 3 | 2651 | 2760.51612152879 | -109.516121528793 |
| 4 | 2067 | 2132.86532258527 | -65.8653225852655 |
| 5 | 2641 | 2448.92819878196 | 192.071801218038 |
| 6 | 2539 | 2490.05963688031 | 48.9403631196892 |
| 7 | 2294 | 2392.13487077683 | -98.1348707768288 |
| 8 | 2712 | 2466.73167500272 | 245.268324997279 |
| 9 | 2314 | 2260.48167500272 | 53.5183249972787 |
| 10 | 3092 | 3234.67927817214 | -142.679278172141 |
| 11 | 2677 | 2692.04117896450 | -15.0411789644958 |
| 12 | 2813 | 2702.05228081332 | 110.947719186676 |
| 13 | 2668 | 2779.62467185736 | -111.624671857363 |
| 14 | 2939 | 2689.60371312513 | 249.396286874868 |
| 15 | 2617 | 2825.68435227995 | -208.684352279953 |
| 16 | 2231 | 2191.88435227995 | 39.1156477200466 |
| 17 | 2481 | 2514.09642953312 | -33.0964295331232 |
| 18 | 2421 | 2579.82467185736 | -158.824671857364 |
| 19 | 2408 | 2457.30310152799 | -49.3031015279895 |
| 20 | 2560 | 2495.00469941504 | 64.9953005849567 |
| 21 | 2100 | 2288.75469941504 | -188.754699415043 |
| 22 | 3315 | 3232.2062973021 | 82.793702697903 |
| 23 | 2801 | 2671.12059492503 | 129.879405074968 |
| 24 | 2403 | 2668.83329466091 | -265.833294660914 |
| 25 | 3024 | 2734.10728359201 | 289.892716407992 |
| 26 | 2507 | 2631.78792274683 | -124.78792274683 |
| 27 | 2980 | 2767.86856190165 | 212.131438098349 |
| 28 | 2211 | 2127.91936084518 | 83.0806391548213 |
| 29 | 2471 | 2450.13143809835 | 20.8685619016516 |
| 30 | 2594 | 2491.26287619670 | 102.737123803303 |
| 31 | 2452 | 2368.74130586732 | 83.2586941326776 |
| 32 | 2232 | 2412.59210481085 | -180.592104810849 |
| 33 | 2373 | 2206.34210481085 | 166.657895189151 |
| 34 | 3127 | 3168.24130586732 | -41.2413058673222 |
| 35 | 2802 | 2637.90160877262 | 164.098391227377 |
| 36 | 2641 | 2635.61430850851 | 5.38569149149479 |
| 37 | 2787 | 2700.8882974396 | 86.1117025604014 |
| 38 | 2619 | 2604.71813765089 | 14.2818623491061 |
| 39 | 2806 | 2740.79877680572 | 65.2012231942845 |
| 40 | 2193 | 2106.99877680572 | 86.0012231942845 |
| 41 | 2323 | 2423.06165300241 | -100.061653002412 |
| 42 | 2529 | 2470.34229215723 | 58.6577078427661 |
| 43 | 2412 | 2347.82072182786 | 64.1792781721407 |
| 44 | 2262 | 2391.67152077139 | -129.671520771386 |
| 45 | 2154 | 2185.42152077139 | -31.4215207713861 |
| 46 | 3230 | 3128.87311865844 | 101.126881341560 |
| 47 | 2295 | 2573.93661733785 | -278.936617337848 |
| 48 | 2715 | 2565.50011601726 | 149.499883982743 |
| 49 | 2733 | 2630.77410494835 | 102.225895051649 |
| 50 | 2317 | 2528.45474410317 | -211.454744103173 |
| 51 | 2730 | 2689.13218748389 | 40.8678125161131 |
| 52 | 1913 | 2055.33218748389 | -142.332187483887 |
| 53 | 2390 | 2469.78228058415 | -79.7822805841535 |
| 54 | 2484 | 2535.51052290839 | -51.5105229083943 |
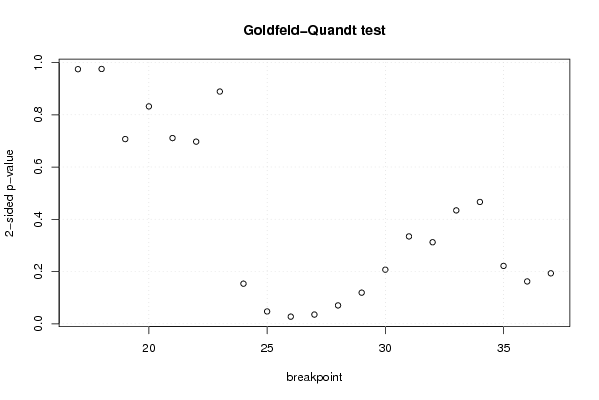
| Goldfeld-Quandt test for Heteroskedasticity | |||
| p-values | Alternative Hypothesis | ||
| breakpoint index | greater | 2-sided | less |
| 17 | 0.48726721964324 | 0.97453443928648 | 0.51273278035676 |
| 18 | 0.48768556490862 | 0.97537112981724 | 0.51231443509138 |
| 19 | 0.353518613416789 | 0.707037226833578 | 0.646481386583211 |
| 20 | 0.583948903700651 | 0.832102192598699 | 0.416051096299349 |
| 21 | 0.644559093926964 | 0.710881812146073 | 0.355440906073036 |
| 22 | 0.651422663209063 | 0.697154673581874 | 0.348577336790937 |
| 23 | 0.555547157176050 | 0.8889056856479 | 0.44445284282395 |
| 24 | 0.923206128458256 | 0.153587743083489 | 0.0767938715417443 |
| 25 | 0.976351896100162 | 0.047296207799675 | 0.0236481038998375 |
| 26 | 0.986280074570088 | 0.0274398508598237 | 0.0137199254299119 |
| 27 | 0.982293924305201 | 0.0354121513895978 | 0.0177060756947989 |
| 28 | 0.964762598469404 | 0.0704748030611929 | 0.0352374015305964 |
| 29 | 0.940382174853949 | 0.119235650292102 | 0.0596178251460512 |
| 30 | 0.896374988059373 | 0.207250023881253 | 0.103625011940627 |
| 31 | 0.832777637189325 | 0.334444725621350 | 0.167222362810675 |
| 32 | 0.843905980774298 | 0.312188038451404 | 0.156094019225702 |
| 33 | 0.782949886125718 | 0.434100227748563 | 0.217050113874282 |
| 34 | 0.766826999891848 | 0.466346000216304 | 0.233173000108152 |
| 35 | 0.889162939520421 | 0.221674120959157 | 0.110837060479579 |
| 36 | 0.918890215088324 | 0.162219569823351 | 0.0811097849116756 |
| 37 | 0.903347445104934 | 0.193305109790133 | 0.0966525548950663 |
| Meta Analysis of Goldfeld-Quandt test for Heteroskedasticity | |||
| Description | # significant tests | % significant tests | OK/NOK |
| 1% type I error level | 0 | 0 | OK |
| 5% type I error level | 3 | 0.142857142857143 | NOK |
| 10% type I error level | 4 | 0.190476190476190 | NOK |