| Multiple Linear Regression - Estimated Regression Equation |
| Y[t] = + 2.06927334447505 -0.0797015328416982X[t] + 1.39881716350103Y1[t] -0.633441242873896Y2[t] -0.0335768798788945M1[t] -0.0768525073841112M2[t] + 0.0358245516507144M3[t] -0.0767177553795189M4[t] + 0.078013091687698M5[t] -0.0331205954376406M6[t] -0.0843123036080516M7[t] -0.0136287700007924M8[t] -0.0542657039509433M9[t] + 0.0657425302264035M10[t] -0.0510501938447505M11[t] -0.00610933566969867t + e[t] |
| Multiple Linear Regression - Ordinary Least Squares | |||||
| Variable | Parameter | S.D. | T-STAT H0: parameter = 0 | 2-tail p-value | 1-tail p-value |
| (Intercept) | 2.06927334447505 | 0.587125 | 3.5244 | 0.00104 | 0.00052 |
| X | -0.0797015328416982 | 0.084142 | -0.9472 | 0.348941 | 0.174471 |
| Y1 | 1.39881716350103 | 0.121775 | 11.4869 | 0 | 0 |
| Y2 | -0.633441242873896 | 0.124017 | -5.1077 | 7e-06 | 4e-06 |
| M1 | -0.0335768798788945 | 0.113042 | -0.297 | 0.767907 | 0.383954 |
| M2 | -0.0768525073841112 | 0.112984 | -0.6802 | 0.500105 | 0.250053 |
| M3 | 0.0358245516507144 | 0.113091 | 0.3168 | 0.752983 | 0.376491 |
| M4 | -0.0767177553795189 | 0.11335 | -0.6768 | 0.502231 | 0.251116 |
| M5 | 0.078013091687698 | 0.112986 | 0.6905 | 0.4937 | 0.24685 |
| M6 | -0.0331205954376406 | 0.113996 | -0.2905 | 0.772832 | 0.386416 |
| M7 | -0.0843123036080516 | 0.113241 | -0.7445 | 0.460695 | 0.230348 |
| M8 | -0.0136287700007924 | 0.113018 | -0.1206 | 0.904591 | 0.452296 |
| M9 | -0.0542657039509433 | 0.113129 | -0.4797 | 0.633945 | 0.316973 |
| M10 | 0.0657425302264035 | 0.11341 | 0.5797 | 0.565221 | 0.282611 |
| M11 | -0.0510501938447505 | 0.119009 | -0.429 | 0.670144 | 0.335072 |
| t | -0.00610933566969867 | 0.00245 | -2.494 | 0.016651 | 0.008326 |
| Multiple Linear Regression - Regression Statistics | |
| Multiple R | 0.975611291691286 |
| R-squared | 0.95181739247554 |
| Adjusted R-squared | 0.934609318359662 |
| F-TEST (value) | 55.3122555183133 |
| F-TEST (DF numerator) | 15 |
| F-TEST (DF denominator) | 42 |
| p-value | 0 |
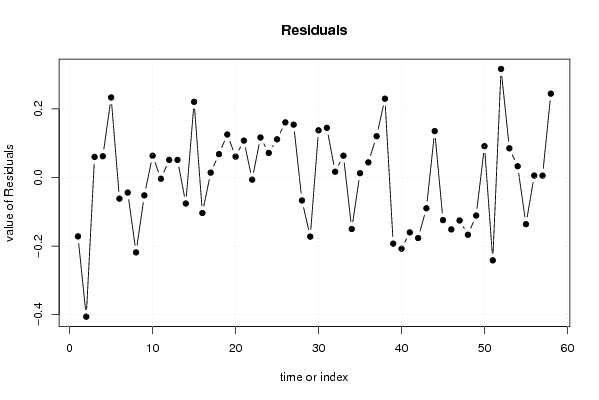
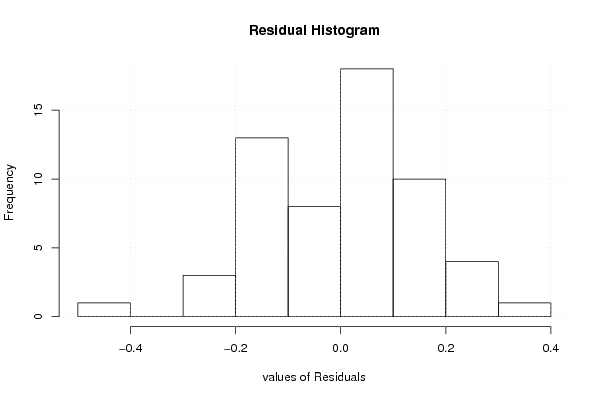
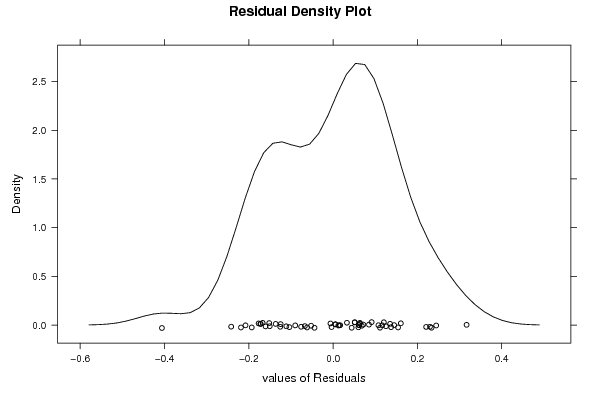
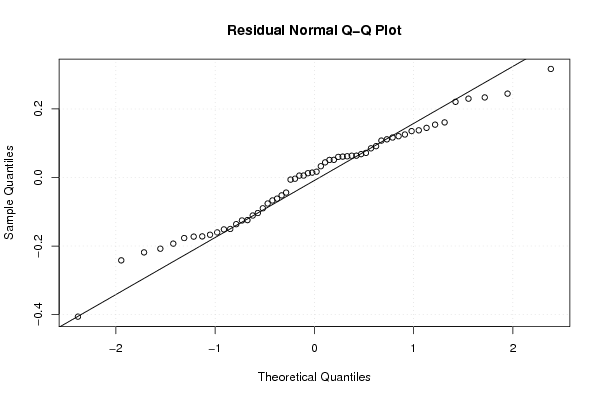
| Multiple Linear Regression - Residual Statistics | |
| Residual Standard Deviation | 0.168088897767444 |
| Sum Squared Residuals | 1.18666285721232 |
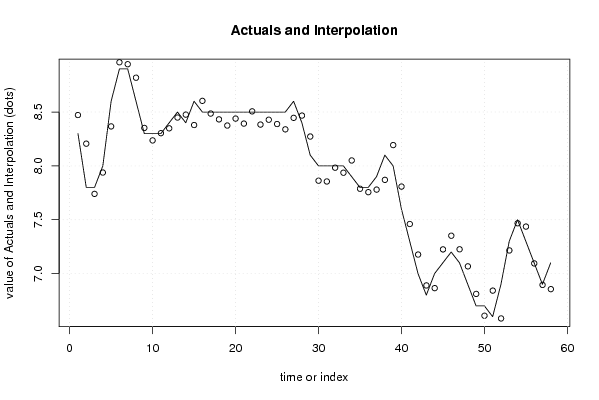
| Multiple Linear Regression - Actuals, Interpolation, and Residuals | |||
| Time or Index | Actuals | Interpolation Forecast | Residuals Prediction Error |
| 1 | 8.3 | 8.4719383299697 | -0.171938329969697 |
| 2 | 7.8 | 8.20613405838197 | -0.406134058381967 |
| 3 | 7.8 | 7.73998144857136 | 0.0600185514286436 |
| 4 | 8 | 7.93805042730837 | 0.0619495726916263 |
| 5 | 8.6 | 8.3664353714061 | 0.233564628593901 |
| 6 | 8.9 | 8.9617943981369 | -0.0617943981368987 |
| 7 | 8.9 | 8.94407375762276 | -0.0440737576227613 |
| 8 | 8.6 | 8.81861558269815 | -0.218615582698153 |
| 9 | 8.3 | 8.352224164028 | -0.0522241640279928 |
| 10 | 8.3 | 8.2365102863475 | 0.0634897136524972 |
| 11 | 8.3 | 8.30364059946882 | -0.00364059946881829 |
| 12 | 8.4 | 8.34858145764387 | 0.0514185423561296 |
| 13 | 8.5 | 8.44877695844538 | 0.0512230415546199 |
| 14 | 8.4 | 8.47592958733318 | -0.0759295873331775 |
| 15 | 8.6 | 8.37927147006081 | 0.220728529939187 |
| 16 | 8.5 | 8.60372738434848 | -0.103727384348475 |
| 17 | 8.5 | 8.48577893082111 | 0.0142210691788878 |
| 18 | 8.5 | 8.43188003231346 | 0.0681199676865357 |
| 19 | 8.5 | 8.37457898847335 | 0.125421011526645 |
| 20 | 8.5 | 8.43915318641091 | 0.0608468135890848 |
| 21 | 8.5 | 8.39240691679107 | 0.107593083208934 |
| 22 | 8.5 | 8.50630581529871 | -0.00630581529871382 |
| 23 | 8.5 | 8.38340375555786 | 0.116596244442139 |
| 24 | 8.5 | 8.42834461373291 | 0.071655386267087 |
| 25 | 8.5 | 8.38865839818432 | 0.111341601815680 |
| 26 | 8.5 | 8.3392734350094 | 0.160726564990596 |
| 27 | 8.6 | 8.44584115837453 | 0.154158841625468 |
| 28 | 8.4 | 8.4670712320247 | -0.0670712320247015 |
| 29 | 8.1 | 8.27258518643463 | -0.172585186434626 |
| 30 | 8 | 7.86238526316406 | 0.137614736835943 |
| 31 | 8 | 7.85523487583601 | 0.144765124163985 |
| 32 | 8 | 7.98315319806096 | 0.0168468019390354 |
| 33 | 8 | 7.93640692844111 | 0.063593071558885 |
| 34 | 7.9 | 8.05030582694876 | -0.150305826948763 |
| 35 | 7.8 | 7.7875220508578 | 0.0124779491421919 |
| 36 | 7.8 | 7.75592531697015 | 0.0440746830298544 |
| 37 | 7.9 | 7.77958322570894 | 0.120416774291058 |
| 38 | 8.1 | 7.87007997888413 | 0.229920021115869 |
| 39 | 8 | 8.19306701066207 | -0.193067010662073 |
| 40 | 7.6 | 7.80784540303726 | -0.20784540303726 |
| 41 | 7.3 | 7.46028417332175 | -0.160284173321755 |
| 42 | 7 | 7.17677249862597 | -0.176772498625967 |
| 43 | 6.8 | 6.88985867859772 | -0.089858678597718 |
| 44 | 7 | 6.86470181669724 | 0.135298183302759 |
| 45 | 7.1 | 7.22440722835238 | -0.124407228352377 |
| 46 | 7.2 | 7.35149959463535 | -0.151499594635348 |
| 47 | 7.1 | 7.22543359411551 | -0.125433594115513 |
| 48 | 6.9 | 7.06714861165307 | -0.16714861165307 |
| 49 | 6.7 | 6.81104308769166 | -0.111043087691662 |
| 50 | 6.7 | 6.60858294039132 | 0.0914170596086807 |
| 51 | 6.6 | 6.84183891233123 | -0.241838912331226 |
| 52 | 6.9 | 6.58330555328119 | 0.31669444671881 |
| 53 | 7.3 | 7.21491633801641 | 0.0850836619835917 |
| 54 | 7.5 | 7.46716780775961 | 0.0328321922403873 |
| 55 | 7.3 | 7.43625369947015 | -0.136253699470151 |
| 56 | 7.1 | 7.09437621613273 | 0.0056237838672736 |
| 57 | 6.9 | 6.89455476238745 | 0.00544523761255068 |
| 58 | 7.1 | 6.85537847676967 | 0.244621523230327 |
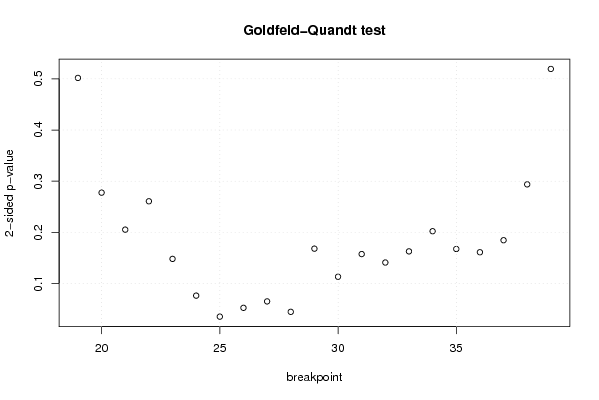
| Goldfeld-Quandt test for Heteroskedasticity | |||
| p-values | Alternative Hypothesis | ||
| breakpoint index | greater | 2-sided | less |
| 19 | 0.250879021910422 | 0.501758043820844 | 0.749120978089578 |
| 20 | 0.138778869348912 | 0.277557738697824 | 0.861221130651088 |
| 21 | 0.102648590634357 | 0.205297181268714 | 0.897351409365643 |
| 22 | 0.130375125372907 | 0.260750250745814 | 0.869624874627093 |
| 23 | 0.0740806770164721 | 0.148161354032944 | 0.925919322983528 |
| 24 | 0.0381795749997823 | 0.0763591499995645 | 0.961820425000218 |
| 25 | 0.0176440846080840 | 0.0352881692161679 | 0.982355915391916 |
| 26 | 0.0262679667706543 | 0.0525359335413086 | 0.973732033229346 |
| 27 | 0.0325580412827049 | 0.0651160825654097 | 0.967441958717295 |
| 28 | 0.0223477494953255 | 0.0446954989906511 | 0.977652250504675 |
| 29 | 0.0840654297527896 | 0.168130859505579 | 0.91593457024721 |
| 30 | 0.0566165290471322 | 0.113233058094264 | 0.943383470952868 |
| 31 | 0.0787901812680195 | 0.157580362536039 | 0.92120981873198 |
| 32 | 0.0705260796382611 | 0.141052159276522 | 0.92947392036174 |
| 33 | 0.0814432641803783 | 0.162886528360757 | 0.918556735819622 |
| 34 | 0.101121009988781 | 0.202242019977562 | 0.898878990011219 |
| 35 | 0.0837883591798034 | 0.167576718359607 | 0.916211640820197 |
| 36 | 0.0805835247069533 | 0.161167049413907 | 0.919416475293047 |
| 37 | 0.092315271054184 | 0.184630542108368 | 0.907684728945816 |
| 38 | 0.146924635079385 | 0.293849270158770 | 0.853075364920615 |
| 39 | 0.740330892265572 | 0.519338215468855 | 0.259669107734428 |
| Meta Analysis of Goldfeld-Quandt test for Heteroskedasticity | |||
| Description | # significant tests | % significant tests | OK/NOK |
| 1% type I error level | 0 | 0 | OK |
| 5% type I error level | 2 | 0.0952380952380952 | NOK |
| 10% type I error level | 5 | 0.238095238095238 | NOK |