Free Statistics

of Irreproducible Research!

Author's title

Author*Unverified author*
R Software Modulerwasp_multipleregression.wasp
Title produced by softwareMultiple Regression
Date of computationFri, 20 Nov 2009 05:56:34 -0700
Cite this page as followsStatistical Computations at FreeStatistics.org, Office for Research Development and Education, URL https://freestatistics.org/blog/index.php?v=date/2009/Nov/20/t1258721846dvy5aolghkcmxpv.htm/, Retrieved Thu, 25 Apr 2024 17:11:04 +0000
Statistical Computations at FreeStatistics.org, Office for Research Development and Education, URL https://freestatistics.org/blog/index.php?pk=58102, Retrieved Thu, 25 Apr 2024 17:11:04 +0000
QR Codes:

Original text written by user:
IsPrivate?No (this computation is public)
User-defined keywords
Estimated Impact126
Family? (F = Feedback message, R = changed R code, M = changed R Module, P = changed Parameters, D = changed Data)
-     [Multiple Regression] [Q1 The Seatbeltlaw] [2007-11-14 19:27:43] [8cd6641b921d30ebe00b648d1481bba0]
- RMPD  [Multiple Regression] [Seatbelt] [2009-11-12 14:03:14] [b98453cac15ba1066b407e146608df68]
-    D      [Multiple Regression] [] [2009-11-20 12:56:34] [d41d8cd98f00b204e9800998ecf8427e] [Current]
Feedback Forum

Post a new message
Dataseries X:
89.1		72.7
82.6		79.7
102.7		115.8
91.8		87.8
94.1		99.2
103.1		111.4
93.2		102.3
91		94.4
94.3		118.5
99.4		112.1
115.7		136.5
116.8		139.8
99.8		104.5
96		123.3
115.9		156.6
109.1		136.2
117.3		147.5
109.8		143.8
112.8		135.8
110.7		121.6
100		128
113.3		129.7
122.4		136.2
112.5		130.5
104.2		99.2
92.5		110.4
117.2		151.6
109.3		129.6
106.1		123.6
118.8		142.7
105.3		119
106		118.1
102		120
112.9		124.3
116.5		123.3
114.8		122.4
100.5		90.5
85.4		91
114.6		137
109.9		127.7
100.7		105.1
115.5		135.6
100.7		112.4
99		102.5
102.3		112.6
108.8		110.8
105.9		103.4
113.2		117.6
95.7		87.5
80.9		87
113.9		130
98.1		102.9
102.8		111.1
104.7		128.9
95.9		106.3
94.6		99
101.6		109.9
103.9		104
110.3		112.9
114.1		113.6


Summary of computational transaction
Raw Inputview raw input (R code)
Raw Outputview raw output of R engine
Computing time3 seconds
R Server'Gwilym Jenkins' @ 72.249.127.135
R Framework error message
Warning: there are blank lines in the 'Data X' field.
Please, use NA for missing data - blank lines are simply
 deleted and are NOT treated as missing values.

\begin{tabular}{lllllllll}
\hline
Summary of computational transaction \tabularnewline
Raw Input & view raw input (R code)  \tabularnewline
Raw Output & view raw output of R engine  \tabularnewline
Computing time & 3 seconds \tabularnewline
R Server & 'Gwilym Jenkins' @ 72.249.127.135 \tabularnewline
R Framework error message & 
Warning: there are blank lines in the 'Data X' field.
Please, use NA for missing data - blank lines are simply
 deleted and are NOT treated as missing values.
\tabularnewline \hline \end{tabular} %Source: https://freestatistics.org/blog/index.php?pk=58102&T=0

[TABLE]
[ROW][C]Summary of computational transaction[/C][/ROW]
[ROW][C]Raw Input[/C][C]view raw input (R code) [/C][/ROW]
[ROW][C]Raw Output[/C][C]view raw output of R engine [/C][/ROW]
[ROW][C]Computing time[/C][C]3 seconds[/C][/ROW]
[ROW][C]R Server[/C][C]'Gwilym Jenkins' @ 72.249.127.135[/C][/ROW]
[ROW][C]R Framework error message[/C][C]
Warning: there are blank lines in the 'Data X' field.
Please, use NA for missing data - blank lines are simply
 deleted and are NOT treated as missing values.
[/C][/ROW] [/TABLE] Source: https://freestatistics.org/blog/index.php?pk=58102&T=0

Globally Unique Identifier (entire table): ba.freestatistics.org/blog/index.php?pk=58102&T=0

As an alternative you can also use a QR Code:  

The GUIDs for individual cells are displayed in the table below:

Summary of computational transaction
Raw Inputview raw input (R code)
Raw Outputview raw output of R engine
Computing time3 seconds
R Server'Gwilym Jenkins' @ 72.249.127.135
R Framework error message
Warning: there are blank lines in the 'Data X' field.
Please, use NA for missing data - blank lines are simply
 deleted and are NOT treated as missing values.


Multiple Linear Regression - Estimated Regression Equation
TotaleIndustrieleProductie[t] = + 65.3855849994479 + 0.391844967146594Investeringsgoederen[t] -3.13645561373052M1[t] -16.4161083706153M2[t] -6.67855945910728M3[t] -7.52875096085604M4[t] -7.14899964574348M5[t] -6.91720624702877M6[t] -8.93045141604976M7[t] -7.10001788019115M8[t] -11.5049221293168M9[t] -3.25013328253928M10[t] + 0.789080323780102M11[t] + e[t]

\begin{tabular}{lllllllll}
\hline
Multiple Linear Regression - Estimated Regression Equation \tabularnewline
TotaleIndustrieleProductie[t] =  +  65.3855849994479 +  0.391844967146594Investeringsgoederen[t] -3.13645561373052M1[t] -16.4161083706153M2[t] -6.67855945910728M3[t] -7.52875096085604M4[t] -7.14899964574348M5[t] -6.91720624702877M6[t] -8.93045141604976M7[t] -7.10001788019115M8[t] -11.5049221293168M9[t] -3.25013328253928M10[t] +  0.789080323780102M11[t]  + e[t] \tabularnewline
\hline
\end{tabular}
%Source: https://freestatistics.org/blog/index.php?pk=58102&T=1

[TABLE]
[ROW][C]Multiple Linear Regression - Estimated Regression Equation[/C][/ROW]
[ROW][C]TotaleIndustrieleProductie[t] =  +  65.3855849994479 +  0.391844967146594Investeringsgoederen[t] -3.13645561373052M1[t] -16.4161083706153M2[t] -6.67855945910728M3[t] -7.52875096085604M4[t] -7.14899964574348M5[t] -6.91720624702877M6[t] -8.93045141604976M7[t] -7.10001788019115M8[t] -11.5049221293168M9[t] -3.25013328253928M10[t] +  0.789080323780102M11[t]  + e[t][/C][/ROW]
[/TABLE]
Source: https://freestatistics.org/blog/index.php?pk=58102&T=1

Globally Unique Identifier (entire table): ba.freestatistics.org/blog/index.php?pk=58102&T=1

As an alternative you can also use a QR Code:  

The GUIDs for individual cells are displayed in the table below:

Multiple Linear Regression - Estimated Regression Equation
TotaleIndustrieleProductie[t] = + 65.3855849994479 + 0.391844967146594Investeringsgoederen[t] -3.13645561373052M1[t] -16.4161083706153M2[t] -6.67855945910728M3[t] -7.52875096085604M4[t] -7.14899964574348M5[t] -6.91720624702877M6[t] -8.93045141604976M7[t] -7.10001788019115M8[t] -11.5049221293168M9[t] -3.25013328253928M10[t] + 0.789080323780102M11[t] + e[t]


Multiple Linear Regression - Ordinary Least Squares
VariableParameterS.D.T-STATH0: parameter = 02-tail p-value1-tail p-value
(Intercept)65.38558499944794.32995315.100800
Investeringsgoederen0.3918449671465940.03265911.998100
M1-3.136455613730522.346995-1.33640.1878620.093931
M2-16.41610837061532.243134-7.318400
M3-6.678559459107282.115353-3.15720.0027810.001391
M4-7.528750960856042.085633-3.60980.0007420.000371
M5-7.148999645743482.083819-3.43070.0012640.000632
M6-6.917206247028772.084673-3.31810.0017550.000878
M7-8.930451416049762.093163-4.26659.5e-054.8e-05
M8-7.100017880191152.148319-3.30490.0018240.000912
M9-11.50492212931682.081968-5.5261e-061e-06
M10-3.250133282539282.088423-1.55630.1263550.063177
M110.7890803237801022.0708370.3810.7048870.352444

\begin{tabular}{lllllllll}
\hline
Multiple Linear Regression - Ordinary Least Squares \tabularnewline
Variable & Parameter & S.D. & T-STATH0: parameter = 0 & 2-tail p-value & 1-tail p-value \tabularnewline
(Intercept) & 65.3855849994479 & 4.329953 & 15.1008 & 0 & 0 \tabularnewline
Investeringsgoederen & 0.391844967146594 & 0.032659 & 11.9981 & 0 & 0 \tabularnewline
M1 & -3.13645561373052 & 2.346995 & -1.3364 & 0.187862 & 0.093931 \tabularnewline
M2 & -16.4161083706153 & 2.243134 & -7.3184 & 0 & 0 \tabularnewline
M3 & -6.67855945910728 & 2.115353 & -3.1572 & 0.002781 & 0.001391 \tabularnewline
M4 & -7.52875096085604 & 2.085633 & -3.6098 & 0.000742 & 0.000371 \tabularnewline
M5 & -7.14899964574348 & 2.083819 & -3.4307 & 0.001264 & 0.000632 \tabularnewline
M6 & -6.91720624702877 & 2.084673 & -3.3181 & 0.001755 & 0.000878 \tabularnewline
M7 & -8.93045141604976 & 2.093163 & -4.2665 & 9.5e-05 & 4.8e-05 \tabularnewline
M8 & -7.10001788019115 & 2.148319 & -3.3049 & 0.001824 & 0.000912 \tabularnewline
M9 & -11.5049221293168 & 2.081968 & -5.526 & 1e-06 & 1e-06 \tabularnewline
M10 & -3.25013328253928 & 2.088423 & -1.5563 & 0.126355 & 0.063177 \tabularnewline
M11 & 0.789080323780102 & 2.070837 & 0.381 & 0.704887 & 0.352444 \tabularnewline
\hline
\end{tabular}
%Source: https://freestatistics.org/blog/index.php?pk=58102&T=2

[TABLE]
[ROW][C]Multiple Linear Regression - Ordinary Least Squares[/C][/ROW]
[ROW][C]Variable[/C][C]Parameter[/C][C]S.D.[/C][C]T-STATH0: parameter = 0[/C][C]2-tail p-value[/C][C]1-tail p-value[/C][/ROW]
[ROW][C](Intercept)[/C][C]65.3855849994479[/C][C]4.329953[/C][C]15.1008[/C][C]0[/C][C]0[/C][/ROW]
[ROW][C]Investeringsgoederen[/C][C]0.391844967146594[/C][C]0.032659[/C][C]11.9981[/C][C]0[/C][C]0[/C][/ROW]
[ROW][C]M1[/C][C]-3.13645561373052[/C][C]2.346995[/C][C]-1.3364[/C][C]0.187862[/C][C]0.093931[/C][/ROW]
[ROW][C]M2[/C][C]-16.4161083706153[/C][C]2.243134[/C][C]-7.3184[/C][C]0[/C][C]0[/C][/ROW]
[ROW][C]M3[/C][C]-6.67855945910728[/C][C]2.115353[/C][C]-3.1572[/C][C]0.002781[/C][C]0.001391[/C][/ROW]
[ROW][C]M4[/C][C]-7.52875096085604[/C][C]2.085633[/C][C]-3.6098[/C][C]0.000742[/C][C]0.000371[/C][/ROW]
[ROW][C]M5[/C][C]-7.14899964574348[/C][C]2.083819[/C][C]-3.4307[/C][C]0.001264[/C][C]0.000632[/C][/ROW]
[ROW][C]M6[/C][C]-6.91720624702877[/C][C]2.084673[/C][C]-3.3181[/C][C]0.001755[/C][C]0.000878[/C][/ROW]
[ROW][C]M7[/C][C]-8.93045141604976[/C][C]2.093163[/C][C]-4.2665[/C][C]9.5e-05[/C][C]4.8e-05[/C][/ROW]
[ROW][C]M8[/C][C]-7.10001788019115[/C][C]2.148319[/C][C]-3.3049[/C][C]0.001824[/C][C]0.000912[/C][/ROW]
[ROW][C]M9[/C][C]-11.5049221293168[/C][C]2.081968[/C][C]-5.526[/C][C]1e-06[/C][C]1e-06[/C][/ROW]
[ROW][C]M10[/C][C]-3.25013328253928[/C][C]2.088423[/C][C]-1.5563[/C][C]0.126355[/C][C]0.063177[/C][/ROW]
[ROW][C]M11[/C][C]0.789080323780102[/C][C]2.070837[/C][C]0.381[/C][C]0.704887[/C][C]0.352444[/C][/ROW]
[/TABLE]
Source: https://freestatistics.org/blog/index.php?pk=58102&T=2

Globally Unique Identifier (entire table): ba.freestatistics.org/blog/index.php?pk=58102&T=2

As an alternative you can also use a QR Code:  

The GUIDs for individual cells are displayed in the table below:

Multiple Linear Regression - Ordinary Least Squares
VariableParameterS.D.T-STATH0: parameter = 02-tail p-value1-tail p-value
(Intercept)65.38558499944794.32995315.100800
Investeringsgoederen0.3918449671465940.03265911.998100
M1-3.136455613730522.346995-1.33640.1878620.093931
M2-16.41610837061532.243134-7.318400
M3-6.678559459107282.115353-3.15720.0027810.001391
M4-7.528750960856042.085633-3.60980.0007420.000371
M5-7.148999645743482.083819-3.43070.0012640.000632
M6-6.917206247028772.084673-3.31810.0017550.000878
M7-8.930451416049762.093163-4.26659.5e-054.8e-05
M8-7.100017880191152.148319-3.30490.0018240.000912
M9-11.50492212931682.081968-5.5261e-061e-06
M10-3.250133282539282.088423-1.55630.1263550.063177
M110.7890803237801022.0708370.3810.7048870.352444


Multiple Linear Regression - Regression Statistics
Multiple R0.95286188776125
R-squared0.907945777147933
Adjusted R-squared0.884442571313363
F-TEST (value)38.6307205722743
F-TEST (DF numerator)12
F-TEST (DF denominator)47
p-value0
Multiple Linear Regression - Residual Statistics
Residual Standard Deviation3.27208786320357
Sum Squared Residuals503.208272272634

\begin{tabular}{lllllllll}
\hline
Multiple Linear Regression - Regression Statistics \tabularnewline
Multiple R & 0.95286188776125 \tabularnewline
R-squared & 0.907945777147933 \tabularnewline
Adjusted R-squared & 0.884442571313363 \tabularnewline
F-TEST (value) & 38.6307205722743 \tabularnewline
F-TEST (DF numerator) & 12 \tabularnewline
F-TEST (DF denominator) & 47 \tabularnewline
p-value & 0 \tabularnewline
Multiple Linear Regression - Residual Statistics \tabularnewline
Residual Standard Deviation & 3.27208786320357 \tabularnewline
Sum Squared Residuals & 503.208272272634 \tabularnewline
\hline
\end{tabular}
%Source: https://freestatistics.org/blog/index.php?pk=58102&T=3

[TABLE]
[ROW][C]Multiple Linear Regression - Regression Statistics[/C][/ROW]
[ROW][C]Multiple R[/C][C]0.95286188776125[/C][/ROW]
[ROW][C]R-squared[/C][C]0.907945777147933[/C][/ROW]
[ROW][C]Adjusted R-squared[/C][C]0.884442571313363[/C][/ROW]
[ROW][C]F-TEST (value)[/C][C]38.6307205722743[/C][/ROW]
[ROW][C]F-TEST (DF numerator)[/C][C]12[/C][/ROW]
[ROW][C]F-TEST (DF denominator)[/C][C]47[/C][/ROW]
[ROW][C]p-value[/C][C]0[/C][/ROW]
[ROW][C]Multiple Linear Regression - Residual Statistics[/C][/ROW]
[ROW][C]Residual Standard Deviation[/C][C]3.27208786320357[/C][/ROW]
[ROW][C]Sum Squared Residuals[/C][C]503.208272272634[/C][/ROW]
[/TABLE]
Source: https://freestatistics.org/blog/index.php?pk=58102&T=3

Globally Unique Identifier (entire table): ba.freestatistics.org/blog/index.php?pk=58102&T=3

As an alternative you can also use a QR Code:  

The GUIDs for individual cells are displayed in the table below:

Multiple Linear Regression - Regression Statistics
Multiple R0.95286188776125
R-squared0.907945777147933
Adjusted R-squared0.884442571313363
F-TEST (value)38.6307205722743
F-TEST (DF numerator)12
F-TEST (DF denominator)47
p-value0
Multiple Linear Regression - Residual Statistics
Residual Standard Deviation3.27208786320357
Sum Squared Residuals503.208272272634


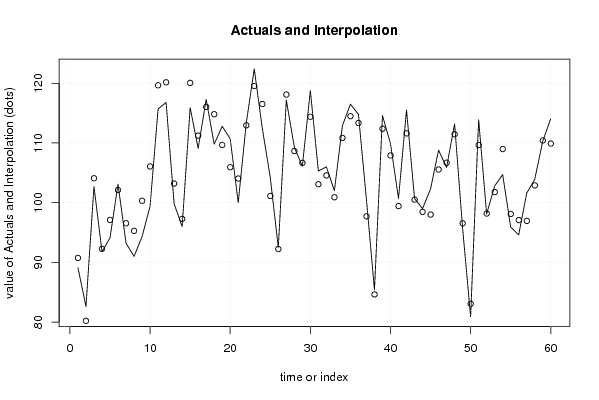
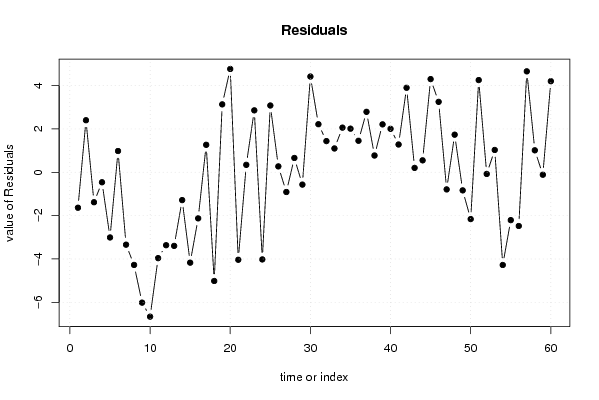
Multiple Linear Regression - Actuals, Interpolation, and Residuals
Time or IndexActualsInterpolationForecastResidualsPrediction Error
189.190.7362584972752-1.63625849727518
282.680.19952051041632.40047948958369
3102.7104.082672735916-1.3826727359163
491.892.260822154063-0.460822154062903
594.197.1076060946467-3.00760609464666
6103.1102.1199080925500.980091907450189
793.296.5408737224948-3.3408737224948
89195.2757320178953-4.27573201789533
994.3100.314291477003-6.01429147700263
1099.4106.061272534042-6.66127253404189
11115.7119.661503338738-3.96150333873819
12116.8120.165511406542-3.36551140654184
1399.8103.196928452537-3.39692845253655
149697.2839610780078-1.28396107800777
15115.9120.069947395497-4.16994739549732
16109.1111.226118563958-2.12611856395806
17117.3116.0337180078271.26628199217286
18109.8114.815685028099-5.01568502809945
19112.8109.6676801219063.13231987809430
20110.7105.9339151242834.76608487571733
21100104.036818664895-4.03681866489526
22113.3112.9577439558220.342256044178048
23122.4119.5439498485942.85605015140581
24112.5116.521353212079-4.02135321207852
25104.2101.1201501266603.0798498733404
2692.592.22916100181670.270838998183285
27117.2118.110722559764-0.910722559764356
28109.3108.6399417807910.66005821920946
29106.1106.668623293024-0.568623293023542
30118.8114.3846555642384.41534443576181
31105.3103.0846846738432.21531532615708
32106104.5624577392701.4375422607304
33102100.9020589277231.09794107227750
34112.9110.8417811332302.05821886676966
35116.5114.4891497724032.01085022759686
36114.8113.3474089781911.45259102180889
37100.597.71109891248422.78890108751577
3885.484.62736863917280.772631360827213
39114.6112.3897860394242.21021396057590
40109.9107.8954363432122.00456365678799
41100.799.41949140081161.28050859918845
42115.5111.6025562974973.89744370250263
43100.7100.4985078906750.201492109324601
449998.44967625178270.550323748217264
45102.398.00240617083774.29759382916229
46108.8105.5518740767513.24812592324867
47105.9106.691434926186-0.791434926185919
48113.2111.4665531358871.73344686411255
4995.796.5355640110444-0.835564011044446
5080.983.0599887705864-2.15998877058641
51113.9109.6468712693984.25312873060207
5298.198.1776811579765-0.0776811579764897
53102.8101.7705612036911.02943879630888
54104.7108.977195017615-4.27719501761519
5595.998.1082535910812-2.20825359108117
5694.697.0782188667697-2.47821886676966
57101.696.94442475954194.65557524045809
58103.9102.8873283001541.01267169984552
59110.3110.413962114079-0.113962114078570
60114.1109.8991732673014.20082673269892

\begin{tabular}{lllllllll}
\hline
Multiple Linear Regression - Actuals, Interpolation, and Residuals \tabularnewline
Time or Index & Actuals & InterpolationForecast & ResidualsPrediction Error \tabularnewline
1 & 89.1 & 90.7362584972752 & -1.63625849727518 \tabularnewline
2 & 82.6 & 80.1995205104163 & 2.40047948958369 \tabularnewline
3 & 102.7 & 104.082672735916 & -1.3826727359163 \tabularnewline
4 & 91.8 & 92.260822154063 & -0.460822154062903 \tabularnewline
5 & 94.1 & 97.1076060946467 & -3.00760609464666 \tabularnewline
6 & 103.1 & 102.119908092550 & 0.980091907450189 \tabularnewline
7 & 93.2 & 96.5408737224948 & -3.3408737224948 \tabularnewline
8 & 91 & 95.2757320178953 & -4.27573201789533 \tabularnewline
9 & 94.3 & 100.314291477003 & -6.01429147700263 \tabularnewline
10 & 99.4 & 106.061272534042 & -6.66127253404189 \tabularnewline
11 & 115.7 & 119.661503338738 & -3.96150333873819 \tabularnewline
12 & 116.8 & 120.165511406542 & -3.36551140654184 \tabularnewline
13 & 99.8 & 103.196928452537 & -3.39692845253655 \tabularnewline
14 & 96 & 97.2839610780078 & -1.28396107800777 \tabularnewline
15 & 115.9 & 120.069947395497 & -4.16994739549732 \tabularnewline
16 & 109.1 & 111.226118563958 & -2.12611856395806 \tabularnewline
17 & 117.3 & 116.033718007827 & 1.26628199217286 \tabularnewline
18 & 109.8 & 114.815685028099 & -5.01568502809945 \tabularnewline
19 & 112.8 & 109.667680121906 & 3.13231987809430 \tabularnewline
20 & 110.7 & 105.933915124283 & 4.76608487571733 \tabularnewline
21 & 100 & 104.036818664895 & -4.03681866489526 \tabularnewline
22 & 113.3 & 112.957743955822 & 0.342256044178048 \tabularnewline
23 & 122.4 & 119.543949848594 & 2.85605015140581 \tabularnewline
24 & 112.5 & 116.521353212079 & -4.02135321207852 \tabularnewline
25 & 104.2 & 101.120150126660 & 3.0798498733404 \tabularnewline
26 & 92.5 & 92.2291610018167 & 0.270838998183285 \tabularnewline
27 & 117.2 & 118.110722559764 & -0.910722559764356 \tabularnewline
28 & 109.3 & 108.639941780791 & 0.66005821920946 \tabularnewline
29 & 106.1 & 106.668623293024 & -0.568623293023542 \tabularnewline
30 & 118.8 & 114.384655564238 & 4.41534443576181 \tabularnewline
31 & 105.3 & 103.084684673843 & 2.21531532615708 \tabularnewline
32 & 106 & 104.562457739270 & 1.4375422607304 \tabularnewline
33 & 102 & 100.902058927723 & 1.09794107227750 \tabularnewline
34 & 112.9 & 110.841781133230 & 2.05821886676966 \tabularnewline
35 & 116.5 & 114.489149772403 & 2.01085022759686 \tabularnewline
36 & 114.8 & 113.347408978191 & 1.45259102180889 \tabularnewline
37 & 100.5 & 97.7110989124842 & 2.78890108751577 \tabularnewline
38 & 85.4 & 84.6273686391728 & 0.772631360827213 \tabularnewline
39 & 114.6 & 112.389786039424 & 2.21021396057590 \tabularnewline
40 & 109.9 & 107.895436343212 & 2.00456365678799 \tabularnewline
41 & 100.7 & 99.4194914008116 & 1.28050859918845 \tabularnewline
42 & 115.5 & 111.602556297497 & 3.89744370250263 \tabularnewline
43 & 100.7 & 100.498507890675 & 0.201492109324601 \tabularnewline
44 & 99 & 98.4496762517827 & 0.550323748217264 \tabularnewline
45 & 102.3 & 98.0024061708377 & 4.29759382916229 \tabularnewline
46 & 108.8 & 105.551874076751 & 3.24812592324867 \tabularnewline
47 & 105.9 & 106.691434926186 & -0.791434926185919 \tabularnewline
48 & 113.2 & 111.466553135887 & 1.73344686411255 \tabularnewline
49 & 95.7 & 96.5355640110444 & -0.835564011044446 \tabularnewline
50 & 80.9 & 83.0599887705864 & -2.15998877058641 \tabularnewline
51 & 113.9 & 109.646871269398 & 4.25312873060207 \tabularnewline
52 & 98.1 & 98.1776811579765 & -0.0776811579764897 \tabularnewline
53 & 102.8 & 101.770561203691 & 1.02943879630888 \tabularnewline
54 & 104.7 & 108.977195017615 & -4.27719501761519 \tabularnewline
55 & 95.9 & 98.1082535910812 & -2.20825359108117 \tabularnewline
56 & 94.6 & 97.0782188667697 & -2.47821886676966 \tabularnewline
57 & 101.6 & 96.9444247595419 & 4.65557524045809 \tabularnewline
58 & 103.9 & 102.887328300154 & 1.01267169984552 \tabularnewline
59 & 110.3 & 110.413962114079 & -0.113962114078570 \tabularnewline
60 & 114.1 & 109.899173267301 & 4.20082673269892 \tabularnewline
\hline
\end{tabular}
%Source: https://freestatistics.org/blog/index.php?pk=58102&T=4

[TABLE]
[ROW][C]Multiple Linear Regression - Actuals, Interpolation, and Residuals[/C][/ROW]
[ROW][C]Time or Index[/C][C]Actuals[/C][C]InterpolationForecast[/C][C]ResidualsPrediction Error[/C][/ROW]
[ROW][C]1[/C][C]89.1[/C][C]90.7362584972752[/C][C]-1.63625849727518[/C][/ROW]
[ROW][C]2[/C][C]82.6[/C][C]80.1995205104163[/C][C]2.40047948958369[/C][/ROW]
[ROW][C]3[/C][C]102.7[/C][C]104.082672735916[/C][C]-1.3826727359163[/C][/ROW]
[ROW][C]4[/C][C]91.8[/C][C]92.260822154063[/C][C]-0.460822154062903[/C][/ROW]
[ROW][C]5[/C][C]94.1[/C][C]97.1076060946467[/C][C]-3.00760609464666[/C][/ROW]
[ROW][C]6[/C][C]103.1[/C][C]102.119908092550[/C][C]0.980091907450189[/C][/ROW]
[ROW][C]7[/C][C]93.2[/C][C]96.5408737224948[/C][C]-3.3408737224948[/C][/ROW]
[ROW][C]8[/C][C]91[/C][C]95.2757320178953[/C][C]-4.27573201789533[/C][/ROW]
[ROW][C]9[/C][C]94.3[/C][C]100.314291477003[/C][C]-6.01429147700263[/C][/ROW]
[ROW][C]10[/C][C]99.4[/C][C]106.061272534042[/C][C]-6.66127253404189[/C][/ROW]
[ROW][C]11[/C][C]115.7[/C][C]119.661503338738[/C][C]-3.96150333873819[/C][/ROW]
[ROW][C]12[/C][C]116.8[/C][C]120.165511406542[/C][C]-3.36551140654184[/C][/ROW]
[ROW][C]13[/C][C]99.8[/C][C]103.196928452537[/C][C]-3.39692845253655[/C][/ROW]
[ROW][C]14[/C][C]96[/C][C]97.2839610780078[/C][C]-1.28396107800777[/C][/ROW]
[ROW][C]15[/C][C]115.9[/C][C]120.069947395497[/C][C]-4.16994739549732[/C][/ROW]
[ROW][C]16[/C][C]109.1[/C][C]111.226118563958[/C][C]-2.12611856395806[/C][/ROW]
[ROW][C]17[/C][C]117.3[/C][C]116.033718007827[/C][C]1.26628199217286[/C][/ROW]
[ROW][C]18[/C][C]109.8[/C][C]114.815685028099[/C][C]-5.01568502809945[/C][/ROW]
[ROW][C]19[/C][C]112.8[/C][C]109.667680121906[/C][C]3.13231987809430[/C][/ROW]
[ROW][C]20[/C][C]110.7[/C][C]105.933915124283[/C][C]4.76608487571733[/C][/ROW]
[ROW][C]21[/C][C]100[/C][C]104.036818664895[/C][C]-4.03681866489526[/C][/ROW]
[ROW][C]22[/C][C]113.3[/C][C]112.957743955822[/C][C]0.342256044178048[/C][/ROW]
[ROW][C]23[/C][C]122.4[/C][C]119.543949848594[/C][C]2.85605015140581[/C][/ROW]
[ROW][C]24[/C][C]112.5[/C][C]116.521353212079[/C][C]-4.02135321207852[/C][/ROW]
[ROW][C]25[/C][C]104.2[/C][C]101.120150126660[/C][C]3.0798498733404[/C][/ROW]
[ROW][C]26[/C][C]92.5[/C][C]92.2291610018167[/C][C]0.270838998183285[/C][/ROW]
[ROW][C]27[/C][C]117.2[/C][C]118.110722559764[/C][C]-0.910722559764356[/C][/ROW]
[ROW][C]28[/C][C]109.3[/C][C]108.639941780791[/C][C]0.66005821920946[/C][/ROW]
[ROW][C]29[/C][C]106.1[/C][C]106.668623293024[/C][C]-0.568623293023542[/C][/ROW]
[ROW][C]30[/C][C]118.8[/C][C]114.384655564238[/C][C]4.41534443576181[/C][/ROW]
[ROW][C]31[/C][C]105.3[/C][C]103.084684673843[/C][C]2.21531532615708[/C][/ROW]
[ROW][C]32[/C][C]106[/C][C]104.562457739270[/C][C]1.4375422607304[/C][/ROW]
[ROW][C]33[/C][C]102[/C][C]100.902058927723[/C][C]1.09794107227750[/C][/ROW]
[ROW][C]34[/C][C]112.9[/C][C]110.841781133230[/C][C]2.05821886676966[/C][/ROW]
[ROW][C]35[/C][C]116.5[/C][C]114.489149772403[/C][C]2.01085022759686[/C][/ROW]
[ROW][C]36[/C][C]114.8[/C][C]113.347408978191[/C][C]1.45259102180889[/C][/ROW]
[ROW][C]37[/C][C]100.5[/C][C]97.7110989124842[/C][C]2.78890108751577[/C][/ROW]
[ROW][C]38[/C][C]85.4[/C][C]84.6273686391728[/C][C]0.772631360827213[/C][/ROW]
[ROW][C]39[/C][C]114.6[/C][C]112.389786039424[/C][C]2.21021396057590[/C][/ROW]
[ROW][C]40[/C][C]109.9[/C][C]107.895436343212[/C][C]2.00456365678799[/C][/ROW]
[ROW][C]41[/C][C]100.7[/C][C]99.4194914008116[/C][C]1.28050859918845[/C][/ROW]
[ROW][C]42[/C][C]115.5[/C][C]111.602556297497[/C][C]3.89744370250263[/C][/ROW]
[ROW][C]43[/C][C]100.7[/C][C]100.498507890675[/C][C]0.201492109324601[/C][/ROW]
[ROW][C]44[/C][C]99[/C][C]98.4496762517827[/C][C]0.550323748217264[/C][/ROW]
[ROW][C]45[/C][C]102.3[/C][C]98.0024061708377[/C][C]4.29759382916229[/C][/ROW]
[ROW][C]46[/C][C]108.8[/C][C]105.551874076751[/C][C]3.24812592324867[/C][/ROW]
[ROW][C]47[/C][C]105.9[/C][C]106.691434926186[/C][C]-0.791434926185919[/C][/ROW]
[ROW][C]48[/C][C]113.2[/C][C]111.466553135887[/C][C]1.73344686411255[/C][/ROW]
[ROW][C]49[/C][C]95.7[/C][C]96.5355640110444[/C][C]-0.835564011044446[/C][/ROW]
[ROW][C]50[/C][C]80.9[/C][C]83.0599887705864[/C][C]-2.15998877058641[/C][/ROW]
[ROW][C]51[/C][C]113.9[/C][C]109.646871269398[/C][C]4.25312873060207[/C][/ROW]
[ROW][C]52[/C][C]98.1[/C][C]98.1776811579765[/C][C]-0.0776811579764897[/C][/ROW]
[ROW][C]53[/C][C]102.8[/C][C]101.770561203691[/C][C]1.02943879630888[/C][/ROW]
[ROW][C]54[/C][C]104.7[/C][C]108.977195017615[/C][C]-4.27719501761519[/C][/ROW]
[ROW][C]55[/C][C]95.9[/C][C]98.1082535910812[/C][C]-2.20825359108117[/C][/ROW]
[ROW][C]56[/C][C]94.6[/C][C]97.0782188667697[/C][C]-2.47821886676966[/C][/ROW]
[ROW][C]57[/C][C]101.6[/C][C]96.9444247595419[/C][C]4.65557524045809[/C][/ROW]
[ROW][C]58[/C][C]103.9[/C][C]102.887328300154[/C][C]1.01267169984552[/C][/ROW]
[ROW][C]59[/C][C]110.3[/C][C]110.413962114079[/C][C]-0.113962114078570[/C][/ROW]
[ROW][C]60[/C][C]114.1[/C][C]109.899173267301[/C][C]4.20082673269892[/C][/ROW]
[/TABLE]
Source: https://freestatistics.org/blog/index.php?pk=58102&T=4

Globally Unique Identifier (entire table): ba.freestatistics.org/blog/index.php?pk=58102&T=4

As an alternative you can also use a QR Code:  

The GUIDs for individual cells are displayed in the table below:

Multiple Linear Regression - Actuals, Interpolation, and Residuals
Time or IndexActualsInterpolationForecastResidualsPrediction Error
189.190.7362584972752-1.63625849727518
282.680.19952051041632.40047948958369
3102.7104.082672735916-1.3826727359163
491.892.260822154063-0.460822154062903
594.197.1076060946467-3.00760609464666
6103.1102.1199080925500.980091907450189
793.296.5408737224948-3.3408737224948
89195.2757320178953-4.27573201789533
994.3100.314291477003-6.01429147700263
1099.4106.061272534042-6.66127253404189
11115.7119.661503338738-3.96150333873819
12116.8120.165511406542-3.36551140654184
1399.8103.196928452537-3.39692845253655
149697.2839610780078-1.28396107800777
15115.9120.069947395497-4.16994739549732
16109.1111.226118563958-2.12611856395806
17117.3116.0337180078271.26628199217286
18109.8114.815685028099-5.01568502809945
19112.8109.6676801219063.13231987809430
20110.7105.9339151242834.76608487571733
21100104.036818664895-4.03681866489526
22113.3112.9577439558220.342256044178048
23122.4119.5439498485942.85605015140581
24112.5116.521353212079-4.02135321207852
25104.2101.1201501266603.0798498733404
2692.592.22916100181670.270838998183285
27117.2118.110722559764-0.910722559764356
28109.3108.6399417807910.66005821920946
29106.1106.668623293024-0.568623293023542
30118.8114.3846555642384.41534443576181
31105.3103.0846846738432.21531532615708
32106104.5624577392701.4375422607304
33102100.9020589277231.09794107227750
34112.9110.8417811332302.05821886676966
35116.5114.4891497724032.01085022759686
36114.8113.3474089781911.45259102180889
37100.597.71109891248422.78890108751577
3885.484.62736863917280.772631360827213
39114.6112.3897860394242.21021396057590
40109.9107.8954363432122.00456365678799
41100.799.41949140081161.28050859918845
42115.5111.6025562974973.89744370250263
43100.7100.4985078906750.201492109324601
449998.44967625178270.550323748217264
45102.398.00240617083774.29759382916229
46108.8105.5518740767513.24812592324867
47105.9106.691434926186-0.791434926185919
48113.2111.4665531358871.73344686411255
4995.796.5355640110444-0.835564011044446
5080.983.0599887705864-2.15998877058641
51113.9109.6468712693984.25312873060207
5298.198.1776811579765-0.0776811579764897
53102.8101.7705612036911.02943879630888
54104.7108.977195017615-4.27719501761519
5595.998.1082535910812-2.20825359108117
5694.697.0782188667697-2.47821886676966
57101.696.94442475954194.65557524045809
58103.9102.8873283001541.01267169984552
59110.3110.413962114079-0.113962114078570
60114.1109.8991732673014.20082673269892


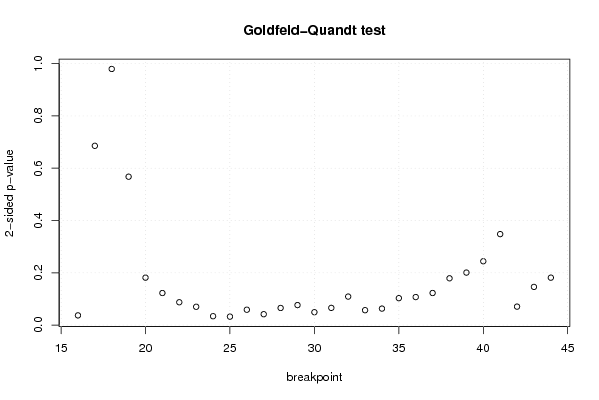
Goldfeld-Quandt test for Heteroskedasticity
p-valuesAlternative Hypothesis
breakpoint indexgreater2-sidedless
160.01860780239874420.03721560479748830.981392197601256
170.342843184559280.685686369118560.65715681544072
180.4898137889114160.9796275778228320.510186211088584
190.7161871852121720.5676256295756560.283812814787828
200.9092253487497850.1815493025004300.0907746512502151
210.9386767666124070.1226464667751860.0613232333875929
220.9562604001562720.08747919968745520.0437395998437276
230.964940276500240.07011944699951830.0350597234997592
240.9829635050118130.03407298997637410.0170364949881870
250.983806672754380.03238665449123840.0161933272456192
260.9705809282273850.05883814354523040.0294190717726152
270.9791228228251590.04175435434968240.0208771771748412
280.9671669352764920.06566612944701580.0328330647235079
290.9617036950239620.0765926099520750.0382963049760375
300.9753147818688630.04937043626227320.0246852181311366
310.9670114972374350.06597700552513030.0329885027625652
320.9454256297116530.1091487405766940.0545743702883472
330.9714417684976140.05711646300477270.0285582315023863
340.968401769555960.06319646088807870.0315982304440394
350.9484713571420220.1030572857159550.0515286428579775
360.9463570995029440.1072858009941110.0536429004970555
370.9385859142128680.1228281715742640.061414085787132
380.9104667331359840.1790665337280320.0895332668640159
390.8995598946027050.2008802107945900.100440105397295
400.8778816928038240.2442366143923520.122118307196176
410.825974765409930.3480504691801390.174025234590070
420.9646253590828960.07074928183420860.0353746409171043
430.9269581697007550.1460836605984900.0730418302992452
440.909271896817220.1814562063655610.0907281031827803

\begin{tabular}{lllllllll}
\hline
Goldfeld-Quandt test for Heteroskedasticity \tabularnewline
p-values & Alternative Hypothesis \tabularnewline
breakpoint index & greater & 2-sided & less \tabularnewline
16 & 0.0186078023987442 & 0.0372156047974883 & 0.981392197601256 \tabularnewline
17 & 0.34284318455928 & 0.68568636911856 & 0.65715681544072 \tabularnewline
18 & 0.489813788911416 & 0.979627577822832 & 0.510186211088584 \tabularnewline
19 & 0.716187185212172 & 0.567625629575656 & 0.283812814787828 \tabularnewline
20 & 0.909225348749785 & 0.181549302500430 & 0.0907746512502151 \tabularnewline
21 & 0.938676766612407 & 0.122646466775186 & 0.0613232333875929 \tabularnewline
22 & 0.956260400156272 & 0.0874791996874552 & 0.0437395998437276 \tabularnewline
23 & 0.96494027650024 & 0.0701194469995183 & 0.0350597234997592 \tabularnewline
24 & 0.982963505011813 & 0.0340729899763741 & 0.0170364949881870 \tabularnewline
25 & 0.98380667275438 & 0.0323866544912384 & 0.0161933272456192 \tabularnewline
26 & 0.970580928227385 & 0.0588381435452304 & 0.0294190717726152 \tabularnewline
27 & 0.979122822825159 & 0.0417543543496824 & 0.0208771771748412 \tabularnewline
28 & 0.967166935276492 & 0.0656661294470158 & 0.0328330647235079 \tabularnewline
29 & 0.961703695023962 & 0.076592609952075 & 0.0382963049760375 \tabularnewline
30 & 0.975314781868863 & 0.0493704362622732 & 0.0246852181311366 \tabularnewline
31 & 0.967011497237435 & 0.0659770055251303 & 0.0329885027625652 \tabularnewline
32 & 0.945425629711653 & 0.109148740576694 & 0.0545743702883472 \tabularnewline
33 & 0.971441768497614 & 0.0571164630047727 & 0.0285582315023863 \tabularnewline
34 & 0.96840176955596 & 0.0631964608880787 & 0.0315982304440394 \tabularnewline
35 & 0.948471357142022 & 0.103057285715955 & 0.0515286428579775 \tabularnewline
36 & 0.946357099502944 & 0.107285800994111 & 0.0536429004970555 \tabularnewline
37 & 0.938585914212868 & 0.122828171574264 & 0.061414085787132 \tabularnewline
38 & 0.910466733135984 & 0.179066533728032 & 0.0895332668640159 \tabularnewline
39 & 0.899559894602705 & 0.200880210794590 & 0.100440105397295 \tabularnewline
40 & 0.877881692803824 & 0.244236614392352 & 0.122118307196176 \tabularnewline
41 & 0.82597476540993 & 0.348050469180139 & 0.174025234590070 \tabularnewline
42 & 0.964625359082896 & 0.0707492818342086 & 0.0353746409171043 \tabularnewline
43 & 0.926958169700755 & 0.146083660598490 & 0.0730418302992452 \tabularnewline
44 & 0.90927189681722 & 0.181456206365561 & 0.0907281031827803 \tabularnewline
\hline
\end{tabular}
%Source: https://freestatistics.org/blog/index.php?pk=58102&T=5

[TABLE]
[ROW][C]Goldfeld-Quandt test for Heteroskedasticity[/C][/ROW]
[ROW][C]p-values[/C][C]Alternative Hypothesis[/C][/ROW]
[ROW][C]breakpoint index[/C][C]greater[/C][C]2-sided[/C][C]less[/C][/ROW]
[ROW][C]16[/C][C]0.0186078023987442[/C][C]0.0372156047974883[/C][C]0.981392197601256[/C][/ROW]
[ROW][C]17[/C][C]0.34284318455928[/C][C]0.68568636911856[/C][C]0.65715681544072[/C][/ROW]
[ROW][C]18[/C][C]0.489813788911416[/C][C]0.979627577822832[/C][C]0.510186211088584[/C][/ROW]
[ROW][C]19[/C][C]0.716187185212172[/C][C]0.567625629575656[/C][C]0.283812814787828[/C][/ROW]
[ROW][C]20[/C][C]0.909225348749785[/C][C]0.181549302500430[/C][C]0.0907746512502151[/C][/ROW]
[ROW][C]21[/C][C]0.938676766612407[/C][C]0.122646466775186[/C][C]0.0613232333875929[/C][/ROW]
[ROW][C]22[/C][C]0.956260400156272[/C][C]0.0874791996874552[/C][C]0.0437395998437276[/C][/ROW]
[ROW][C]23[/C][C]0.96494027650024[/C][C]0.0701194469995183[/C][C]0.0350597234997592[/C][/ROW]
[ROW][C]24[/C][C]0.982963505011813[/C][C]0.0340729899763741[/C][C]0.0170364949881870[/C][/ROW]
[ROW][C]25[/C][C]0.98380667275438[/C][C]0.0323866544912384[/C][C]0.0161933272456192[/C][/ROW]
[ROW][C]26[/C][C]0.970580928227385[/C][C]0.0588381435452304[/C][C]0.0294190717726152[/C][/ROW]
[ROW][C]27[/C][C]0.979122822825159[/C][C]0.0417543543496824[/C][C]0.0208771771748412[/C][/ROW]
[ROW][C]28[/C][C]0.967166935276492[/C][C]0.0656661294470158[/C][C]0.0328330647235079[/C][/ROW]
[ROW][C]29[/C][C]0.961703695023962[/C][C]0.076592609952075[/C][C]0.0382963049760375[/C][/ROW]
[ROW][C]30[/C][C]0.975314781868863[/C][C]0.0493704362622732[/C][C]0.0246852181311366[/C][/ROW]
[ROW][C]31[/C][C]0.967011497237435[/C][C]0.0659770055251303[/C][C]0.0329885027625652[/C][/ROW]
[ROW][C]32[/C][C]0.945425629711653[/C][C]0.109148740576694[/C][C]0.0545743702883472[/C][/ROW]
[ROW][C]33[/C][C]0.971441768497614[/C][C]0.0571164630047727[/C][C]0.0285582315023863[/C][/ROW]
[ROW][C]34[/C][C]0.96840176955596[/C][C]0.0631964608880787[/C][C]0.0315982304440394[/C][/ROW]
[ROW][C]35[/C][C]0.948471357142022[/C][C]0.103057285715955[/C][C]0.0515286428579775[/C][/ROW]
[ROW][C]36[/C][C]0.946357099502944[/C][C]0.107285800994111[/C][C]0.0536429004970555[/C][/ROW]
[ROW][C]37[/C][C]0.938585914212868[/C][C]0.122828171574264[/C][C]0.061414085787132[/C][/ROW]
[ROW][C]38[/C][C]0.910466733135984[/C][C]0.179066533728032[/C][C]0.0895332668640159[/C][/ROW]
[ROW][C]39[/C][C]0.899559894602705[/C][C]0.200880210794590[/C][C]0.100440105397295[/C][/ROW]
[ROW][C]40[/C][C]0.877881692803824[/C][C]0.244236614392352[/C][C]0.122118307196176[/C][/ROW]
[ROW][C]41[/C][C]0.82597476540993[/C][C]0.348050469180139[/C][C]0.174025234590070[/C][/ROW]
[ROW][C]42[/C][C]0.964625359082896[/C][C]0.0707492818342086[/C][C]0.0353746409171043[/C][/ROW]
[ROW][C]43[/C][C]0.926958169700755[/C][C]0.146083660598490[/C][C]0.0730418302992452[/C][/ROW]
[ROW][C]44[/C][C]0.90927189681722[/C][C]0.181456206365561[/C][C]0.0907281031827803[/C][/ROW]
[/TABLE]
Source: https://freestatistics.org/blog/index.php?pk=58102&T=5

Globally Unique Identifier (entire table): ba.freestatistics.org/blog/index.php?pk=58102&T=5

As an alternative you can also use a QR Code:  

The GUIDs for individual cells are displayed in the table below:

Goldfeld-Quandt test for Heteroskedasticity
p-valuesAlternative Hypothesis
breakpoint indexgreater2-sidedless
160.01860780239874420.03721560479748830.981392197601256
170.342843184559280.685686369118560.65715681544072
180.4898137889114160.9796275778228320.510186211088584
190.7161871852121720.5676256295756560.283812814787828
200.9092253487497850.1815493025004300.0907746512502151
210.9386767666124070.1226464667751860.0613232333875929
220.9562604001562720.08747919968745520.0437395998437276
230.964940276500240.07011944699951830.0350597234997592
240.9829635050118130.03407298997637410.0170364949881870
250.983806672754380.03238665449123840.0161933272456192
260.9705809282273850.05883814354523040.0294190717726152
270.9791228228251590.04175435434968240.0208771771748412
280.9671669352764920.06566612944701580.0328330647235079
290.9617036950239620.0765926099520750.0382963049760375
300.9753147818688630.04937043626227320.0246852181311366
310.9670114972374350.06597700552513030.0329885027625652
320.9454256297116530.1091487405766940.0545743702883472
330.9714417684976140.05711646300477270.0285582315023863
340.968401769555960.06319646088807870.0315982304440394
350.9484713571420220.1030572857159550.0515286428579775
360.9463570995029440.1072858009941110.0536429004970555
370.9385859142128680.1228281715742640.061414085787132
380.9104667331359840.1790665337280320.0895332668640159
390.8995598946027050.2008802107945900.100440105397295
400.8778816928038240.2442366143923520.122118307196176
410.825974765409930.3480504691801390.174025234590070
420.9646253590828960.07074928183420860.0353746409171043
430.9269581697007550.1460836605984900.0730418302992452
440.909271896817220.1814562063655610.0907281031827803


Meta Analysis of Goldfeld-Quandt test for Heteroskedasticity
Description# significant tests% significant testsOK/NOK
1% type I error level00OK
5% type I error level50.172413793103448NOK
10% type I error level140.482758620689655NOK

\begin{tabular}{lllllllll}
\hline
Meta Analysis of Goldfeld-Quandt test for Heteroskedasticity \tabularnewline
Description & # significant tests & % significant tests & OK/NOK \tabularnewline
1% type I error level & 0 & 0 & OK \tabularnewline
5% type I error level & 5 & 0.172413793103448 & NOK \tabularnewline
10% type I error level & 14 & 0.482758620689655 & NOK \tabularnewline
\hline
\end{tabular}
%Source: https://freestatistics.org/blog/index.php?pk=58102&T=6

[TABLE]
[ROW][C]Meta Analysis of Goldfeld-Quandt test for Heteroskedasticity[/C][/ROW]
[ROW][C]Description[/C][C]# significant tests[/C][C]% significant tests[/C][C]OK/NOK[/C][/ROW]
[ROW][C]1% type I error level[/C][C]0[/C][C]0[/C][C]OK[/C][/ROW]
[ROW][C]5% type I error level[/C][C]5[/C][C]0.172413793103448[/C][C]NOK[/C][/ROW]
[ROW][C]10% type I error level[/C][C]14[/C][C]0.482758620689655[/C][C]NOK[/C][/ROW]
[/TABLE]
Source: https://freestatistics.org/blog/index.php?pk=58102&T=6

Globally Unique Identifier (entire table): ba.freestatistics.org/blog/index.php?pk=58102&T=6

As an alternative you can also use a QR Code:  

The GUIDs for individual cells are displayed in the table below:

Meta Analysis of Goldfeld-Quandt test for Heteroskedasticity
Description# significant tests% significant testsOK/NOK
1% type I error level00OK
5% type I error level50.172413793103448NOK
10% type I error level140.482758620689655NOK


Parameters (Session):
par1 = 1 ; par2 = Include Monthly Dummies ; par3 = No Linear Trend ;
Parameters (R input):
par1 = 1 ; par2 = Include Monthly Dummies ; par3 = No Linear Trend ;
R code (references can be found in the software module):
library(lattice)
library(lmtest)
n25 <- 25 #minimum number of obs. for Goldfeld-Quandt test
par1 <- as.numeric(par1)
x <- t(y)
k <- length(x[1,])
n <- length(x[,1])
x1 <- cbind(x[,par1], x[,1:k!=par1])
mycolnames <- c(colnames(x)[par1], colnames(x)[1:k!=par1])
colnames(x1) <- mycolnames #colnames(x)[par1]
x <- x1
if (par3 == 'First Differences'){
x2 <- array(0, dim=c(n-1,k), dimnames=list(1:(n-1), paste('(1-B)',colnames(x),sep='')))
for (i in 1:n-1) {
for (j in 1:k) {
x2[i,j] <- x[i+1,j] - x[i,j]
}
}
x <- x2
}
if (par2 == 'Include Monthly Dummies'){
x2 <- array(0, dim=c(n,11), dimnames=list(1:n, paste('M', seq(1:11), sep ='')))
for (i in 1:11){
x2[seq(i,n,12),i] <- 1
}
x <- cbind(x, x2)
}
if (par2 == 'Include Quarterly Dummies'){
x2 <- array(0, dim=c(n,3), dimnames=list(1:n, paste('Q', seq(1:3), sep ='')))
for (i in 1:3){
x2[seq(i,n,4),i] <- 1
}
x <- cbind(x, x2)
}
k <- length(x[1,])
if (par3 == 'Linear Trend'){
x <- cbind(x, c(1:n))
colnames(x)[k+1] <- 't'
}
x
k <- length(x[1,])
df <- as.data.frame(x)
(mylm <- lm(df))
(mysum <- summary(mylm))
if (n > n25) {
kp3 <- k + 3
nmkm3 <- n - k - 3
gqarr <- array(NA, dim=c(nmkm3-kp3+1,3))
numgqtests <- 0
numsignificant1 <- 0
numsignificant5 <- 0
numsignificant10 <- 0
for (mypoint in kp3:nmkm3) {
j <- 0
numgqtests <- numgqtests + 1
for (myalt in c('greater', 'two.sided', 'less')) {
j <- j + 1
gqarr[mypoint-kp3+1,j] <- gqtest(mylm, point=mypoint, alternative=myalt)$p.value
}
if (gqarr[mypoint-kp3+1,2] < 0.01) numsignificant1 <- numsignificant1 + 1
if (gqarr[mypoint-kp3+1,2] < 0.05) numsignificant5 <- numsignificant5 + 1
if (gqarr[mypoint-kp3+1,2] < 0.10) numsignificant10 <- numsignificant10 + 1
}
gqarr
}
bitmap(file='test0.png')
plot(x[,1], type='l', main='Actuals and Interpolation', ylab='value of Actuals and Interpolation (dots)', xlab='time or index')
points(x[,1]-mysum$resid)
grid()
dev.off()
bitmap(file='test1.png')
plot(mysum$resid, type='b', pch=19, main='Residuals', ylab='value of Residuals', xlab='time or index')
grid()
dev.off()
bitmap(file='test2.png')
hist(mysum$resid, main='Residual Histogram', xlab='values of Residuals')
grid()
dev.off()
bitmap(file='test3.png')
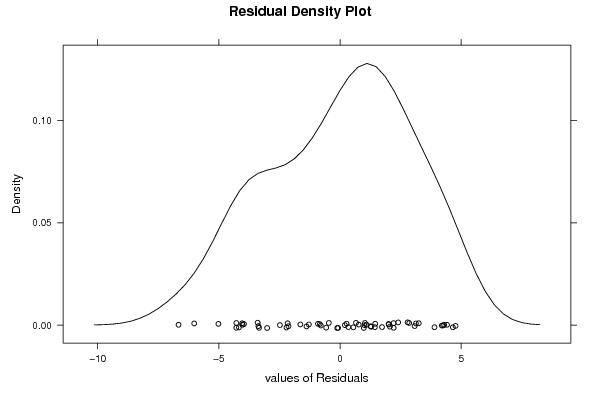
densityplot(~mysum$resid,col='black',main='Residual Density Plot', xlab='values of Residuals')
dev.off()
bitmap(file='test4.png')
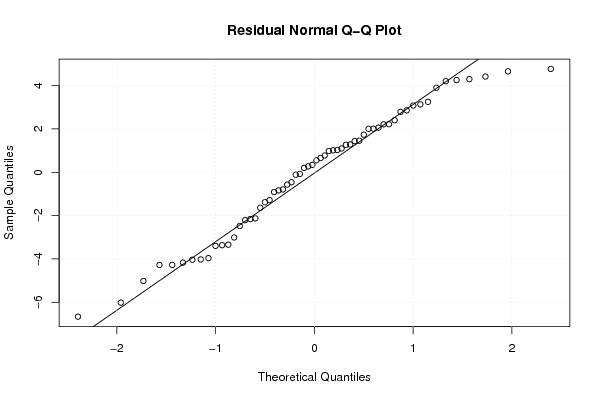
qqnorm(mysum$resid, main='Residual Normal Q-Q Plot')
qqline(mysum$resid)
grid()
dev.off()
(myerror <- as.ts(mysum$resid))
bitmap(file='test5.png')
dum <- cbind(lag(myerror,k=1),myerror)
dum
dum1 <- dum[2:length(myerror),]
dum1
z <- as.data.frame(dum1)
z
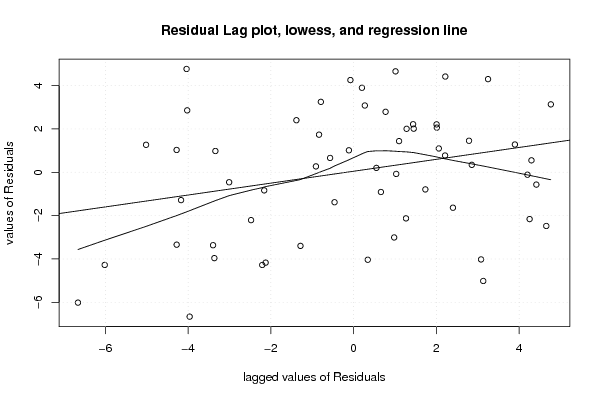
plot(z,main=paste('Residual Lag plot, lowess, and regression line'), ylab='values of Residuals', xlab='lagged values of Residuals')
lines(lowess(z))
abline(lm(z))
grid()
dev.off()
bitmap(file='test6.png')
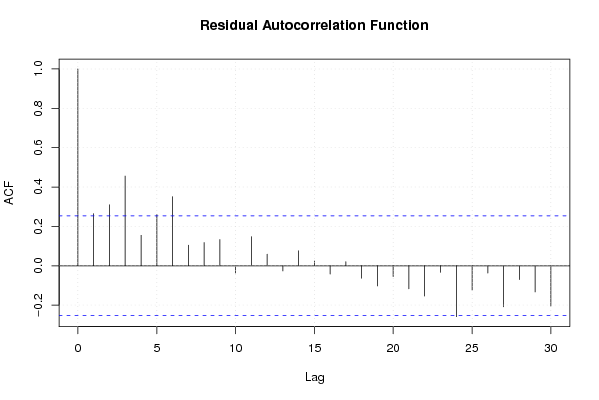
acf(mysum$resid, lag.max=length(mysum$resid)/2, main='Residual Autocorrelation Function')
grid()
dev.off()
bitmap(file='test7.png')
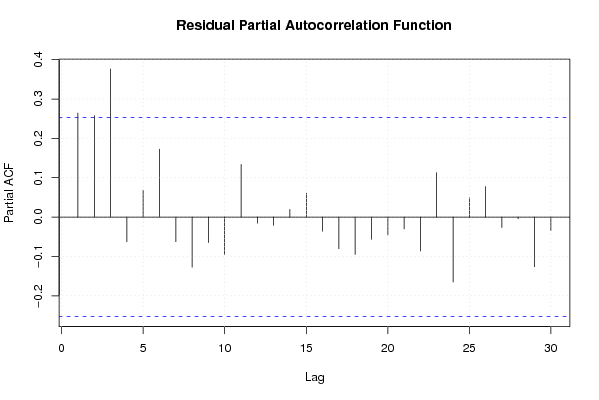
pacf(mysum$resid, lag.max=length(mysum$resid)/2, main='Residual Partial Autocorrelation Function')
grid()
dev.off()
bitmap(file='test8.png')
opar <- par(mfrow = c(2,2), oma = c(0, 0, 1.1, 0))
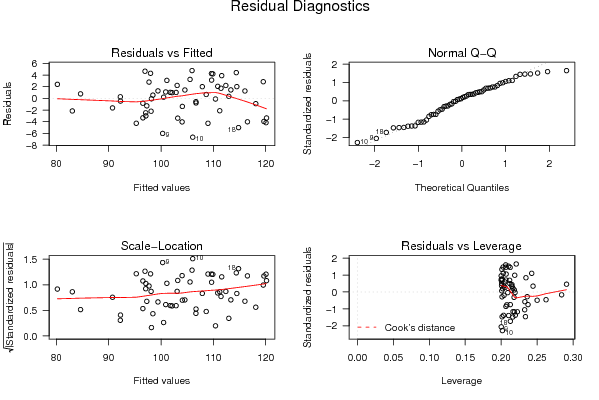
plot(mylm, las = 1, sub='Residual Diagnostics')
par(opar)
dev.off()
if (n > n25) {
bitmap(file='test9.png')
plot(kp3:nmkm3,gqarr[,2], main='Goldfeld-Quandt test',ylab='2-sided p-value',xlab='breakpoint')
grid()
dev.off()
}
load(file='createtable')
a<-table.start()
a<-table.row.start(a)
a<-table.element(a, 'Multiple Linear Regression - Estimated Regression Equation', 1, TRUE)
a<-table.row.end(a)
myeq <- colnames(x)[1]
myeq <- paste(myeq, '[t] = ', sep='')
for (i in 1:k){
if (mysum$coefficients[i,1] > 0) myeq <- paste(myeq, '+', '')
myeq <- paste(myeq, mysum$coefficients[i,1], sep=' ')
if (rownames(mysum$coefficients)[i] != '(Intercept)') {
myeq <- paste(myeq, rownames(mysum$coefficients)[i], sep='')
if (rownames(mysum$coefficients)[i] != 't') myeq <- paste(myeq, '[t]', sep='')
}
}
myeq <- paste(myeq, ' + e[t]')
a<-table.row.start(a)
a<-table.element(a, myeq)
a<-table.row.end(a)
a<-table.end(a)
table.save(a,file='mytable1.tab')
a<-table.start()
a<-table.row.start(a)
a<-table.element(a,hyperlink('ols1.htm','Multiple Linear Regression - Ordinary Least Squares',''), 6, TRUE)
a<-table.row.end(a)
a<-table.row.start(a)
a<-table.element(a,'Variable',header=TRUE)
a<-table.element(a,'Parameter',header=TRUE)
a<-table.element(a,'S.D.',header=TRUE)
a<-table.element(a,'T-STAT
H0: parameter = 0',header=TRUE)
a<-table.element(a,'2-tail p-value',header=TRUE)
a<-table.element(a,'1-tail p-value',header=TRUE)
a<-table.row.end(a)
for (i in 1:k){
a<-table.row.start(a)
a<-table.element(a,rownames(mysum$coefficients)[i],header=TRUE)
a<-table.element(a,mysum$coefficients[i,1])
a<-table.element(a, round(mysum$coefficients[i,2],6))
a<-table.element(a, round(mysum$coefficients[i,3],4))
a<-table.element(a, round(mysum$coefficients[i,4],6))
a<-table.element(a, round(mysum$coefficients[i,4]/2,6))
a<-table.row.end(a)
}
a<-table.end(a)
table.save(a,file='mytable2.tab')
a<-table.start()
a<-table.row.start(a)
a<-table.element(a, 'Multiple Linear Regression - Regression Statistics', 2, TRUE)
a<-table.row.end(a)
a<-table.row.start(a)
a<-table.element(a, 'Multiple R',1,TRUE)
a<-table.element(a, sqrt(mysum$r.squared))
a<-table.row.end(a)
a<-table.row.start(a)
a<-table.element(a, 'R-squared',1,TRUE)
a<-table.element(a, mysum$r.squared)
a<-table.row.end(a)
a<-table.row.start(a)
a<-table.element(a, 'Adjusted R-squared',1,TRUE)
a<-table.element(a, mysum$adj.r.squared)
a<-table.row.end(a)
a<-table.row.start(a)
a<-table.element(a, 'F-TEST (value)',1,TRUE)
a<-table.element(a, mysum$fstatistic[1])
a<-table.row.end(a)
a<-table.row.start(a)
a<-table.element(a, 'F-TEST (DF numerator)',1,TRUE)
a<-table.element(a, mysum$fstatistic[2])
a<-table.row.end(a)
a<-table.row.start(a)
a<-table.element(a, 'F-TEST (DF denominator)',1,TRUE)
a<-table.element(a, mysum$fstatistic[3])
a<-table.row.end(a)
a<-table.row.start(a)
a<-table.element(a, 'p-value',1,TRUE)
a<-table.element(a, 1-pf(mysum$fstatistic[1],mysum$fstatistic[2],mysum$fstatistic[3]))
a<-table.row.end(a)
a<-table.row.start(a)
a<-table.element(a, 'Multiple Linear Regression - Residual Statistics', 2, TRUE)
a<-table.row.end(a)
a<-table.row.start(a)
a<-table.element(a, 'Residual Standard Deviation',1,TRUE)
a<-table.element(a, mysum$sigma)
a<-table.row.end(a)
a<-table.row.start(a)
a<-table.element(a, 'Sum Squared Residuals',1,TRUE)
a<-table.element(a, sum(myerror*myerror))
a<-table.row.end(a)
a<-table.end(a)
table.save(a,file='mytable3.tab')
a<-table.start()
a<-table.row.start(a)
a<-table.element(a, 'Multiple Linear Regression - Actuals, Interpolation, and Residuals', 4, TRUE)
a<-table.row.end(a)
a<-table.row.start(a)
a<-table.element(a, 'Time or Index', 1, TRUE)
a<-table.element(a, 'Actuals', 1, TRUE)
a<-table.element(a, 'Interpolation
Forecast', 1, TRUE)
a<-table.element(a, 'Residuals
Prediction Error', 1, TRUE)
a<-table.row.end(a)
for (i in 1:n) {
a<-table.row.start(a)
a<-table.element(a,i, 1, TRUE)
a<-table.element(a,x[i])
a<-table.element(a,x[i]-mysum$resid[i])
a<-table.element(a,mysum$resid[i])
a<-table.row.end(a)
}
a<-table.end(a)
table.save(a,file='mytable4.tab')
if (n > n25) {
a<-table.start()
a<-table.row.start(a)
a<-table.element(a,'Goldfeld-Quandt test for Heteroskedasticity',4,TRUE)
a<-table.row.end(a)
a<-table.row.start(a)
a<-table.element(a,'p-values',header=TRUE)
a<-table.element(a,'Alternative Hypothesis',3,header=TRUE)
a<-table.row.end(a)
a<-table.row.start(a)
a<-table.element(a,'breakpoint index',header=TRUE)
a<-table.element(a,'greater',header=TRUE)
a<-table.element(a,'2-sided',header=TRUE)
a<-table.element(a,'less',header=TRUE)
a<-table.row.end(a)
for (mypoint in kp3:nmkm3) {
a<-table.row.start(a)
a<-table.element(a,mypoint,header=TRUE)
a<-table.element(a,gqarr[mypoint-kp3+1,1])
a<-table.element(a,gqarr[mypoint-kp3+1,2])
a<-table.element(a,gqarr[mypoint-kp3+1,3])
a<-table.row.end(a)
}
a<-table.end(a)
table.save(a,file='mytable5.tab')
a<-table.start()
a<-table.row.start(a)
a<-table.element(a,'Meta Analysis of Goldfeld-Quandt test for Heteroskedasticity',4,TRUE)
a<-table.row.end(a)
a<-table.row.start(a)
a<-table.element(a,'Description',header=TRUE)
a<-table.element(a,'# significant tests',header=TRUE)
a<-table.element(a,'% significant tests',header=TRUE)
a<-table.element(a,'OK/NOK',header=TRUE)
a<-table.row.end(a)
a<-table.row.start(a)
a<-table.element(a,'1% type I error level',header=TRUE)
a<-table.element(a,numsignificant1)
a<-table.element(a,numsignificant1/numgqtests)
if (numsignificant1/numgqtests < 0.01) dum <- 'OK' else dum <- 'NOK'
a<-table.element(a,dum)
a<-table.row.end(a)
a<-table.row.start(a)
a<-table.element(a,'5% type I error level',header=TRUE)
a<-table.element(a,numsignificant5)
a<-table.element(a,numsignificant5/numgqtests)
if (numsignificant5/numgqtests < 0.05) dum <- 'OK' else dum <- 'NOK'
a<-table.element(a,dum)
a<-table.row.end(a)
a<-table.row.start(a)
a<-table.element(a,'10% type I error level',header=TRUE)
a<-table.element(a,numsignificant10)
a<-table.element(a,numsignificant10/numgqtests)
if (numsignificant10/numgqtests < 0.1) dum <- 'OK' else dum <- 'NOK'
a<-table.element(a,dum)
a<-table.row.end(a)
a<-table.end(a)
table.save(a,file='mytable6.tab')
}