| Multiple Linear Regression - Estimated Regression Equation |
| TotaleIndustrieleProductie[t] = + 65.3855849994479 + 0.391844967146594Investeringsgoederen[t] -3.13645561373052M1[t] -16.4161083706153M2[t] -6.67855945910728M3[t] -7.52875096085604M4[t] -7.14899964574348M5[t] -6.91720624702877M6[t] -8.93045141604976M7[t] -7.10001788019115M8[t] -11.5049221293168M9[t] -3.25013328253928M10[t] + 0.789080323780102M11[t] + e[t] |
| Multiple Linear Regression - Ordinary Least Squares | |||||
| Variable | Parameter | S.D. | T-STAT H0: parameter = 0 | 2-tail p-value | 1-tail p-value |
| (Intercept) | 65.3855849994479 | 4.329953 | 15.1008 | 0 | 0 |
| Investeringsgoederen | 0.391844967146594 | 0.032659 | 11.9981 | 0 | 0 |
| M1 | -3.13645561373052 | 2.346995 | -1.3364 | 0.187862 | 0.093931 |
| M2 | -16.4161083706153 | 2.243134 | -7.3184 | 0 | 0 |
| M3 | -6.67855945910728 | 2.115353 | -3.1572 | 0.002781 | 0.001391 |
| M4 | -7.52875096085604 | 2.085633 | -3.6098 | 0.000742 | 0.000371 |
| M5 | -7.14899964574348 | 2.083819 | -3.4307 | 0.001264 | 0.000632 |
| M6 | -6.91720624702877 | 2.084673 | -3.3181 | 0.001755 | 0.000878 |
| M7 | -8.93045141604976 | 2.093163 | -4.2665 | 9.5e-05 | 4.8e-05 |
| M8 | -7.10001788019115 | 2.148319 | -3.3049 | 0.001824 | 0.000912 |
| M9 | -11.5049221293168 | 2.081968 | -5.526 | 1e-06 | 1e-06 |
| M10 | -3.25013328253928 | 2.088423 | -1.5563 | 0.126355 | 0.063177 |
| M11 | 0.789080323780102 | 2.070837 | 0.381 | 0.704887 | 0.352444 |
| Multiple Linear Regression - Regression Statistics | |
| Multiple R | 0.95286188776125 |
| R-squared | 0.907945777147933 |
| Adjusted R-squared | 0.884442571313363 |
| F-TEST (value) | 38.6307205722743 |
| F-TEST (DF numerator) | 12 |
| F-TEST (DF denominator) | 47 |
| p-value | 0 |
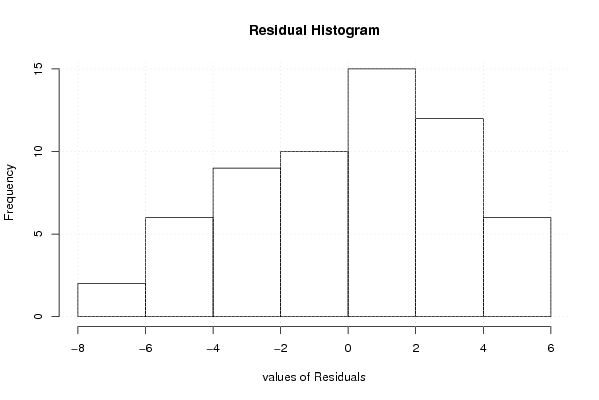
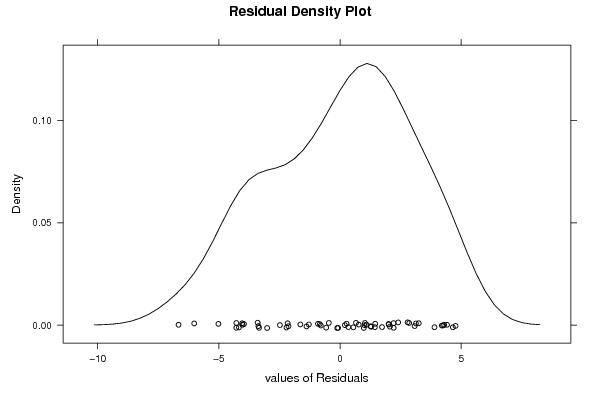
| Multiple Linear Regression - Residual Statistics | |
| Residual Standard Deviation | 3.27208786320357 |
| Sum Squared Residuals | 503.208272272634 |
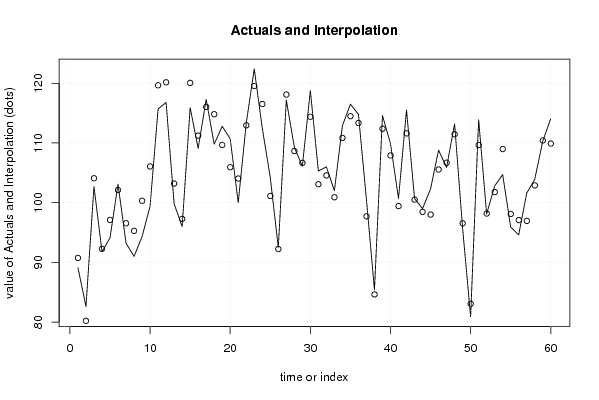
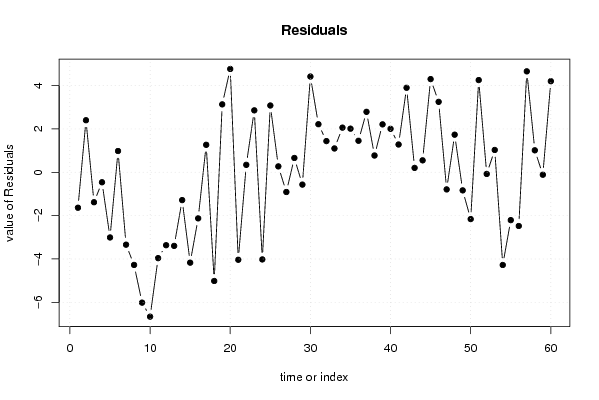
| Multiple Linear Regression - Actuals, Interpolation, and Residuals | |||
| Time or Index | Actuals | Interpolation Forecast | Residuals Prediction Error |
| 1 | 89.1 | 90.7362584972752 | -1.63625849727518 |
| 2 | 82.6 | 80.1995205104163 | 2.40047948958369 |
| 3 | 102.7 | 104.082672735916 | -1.3826727359163 |
| 4 | 91.8 | 92.260822154063 | -0.460822154062903 |
| 5 | 94.1 | 97.1076060946467 | -3.00760609464666 |
| 6 | 103.1 | 102.119908092550 | 0.980091907450189 |
| 7 | 93.2 | 96.5408737224948 | -3.3408737224948 |
| 8 | 91 | 95.2757320178953 | -4.27573201789533 |
| 9 | 94.3 | 100.314291477003 | -6.01429147700263 |
| 10 | 99.4 | 106.061272534042 | -6.66127253404189 |
| 11 | 115.7 | 119.661503338738 | -3.96150333873819 |
| 12 | 116.8 | 120.165511406542 | -3.36551140654184 |
| 13 | 99.8 | 103.196928452537 | -3.39692845253655 |
| 14 | 96 | 97.2839610780078 | -1.28396107800777 |
| 15 | 115.9 | 120.069947395497 | -4.16994739549732 |
| 16 | 109.1 | 111.226118563958 | -2.12611856395806 |
| 17 | 117.3 | 116.033718007827 | 1.26628199217286 |
| 18 | 109.8 | 114.815685028099 | -5.01568502809945 |
| 19 | 112.8 | 109.667680121906 | 3.13231987809430 |
| 20 | 110.7 | 105.933915124283 | 4.76608487571733 |
| 21 | 100 | 104.036818664895 | -4.03681866489526 |
| 22 | 113.3 | 112.957743955822 | 0.342256044178048 |
| 23 | 122.4 | 119.543949848594 | 2.85605015140581 |
| 24 | 112.5 | 116.521353212079 | -4.02135321207852 |
| 25 | 104.2 | 101.120150126660 | 3.0798498733404 |
| 26 | 92.5 | 92.2291610018167 | 0.270838998183285 |
| 27 | 117.2 | 118.110722559764 | -0.910722559764356 |
| 28 | 109.3 | 108.639941780791 | 0.66005821920946 |
| 29 | 106.1 | 106.668623293024 | -0.568623293023542 |
| 30 | 118.8 | 114.384655564238 | 4.41534443576181 |
| 31 | 105.3 | 103.084684673843 | 2.21531532615708 |
| 32 | 106 | 104.562457739270 | 1.4375422607304 |
| 33 | 102 | 100.902058927723 | 1.09794107227750 |
| 34 | 112.9 | 110.841781133230 | 2.05821886676966 |
| 35 | 116.5 | 114.489149772403 | 2.01085022759686 |
| 36 | 114.8 | 113.347408978191 | 1.45259102180889 |
| 37 | 100.5 | 97.7110989124842 | 2.78890108751577 |
| 38 | 85.4 | 84.6273686391728 | 0.772631360827213 |
| 39 | 114.6 | 112.389786039424 | 2.21021396057590 |
| 40 | 109.9 | 107.895436343212 | 2.00456365678799 |
| 41 | 100.7 | 99.4194914008116 | 1.28050859918845 |
| 42 | 115.5 | 111.602556297497 | 3.89744370250263 |
| 43 | 100.7 | 100.498507890675 | 0.201492109324601 |
| 44 | 99 | 98.4496762517827 | 0.550323748217264 |
| 45 | 102.3 | 98.0024061708377 | 4.29759382916229 |
| 46 | 108.8 | 105.551874076751 | 3.24812592324867 |
| 47 | 105.9 | 106.691434926186 | -0.791434926185919 |
| 48 | 113.2 | 111.466553135887 | 1.73344686411255 |
| 49 | 95.7 | 96.5355640110444 | -0.835564011044446 |
| 50 | 80.9 | 83.0599887705864 | -2.15998877058641 |
| 51 | 113.9 | 109.646871269398 | 4.25312873060207 |
| 52 | 98.1 | 98.1776811579765 | -0.0776811579764897 |
| 53 | 102.8 | 101.770561203691 | 1.02943879630888 |
| 54 | 104.7 | 108.977195017615 | -4.27719501761519 |
| 55 | 95.9 | 98.1082535910812 | -2.20825359108117 |
| 56 | 94.6 | 97.0782188667697 | -2.47821886676966 |
| 57 | 101.6 | 96.9444247595419 | 4.65557524045809 |
| 58 | 103.9 | 102.887328300154 | 1.01267169984552 |
| 59 | 110.3 | 110.413962114079 | -0.113962114078570 |
| 60 | 114.1 | 109.899173267301 | 4.20082673269892 |
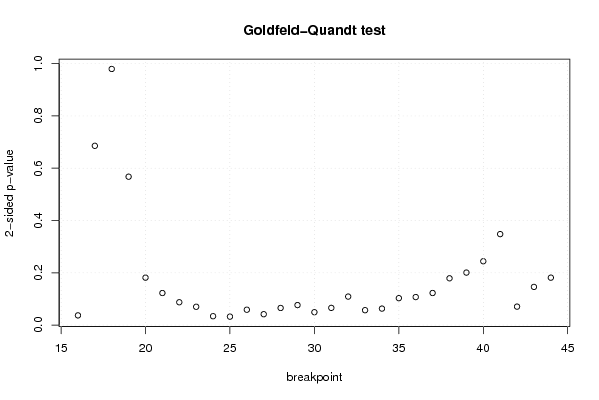
| Goldfeld-Quandt test for Heteroskedasticity | |||
| p-values | Alternative Hypothesis | ||
| breakpoint index | greater | 2-sided | less |
| 16 | 0.0186078023987442 | 0.0372156047974883 | 0.981392197601256 |
| 17 | 0.34284318455928 | 0.68568636911856 | 0.65715681544072 |
| 18 | 0.489813788911416 | 0.979627577822832 | 0.510186211088584 |
| 19 | 0.716187185212172 | 0.567625629575656 | 0.283812814787828 |
| 20 | 0.909225348749785 | 0.181549302500430 | 0.0907746512502151 |
| 21 | 0.938676766612407 | 0.122646466775186 | 0.0613232333875929 |
| 22 | 0.956260400156272 | 0.0874791996874552 | 0.0437395998437276 |
| 23 | 0.96494027650024 | 0.0701194469995183 | 0.0350597234997592 |
| 24 | 0.982963505011813 | 0.0340729899763741 | 0.0170364949881870 |
| 25 | 0.98380667275438 | 0.0323866544912384 | 0.0161933272456192 |
| 26 | 0.970580928227385 | 0.0588381435452304 | 0.0294190717726152 |
| 27 | 0.979122822825159 | 0.0417543543496824 | 0.0208771771748412 |
| 28 | 0.967166935276492 | 0.0656661294470158 | 0.0328330647235079 |
| 29 | 0.961703695023962 | 0.076592609952075 | 0.0382963049760375 |
| 30 | 0.975314781868863 | 0.0493704362622732 | 0.0246852181311366 |
| 31 | 0.967011497237435 | 0.0659770055251303 | 0.0329885027625652 |
| 32 | 0.945425629711653 | 0.109148740576694 | 0.0545743702883472 |
| 33 | 0.971441768497614 | 0.0571164630047727 | 0.0285582315023863 |
| 34 | 0.96840176955596 | 0.0631964608880787 | 0.0315982304440394 |
| 35 | 0.948471357142022 | 0.103057285715955 | 0.0515286428579775 |
| 36 | 0.946357099502944 | 0.107285800994111 | 0.0536429004970555 |
| 37 | 0.938585914212868 | 0.122828171574264 | 0.061414085787132 |
| 38 | 0.910466733135984 | 0.179066533728032 | 0.0895332668640159 |
| 39 | 0.899559894602705 | 0.200880210794590 | 0.100440105397295 |
| 40 | 0.877881692803824 | 0.244236614392352 | 0.122118307196176 |
| 41 | 0.82597476540993 | 0.348050469180139 | 0.174025234590070 |
| 42 | 0.964625359082896 | 0.0707492818342086 | 0.0353746409171043 |
| 43 | 0.926958169700755 | 0.146083660598490 | 0.0730418302992452 |
| 44 | 0.90927189681722 | 0.181456206365561 | 0.0907281031827803 |
| Meta Analysis of Goldfeld-Quandt test for Heteroskedasticity | |||
| Description | # significant tests | % significant tests | OK/NOK |
| 1% type I error level | 0 | 0 | OK |
| 5% type I error level | 5 | 0.172413793103448 | NOK |
| 10% type I error level | 14 | 0.482758620689655 | NOK |