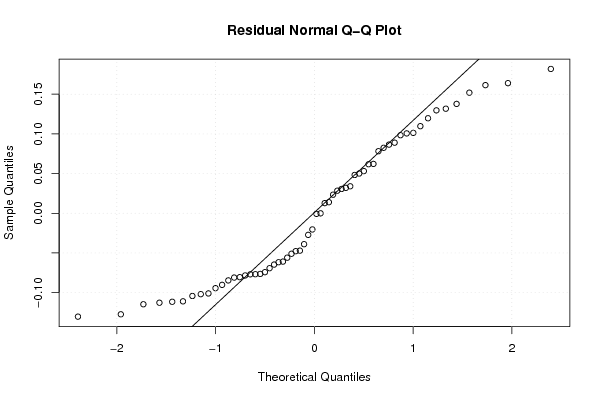
| Multiple Linear Regression - Estimated Regression Equation |
| dollar/euro[t] = + 0.736379297486959 + 0.00396306035761503`japanseyen/euro`[t] + 0.0326966020507571M1[t] + 0.0402548296947051M2[t] + 0.0344662394072104M3[t] + 0.0352598018886685M4[t] + 0.0303498489735416M5[t] + 0.0443341545114475M6[t] + 0.0344142389093547M7[t] + 0.0343186178286897M8[t] + 0.0111029233665956M9[t] + 0.0241011607823836M10[t] + 0.0223844437735641M11[t] + e[t] |
| Multiple Linear Regression - Ordinary Least Squares | |||||
| Variable | Parameter | S.D. | T-STAT H0: parameter = 0 | 2-tail p-value | 1-tail p-value |
| (Intercept) | 0.736379297486959 | 0.148558 | 4.9568 | 1e-05 | 5e-06 |
| `japanseyen/euro` | 0.00396306035761503 | 0.000993 | 3.9925 | 0.000228 | 0.000114 |
| M1 | 0.0326966020507571 | 0.063824 | 0.5123 | 0.610848 | 0.305424 |
| M2 | 0.0402548296947051 | 0.063912 | 0.6299 | 0.531842 | 0.265921 |
| M3 | 0.0344662394072104 | 0.064078 | 0.5379 | 0.593197 | 0.296598 |
| M4 | 0.0352598018886685 | 0.064225 | 0.549 | 0.585604 | 0.292802 |
| M5 | 0.0303498489735416 | 0.064097 | 0.4735 | 0.638048 | 0.319024 |
| M6 | 0.0443341545114475 | 0.063965 | 0.6931 | 0.491657 | 0.245828 |
| M7 | 0.0344142389093547 | 0.063958 | 0.5381 | 0.593062 | 0.296531 |
| M8 | 0.0343186178286897 | 0.063821 | 0.5377 | 0.5933 | 0.29665 |
| M9 | 0.0111029233665956 | 0.06381 | 0.174 | 0.862613 | 0.431306 |
| M10 | 0.0241011607823836 | 0.063811 | 0.3777 | 0.707356 | 0.353678 |
| M11 | 0.0223844437735641 | 0.063827 | 0.3507 | 0.727376 | 0.363688 |
| Multiple Linear Regression - Regression Statistics | |
| Multiple R | 0.5301310807215 |
| R-squared | 0.281038962746945 |
| Adjusted R-squared | 0.0974744425972294 |
| F-TEST (value) | 1.53100916515745 |
| F-TEST (DF numerator) | 12 |
| F-TEST (DF denominator) | 47 |
| p-value | 0.146801831859654 |
| Multiple Linear Regression - Residual Statistics | |
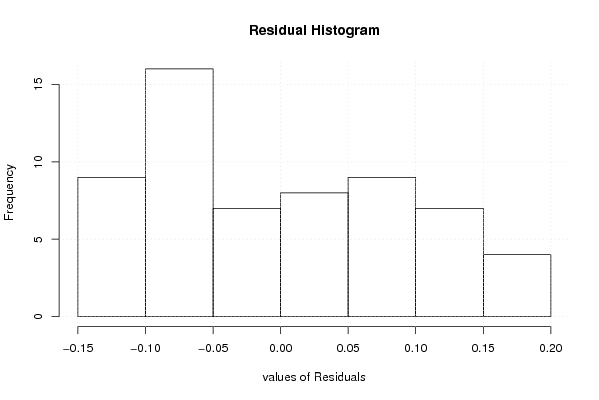
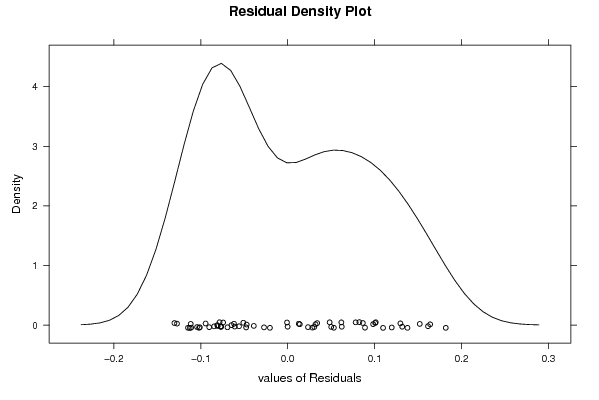
| Residual Standard Deviation | 0.100890615063093 |
| Sum Squared Residuals | 0.478409061767028 |
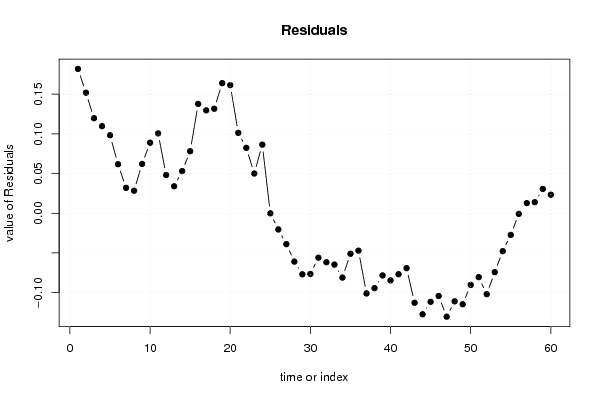
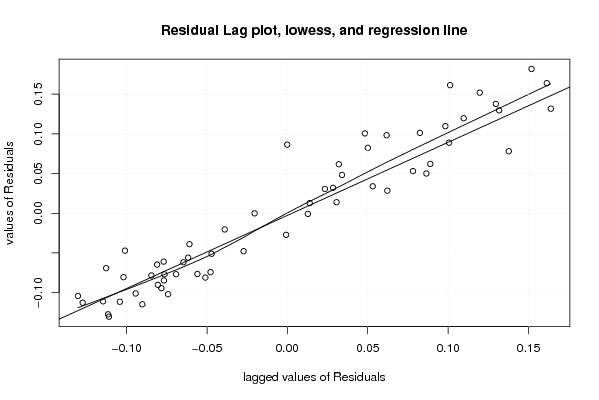
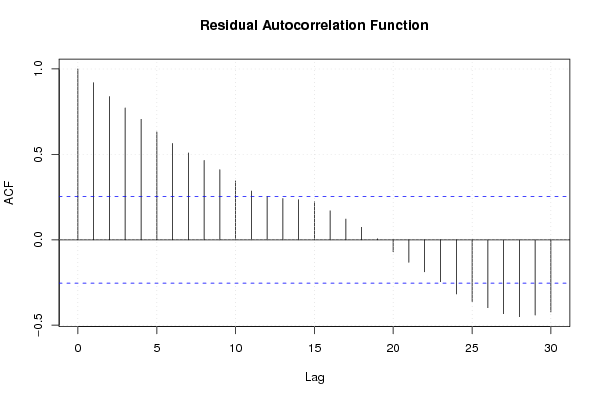
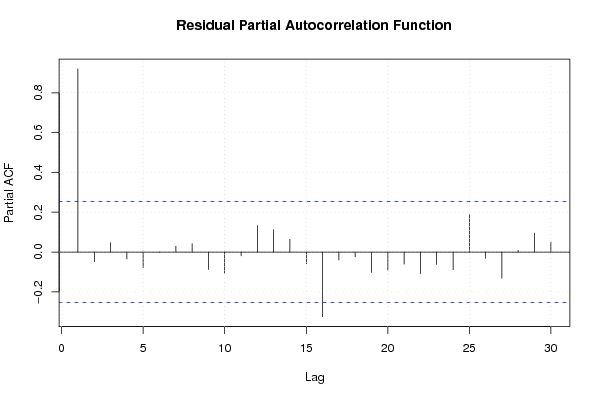
| Multiple Linear Regression - Actuals, Interpolation, and Residuals | |||
| Time or Index | Actuals | Interpolation Forecast | Residuals Prediction Error |
| 1 | 1.4816 | 1.29976931202594 | 0.181830687974062 |
| 2 | 1.4562 | 1.30427598319453 | 0.151924016805472 |
| 3 | 1.4268 | 1.30708723388306 | 0.119712766116942 |
| 4 | 1.4088 | 1.29908280237061 | 0.109717197629389 |
| 5 | 1.4016 | 1.30328788827800 | 0.0983121117220017 |
| 6 | 1.365 | 1.30324296014995 | 0.061757039850053 |
| 7 | 1.319 | 1.28698214797567 | 0.0320178520243298 |
| 8 | 1.305 | 1.27658256996521 | 0.0284174300347939 |
| 9 | 1.2785 | 1.21631226115941 | 0.0621877388405885 |
| 10 | 1.3239 | 1.23497767488659 | 0.0889223251134111 |
| 11 | 1.3449 | 1.24427826567194 | 0.100621734328061 |
| 12 | 1.2732 | 1.22494537837374 | 0.0482546216262614 |
| 13 | 1.3322 | 1.29822371848647 | 0.0339762815135263 |
| 14 | 1.4369 | 1.38377497396829 | 0.0531250260317147 |
| 15 | 1.4975 | 1.41932110321072 | 0.0781788967892847 |
| 16 | 1.577 | 1.43921661661588 | 0.137783383384122 |
| 17 | 1.5553 | 1.42562756151757 | 0.129672438482426 |
| 18 | 1.5557 | 1.4239577786429 | 0.131742221357099 |
| 19 | 1.575 | 1.41106556777260 | 0.163934432227403 |
| 20 | 1.5527 | 1.39127353671458 | 0.161426463285415 |
| 21 | 1.4748 | 1.373526865546 | 0.101273134454001 |
| 22 | 1.4718 | 1.38933887581569 | 0.0824611241843057 |
| 23 | 1.457 | 1.40692226274846 | 0.0500777372515401 |
| 24 | 1.4684 | 1.38192219913887 | 0.08647780086113 |
| 25 | 1.4227 | 1.42278270552631 | -8.2705526313915e-05 |
| 26 | 1.3896 | 1.41001043353570 | -0.0204104335356969 |
| 27 | 1.3622 | 1.40117028677284 | -0.0389702867728385 |
| 28 | 1.3716 | 1.43251904461151 | -0.0609190446115086 |
| 29 | 1.3419 | 1.41885072830605 | -0.0769507283060524 |
| 30 | 1.3511 | 1.42756416356833 | -0.0764641635683304 |
| 31 | 1.3516 | 1.40757807465790 | -0.0559780746578955 |
| 32 | 1.3242 | 1.38592340523180 | -0.0617234052318047 |
| 33 | 1.3074 | 1.37206053321368 | -0.0646605332136821 |
| 34 | 1.2999 | 1.38093718785755 | -0.0810371878575503 |
| 35 | 1.3213 | 1.37232474582648 | -0.0510247458264808 |
| 36 | 1.2881 | 1.33523734812617 | -0.0471373481261649 |
| 37 | 1.2611 | 1.36214788205480 | -0.101047882054804 |
| 38 | 1.2727 | 1.36709048986273 | -0.0943904898627262 |
| 39 | 1.2811 | 1.35947889181073 | -0.0783788918107285 |
| 40 | 1.2684 | 1.35302005383775 | -0.0846200538377511 |
| 41 | 1.265 | 1.34180883495402 | -0.0768088349540164 |
| 42 | 1.277 | 1.34624216503007 | -0.06924216503007 |
| 43 | 1.2271 | 1.33984937314625 | -0.112749373146255 |
| 44 | 1.202 | 1.32933090332506 | -0.127330903325062 |
| 45 | 1.1938 | 1.30536222739502 | -0.111562227395021 |
| 46 | 1.2103 | 1.3145559268675 | -0.104255926867499 |
| 47 | 1.1856 | 1.31589076633404 | -0.130290766334043 |
| 48 | 1.1786 | 1.28958289280644 | -0.110982892806440 |
| 49 | 1.2015 | 1.31617638190647 | -0.114676381906470 |
| 50 | 1.2256 | 1.31584811943876 | -0.0902481194387638 |
| 51 | 1.2292 | 1.30974248432266 | -0.0805424843226598 |
| 52 | 1.2037 | 1.30566148256425 | -0.101961482564252 |
| 53 | 1.2165 | 1.29072498694436 | -0.0742249869443587 |
| 54 | 1.2694 | 1.31719293260875 | -0.0477929326087519 |
| 55 | 1.2938 | 1.32102483644758 | -0.0272248364475831 |
| 56 | 1.3201 | 1.32088958476334 | -0.000789584763342042 |
| 57 | 1.3014 | 1.28863811268589 | 0.0127618873141142 |
| 58 | 1.3119 | 1.29799033457267 | 0.0139096654273322 |
| 59 | 1.3408 | 1.31018395941908 | 0.0306160405809229 |
| 60 | 1.2991 | 1.27571218155479 | 0.0233878184452127 |
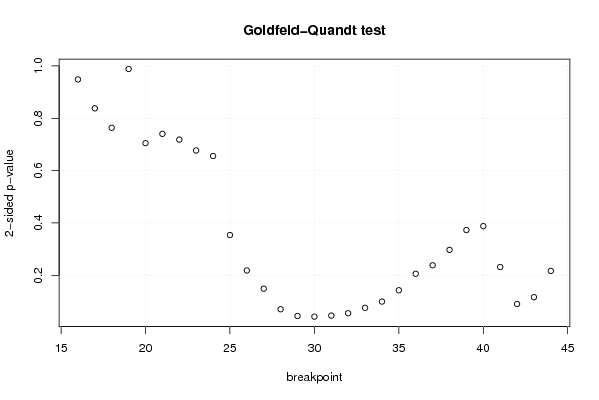
| Goldfeld-Quandt test for Heteroskedasticity | |||
| p-values | Alternative Hypothesis | ||
| breakpoint index | greater | 2-sided | less |
| 16 | 0.525752337811907 | 0.948495324376186 | 0.474247662188093 |
| 17 | 0.419038091692187 | 0.838076183384375 | 0.580961908307813 |
| 18 | 0.381896069837683 | 0.763792139675366 | 0.618103930162317 |
| 19 | 0.505730232913822 | 0.988539534172356 | 0.494269767086178 |
| 20 | 0.647564074075112 | 0.704871851849776 | 0.352435925924888 |
| 21 | 0.629716034794542 | 0.740567930410917 | 0.370283965205458 |
| 22 | 0.640721451047226 | 0.718557097905547 | 0.359278548952774 |
| 23 | 0.66139690694252 | 0.677206186114961 | 0.338603093057480 |
| 24 | 0.672116864137040 | 0.655766271725921 | 0.327883135862960 |
| 25 | 0.823046767778551 | 0.353906464442898 | 0.176953232221449 |
| 26 | 0.890677693353915 | 0.218644613292170 | 0.109322306646085 |
| 27 | 0.925559417377834 | 0.148881165244333 | 0.0744405826221665 |
| 28 | 0.9647854376943 | 0.0704291246114 | 0.0352145623057 |
| 29 | 0.977648539918905 | 0.0447029201621896 | 0.0223514600810948 |
| 30 | 0.978953254517737 | 0.0420934909645269 | 0.0210467454822635 |
| 31 | 0.976951917305994 | 0.0460961653880115 | 0.0230480826940057 |
| 32 | 0.972444117592336 | 0.0551117648153274 | 0.0275558824076637 |
| 33 | 0.962025003012479 | 0.0759499939750426 | 0.0379749969875213 |
| 34 | 0.95015721806025 | 0.0996855638794993 | 0.0498427819397497 |
| 35 | 0.928509928582564 | 0.142980142834873 | 0.0714900714174363 |
| 36 | 0.89709476076422 | 0.205810478471561 | 0.102905239235780 |
| 37 | 0.880857877735305 | 0.23828424452939 | 0.119142122264695 |
| 38 | 0.851384567837919 | 0.297230864324162 | 0.148615432162081 |
| 39 | 0.813520912030097 | 0.372958175939806 | 0.186479087969903 |
| 40 | 0.805987719078093 | 0.388024561843814 | 0.194012280921907 |
| 41 | 0.884112294249349 | 0.231775411501303 | 0.115887705750651 |
| 42 | 0.954764150806363 | 0.0904716983872748 | 0.0452358491936374 |
| 43 | 0.941718914044234 | 0.116562171911532 | 0.0582810859557661 |
| 44 | 0.89153923538632 | 0.216921529227359 | 0.108460764613680 |
| Meta Analysis of Goldfeld-Quandt test for Heteroskedasticity | |||
| Description | # significant tests | % significant tests | OK/NOK |
| 1% type I error level | 0 | 0 | OK |
| 5% type I error level | 3 | 0.103448275862069 | NOK |
| 10% type I error level | 8 | 0.275862068965517 | NOK |