| Multiple Linear Regression - Estimated Regression Equation |
| geb[t] = + 2.18467317439167 + 0.0393570170256916aut[t] -0.515522739837599M1[t] -0.424949404142556M2[t] -0.135718050654185M3[t] -0.662850919050637M4[t] -0.923544961910348M5[t] -0.851923901991616M6[t] -0.538586012966687M7[t] -0.54175420438965M8[t] -0.374627199087015M9[t] -0.229486767499956M10[t] -0.215108687630309M11[t] -0.00820863771261903t + e[t] |
| Multiple Linear Regression - Ordinary Least Squares | |||||
| Variable | Parameter | S.D. | T-STAT H0: parameter = 0 | 2-tail p-value | 1-tail p-value |
| (Intercept) | 2.18467317439167 | 0.42263 | 5.1692 | 5e-06 | 2e-06 |
| aut | 0.0393570170256916 | 0.019602 | 2.0079 | 0.050427 | 0.025213 |
| M1 | -0.515522739837599 | 0.170905 | -3.0164 | 0.004119 | 0.002059 |
| M2 | -0.424949404142556 | 0.176354 | -2.4096 | 0.019937 | 0.009969 |
| M3 | -0.135718050654185 | 0.236876 | -0.5729 | 0.569411 | 0.284705 |
| M4 | -0.662850919050637 | 0.261951 | -2.5304 | 0.014801 | 0.0074 |
| M5 | -0.923544961910348 | 0.223612 | -4.1301 | 0.000148 | 7.4e-05 |
| M6 | -0.851923901991616 | 0.26883 | -3.169 | 0.00269 | 0.001345 |
| M7 | -0.538586012966687 | 0.228334 | -2.3588 | 0.022545 | 0.011273 |
| M8 | -0.54175420438965 | 0.191054 | -2.8356 | 0.006725 | 0.003362 |
| M9 | -0.374627199087015 | 0.201596 | -1.8583 | 0.069395 | 0.034697 |
| M10 | -0.229486767499956 | 0.171965 | -1.3345 | 0.188471 | 0.094235 |
| M11 | -0.215108687630309 | 0.175407 | -1.2263 | 0.22618 | 0.11309 |
| t | -0.00820863771261903 | 0.002023 | -4.0576 | 0.000186 | 9.3e-05 |
| Multiple Linear Regression - Regression Statistics | |
| Multiple R | 0.681137998045538 |
| R-squared | 0.463948972381483 |
| Adjusted R-squared | 0.315679539210404 |
| F-TEST (value) | 3.12909385608941 |
| F-TEST (DF numerator) | 13 |
| F-TEST (DF denominator) | 47 |
| p-value | 0.00204122686203667 |
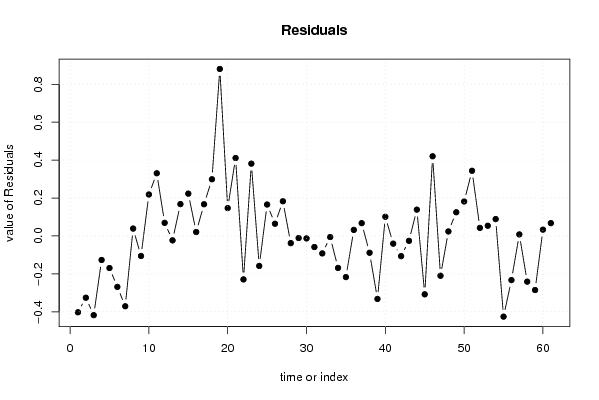
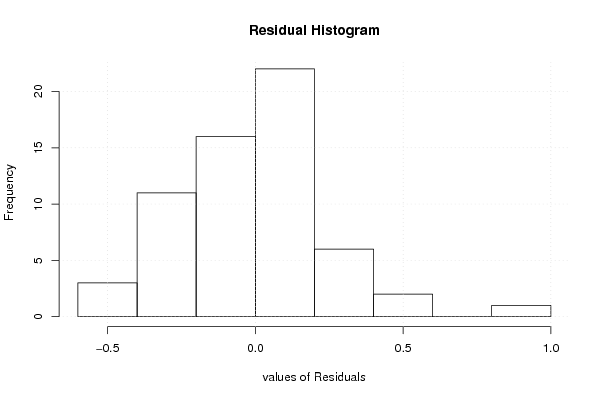
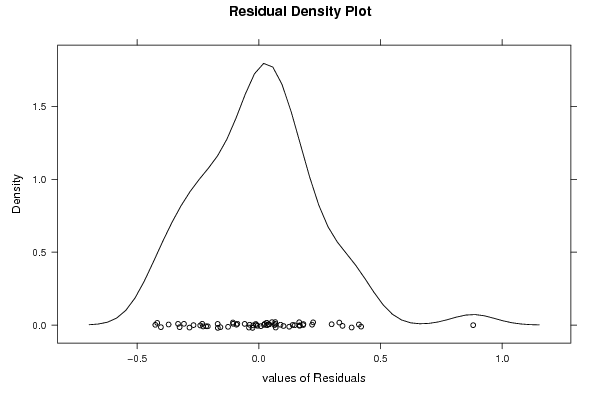
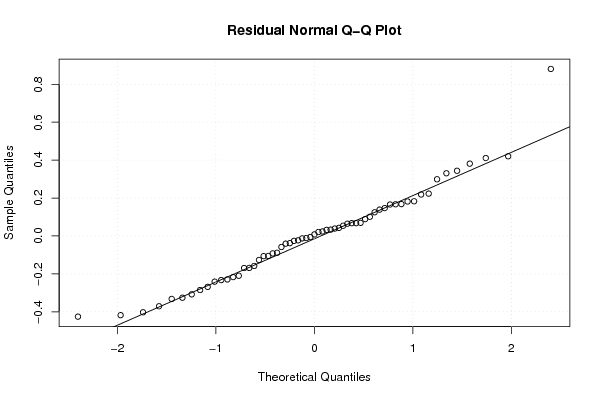
| Multiple Linear Regression - Residual Statistics | |
| Residual Standard Deviation | 0.271082113454329 |
| Sum Squared Residuals | 3.45381907503868 |
| Multiple Linear Regression - Actuals, Interpolation, and Residuals | |||
| Time or Index | Actuals | Interpolation Forecast | Residuals Prediction Error |
| 1 | 2.155 | 2.55757335872075 | -0.402573358720753 |
| 2 | 2.172 | 2.49774115418935 | -0.325741154189352 |
| 3 | 2.15 | 2.56773154467335 | -0.417731544673346 |
| 4 | 2.533 | 2.65958346188570 | -0.126583461885697 |
| 5 | 2.058 | 2.22727044662270 | -0.169270446622695 |
| 6 | 2.16 | 2.42862921350386 | -0.268629213503857 |
| 7 | 2.26 | 2.63087922231101 | -0.370879222311009 |
| 8 | 2.498 | 2.45904383476168 | 0.0389561652383172 |
| 9 | 2.695 | 2.80053940433388 | -0.105539404333883 |
| 10 | 2.799 | 2.58034562571720 | 0.218654374282803 |
| 11 | 2.947 | 2.61642640081375 | 0.33057359918625 |
| 12 | 2.93 | 2.86087304497395 | 0.0691269550260502 |
| 13 | 2.318 | 2.34111672614333 | -0.0231167261433267 |
| 14 | 2.54 | 2.37208115989020 | 0.167918840109803 |
| 15 | 2.57 | 2.34686692618904 | 0.223133073810957 |
| 16 | 2.669 | 2.64817688801212 | 0.0208231119878763 |
| 17 | 2.45 | 2.28284951572685 | 0.167150484273151 |
| 18 | 2.842 | 2.54304702306142 | 0.29895297693858 |
| 19 | 3.44 | 2.55925641238813 | 0.880743587611872 |
| 20 | 2.678 | 2.53099542294852 | 0.147004577051475 |
| 21 | 2.981 | 2.57007167369531 | 0.41092832630469 |
| 22 | 2.26 | 2.48920173534957 | -0.229201735349573 |
| 23 | 2.844 | 2.4627442103923 | 0.381255789607698 |
| 24 | 2.546 | 2.70416036424152 | -0.158160364241524 |
| 25 | 2.456 | 2.29023506419299 | 0.165764935807014 |
| 26 | 2.295 | 2.23040285966159 | 0.0645971403384149 |
| 27 | 2.379 | 2.19597908397642 | 0.183020916023581 |
| 28 | 2.479 | 2.51692819729532 | -0.0379281972953199 |
| 29 | 2.057 | 2.06804587786450 | -0.0110458778645022 |
| 30 | 2.28 | 2.29282206987595 | -0.0128220698759509 |
| 31 | 2.351 | 2.40935249560115 | -0.0583524956011465 |
| 32 | 2.276 | 2.36810369054307 | -0.0921036905430653 |
| 33 | 2.548 | 2.5537061156765 | -0.00570611567649984 |
| 34 | 2.311 | 2.47968429829323 | -0.168684298293233 |
| 35 | 2.201 | 2.41776610099581 | -0.216766100995814 |
| 36 | 2.725 | 2.69298993247010 | 0.0320100675298954 |
| 37 | 2.408 | 2.34054029301570 | 0.0674597069843029 |
| 38 | 2.139 | 2.22761547251664 | -0.0886154725166388 |
| 39 | 1.898 | 2.23014793581860 | -0.332147935818597 |
| 40 | 2.537 | 2.43582034626925 | 0.101179653730753 |
| 41 | 2.069 | 2.10965320592454 | -0.0406532059245358 |
| 42 | 2.063 | 2.16944478256428 | -0.106444782564285 |
| 43 | 2.524 | 2.54994272148079 | -0.0259427214807943 |
| 44 | 2.437 | 2.29817323235229 | 0.138826767647711 |
| 45 | 2.189 | 2.49680283012123 | -0.307802830121227 |
| 46 | 2.793 | 2.37279760111533 | 0.420202398884668 |
| 47 | 2.074 | 2.28388049013829 | -0.209880490138289 |
| 48 | 2.622 | 2.59826455355314 | 0.0237354464468572 |
| 49 | 2.278 | 2.15316849602026 | 0.124831503979743 |
| 50 | 2.144 | 1.96215935374223 | 0.181840646257774 |
| 51 | 2.427 | 2.08327450934259 | 0.343725490657406 |
| 52 | 2.139 | 2.09649110653761 | 0.0425088934623879 |
| 53 | 1.828 | 1.77418095386142 | 0.0538190461385819 |
| 54 | 2.072 | 1.98305691099449 | 0.0889430890055127 |
| 55 | 1.8 | 2.22556914821892 | -0.425569148218922 |
| 56 | 1.758 | 1.99068381939444 | -0.232683819394438 |
| 57 | 2.246 | 2.23787997617308 | 0.00812002382691998 |
| 58 | 1.987 | 2.22797073952466 | -0.240970739524665 |
| 59 | 1.868 | 2.15318279765984 | -0.285182797659845 |
| 60 | 2.514 | 2.48071210476128 | 0.03328789523872 |
| 61 | 2.121 | 2.05336606190698 | 0.0676339380930193 |
| Goldfeld-Quandt test for Heteroskedasticity | |||
| p-values | Alternative Hypothesis | ||
| breakpoint index | greater | 2-sided | less |
| 17 | 0.0915680095592984 | 0.183136019118597 | 0.908431990440702 |
| 18 | 0.106753579186263 | 0.213507158372525 | 0.893246420813737 |
| 19 | 0.784837701992914 | 0.430324596014172 | 0.215162298007086 |
| 20 | 0.761017028457816 | 0.477965943084368 | 0.238982971542184 |
| 21 | 0.732336558108436 | 0.535326883783129 | 0.267663441891564 |
| 22 | 0.95115056163527 | 0.0976988767294587 | 0.0488494383647294 |
| 23 | 0.979481974028564 | 0.0410360519428713 | 0.0205180259714357 |
| 24 | 0.985941966154927 | 0.0281160676901463 | 0.0140580338450732 |
| 25 | 0.974276238042633 | 0.0514475239147336 | 0.0257237619573668 |
| 26 | 0.962978865957737 | 0.0740422680845252 | 0.0370211340422626 |
| 27 | 0.943736764607692 | 0.112526470784616 | 0.056263235392308 |
| 28 | 0.932188588795973 | 0.135622822408054 | 0.0678114112040271 |
| 29 | 0.911738831158343 | 0.176522337683315 | 0.0882611688416574 |
| 30 | 0.883281063158495 | 0.233437873683009 | 0.116718936841505 |
| 31 | 0.899807379260169 | 0.200385241479662 | 0.100192620739831 |
| 32 | 0.874919552354847 | 0.250160895290306 | 0.125080447645153 |
| 33 | 0.849768725691866 | 0.300462548616267 | 0.150231274308134 |
| 34 | 0.8215577724806 | 0.356884455038799 | 0.178442227519399 |
| 35 | 0.828254388976777 | 0.343491222046447 | 0.171745611023223 |
| 36 | 0.751528101572132 | 0.496943796855736 | 0.248471898427868 |
| 37 | 0.656566869630201 | 0.686866260739597 | 0.343433130369799 |
| 38 | 0.601439584260483 | 0.797120831479033 | 0.398560415739517 |
| 39 | 0.806417718791877 | 0.387164562416246 | 0.193582281208123 |
| 40 | 0.709206738313203 | 0.581586523373595 | 0.290793261686797 |
| 41 | 0.631930888689163 | 0.736138222621673 | 0.368069111310837 |
| 42 | 0.593366386068655 | 0.81326722786269 | 0.406633613931345 |
| 43 | 0.481752713144172 | 0.963505426288344 | 0.518247286855828 |
| 44 | 0.478895569839736 | 0.957791139679471 | 0.521104430160264 |
| Meta Analysis of Goldfeld-Quandt test for Heteroskedasticity | |||
| Description | # significant tests | % significant tests | OK/NOK |
| 1% type I error level | 0 | 0 | OK |
| 5% type I error level | 2 | 0.0714285714285714 | NOK |
| 10% type I error level | 5 | 0.178571428571429 | NOK |