| Multiple Linear Regression - Estimated Regression Equation |
| dollar/euro[t] = + 0.87081207549798 + 0.00398330914477538`japanseyen/euro`[t] -0.00929114954903965M1[t] + 0.00203645132440579M2[t] + 1.65863052193402e-05M3[t] + 0.00459523507501139M4[t] + 0.00352491868082835M5[t] + 0.0213563932885019M6[t] + 0.0152530710875644M7[t] + 0.0190352757404278M8[t] -0.000333249651898802M9[t] + 0.0164825936044026M10[t] + 0.0185390565970668M11[t] -0.00381444702971641t + e[t] |
| Multiple Linear Regression - Ordinary Least Squares | |||||
| Variable | Parameter | S.D. | T-STAT H0: parameter = 0 | 2-tail p-value | 1-tail p-value |
| (Intercept) | 0.87081207549798 | 0.105136 | 8.2827 | 0 | 0 |
| `japanseyen/euro` | 0.00398330914477538 | 0.000691 | 5.7634 | 1e-06 | 0 |
| M1 | -0.00929114954903965 | 0.044826 | -0.2073 | 0.836713 | 0.418357 |
| M2 | 0.00203645132440579 | 0.04482 | 0.0454 | 0.963956 | 0.481978 |
| M3 | 1.65863052193402e-05 | 0.044875 | 4e-04 | 0.999707 | 0.499853 |
| M4 | 0.00459523507501139 | 0.044924 | 0.1023 | 0.918971 | 0.459486 |
| M5 | 0.00352491868082835 | 0.044786 | 0.0787 | 0.937608 | 0.468804 |
| M6 | 0.0213563932885019 | 0.044652 | 0.4783 | 0.634716 | 0.317358 |
| M7 | 0.0152530710875644 | 0.044612 | 0.3419 | 0.73398 | 0.36699 |
| M8 | 0.0190352757404278 | 0.044488 | 0.4279 | 0.670738 | 0.335369 |
| M9 | -0.000333249651898802 | 0.044457 | -0.0075 | 0.994052 | 0.497026 |
| M10 | 0.0164825936044026 | 0.044442 | 0.3709 | 0.71243 | 0.356215 |
| M11 | 0.0185390565970668 | 0.044443 | 0.4171 | 0.678518 | 0.339259 |
| t | -0.00381444702971641 | 0.000534 | -7.138 | 0 | 0 |
| Multiple Linear Regression - Regression Statistics | |
| Multiple R | 0.811712323002453 |
| R-squared | 0.658876895314039 |
| Adjusted R-squared | 0.562472539641919 |
| F-TEST (value) | 6.83451375947102 |
| F-TEST (DF numerator) | 13 |
| F-TEST (DF denominator) | 46 |
| p-value | 4.52281989304915e-07 |
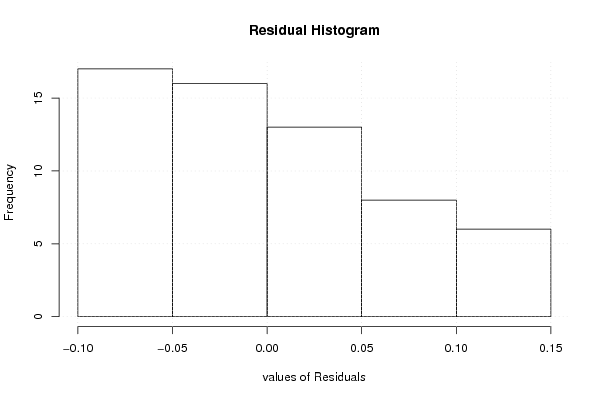
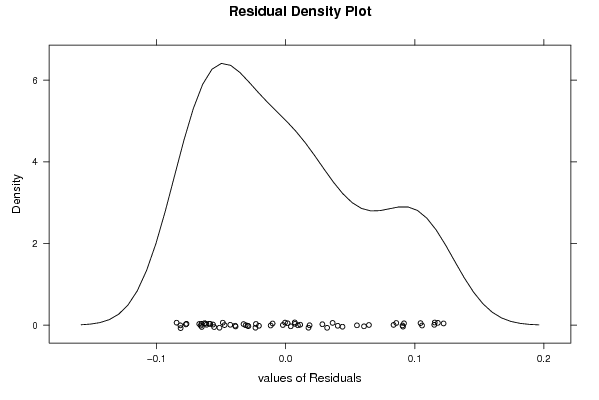
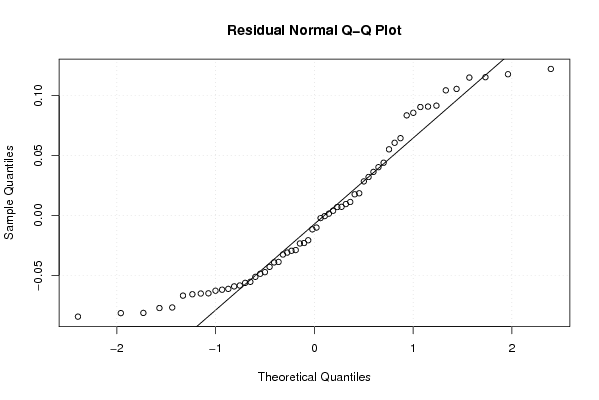
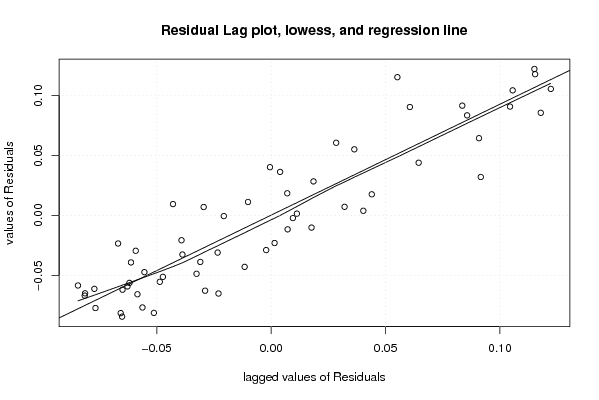
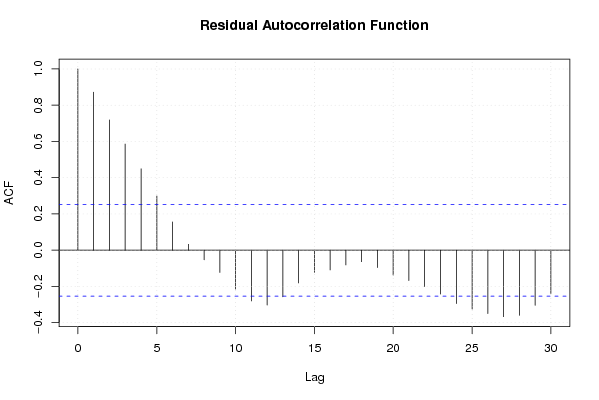
| Multiple Linear Regression - Residual Statistics | |
| Residual Standard Deviation | 0.0702463354068596 |
| Sum Squared Residuals | 0.226989191352279 |
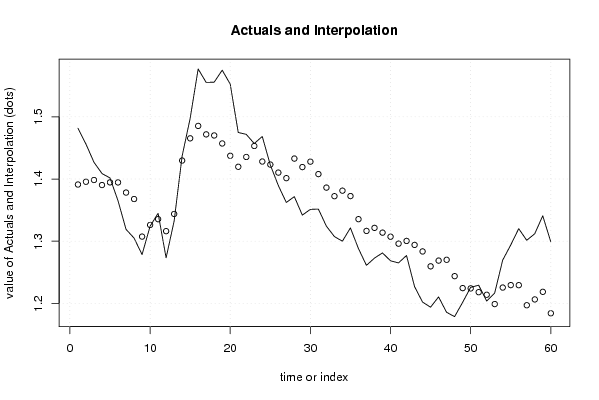
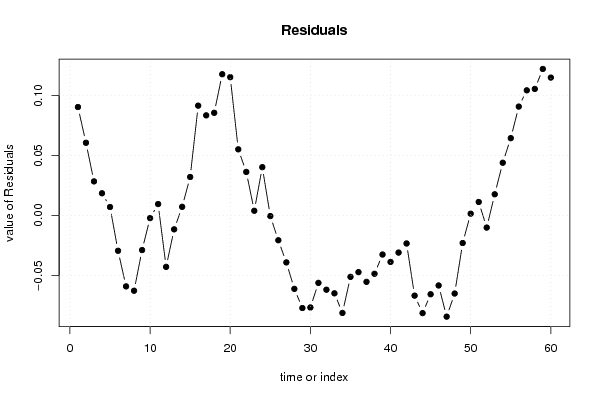
| Multiple Linear Regression - Actuals, Interpolation, and Residuals | |||
| Time or Index | Actuals | Interpolation Forecast | Residuals Prediction Error |
| 1 | 1.4816 | 1.39111140649609 | 0.09048859350391 |
| 2 | 1.4562 | 1.39555741229835 | 0.0606425877016533 |
| 3 | 1.4268 | 1.39836688109361 | 0.0284331189063933 |
| 4 | 1.4088 | 1.39028813653228 | 0.0185118634677189 |
| 5 | 1.4016 | 1.39456498414136 | 0.00703501585863508 |
| 6 | 1.365 | 1.39448109734682 | -0.0294810973468171 |
| 7 | 1.319 | 1.37819003348452 | -0.0591900334845227 |
| 8 | 1.305 | 1.36780118733125 | -0.0628011873312537 |
| 9 | 1.2785 | 1.30737427440556 | -0.0288742744055608 |
| 10 | 1.3239 | 1.32607180270917 | -0.00217180270917455 |
| 11 | 1.3449 | 1.33538741809460 | 0.00951258190540206 |
| 12 | 1.2732 | 1.31610106250929 | -0.0429010625092917 |
| 13 | 1.3322 | 1.34378455157304 | -0.0115845515730356 |
| 14 | 1.4369 | 1.42968922938594 | 0.00721077061405595 |
| 15 | 1.4975 | 1.46540083171705 | 0.0320991682829516 |
| 16 | 1.577 | 1.48536458353494 | 0.0916354164650585 |
| 17 | 1.5553 | 1.47175637308398 | 0.083543626916016 |
| 18 | 1.5557 | 1.47003932954008 | 0.0856606704599218 |
| 19 | 1.575 | 1.45713407845084 | 0.117865921549157 |
| 20 | 1.5527 | 1.43730478962446 | 0.115395210375544 |
| 21 | 1.4748 | 1.41961878382220 | 0.0551812161777969 |
| 22 | 1.4718 | 1.43544832954158 | 0.0363516704584212 |
| 23 | 1.457 | 1.45308906103958 | 0.00391093896041746 |
| 24 | 1.4684 | 1.42810657337725 | 0.0402934266227523 |
| 25 | 1.4227 | 1.42320659363673 | -0.000506593636728716 |
| 26 | 1.3896 | 1.41028537156776 | -0.0206853715677602 |
| 27 | 1.3622 | 1.40138391147738 | -0.0391839114773802 |
| 28 | 1.3716 | 1.43285942672367 | -0.0612594267236742 |
| 29 | 1.3419 | 1.41917155008982 | -0.077271550089821 |
| 30 | 1.3511 | 1.42789077650523 | -0.0767907765052269 |
| 31 | 1.3516 | 1.40785540204684 | -0.0562554020468437 |
| 32 | 1.3242 | 1.38615395792241 | -0.0619539579224124 |
| 33 | 1.3074 | 1.37237159508204 | -0.0649715950820395 |
| 34 | 1.2999 | 1.38123034979806 | -0.081330349798058 |
| 35 | 1.3213 | 1.37254140784910 | -0.0512414078490966 |
| 36 | 1.2881 | 1.33540982729520 | -0.0473098272951967 |
| 37 | 1.2611 | 1.31648859936507 | -0.0553885993650685 |
| 38 | 1.2727 | 1.32137276917325 | -0.0486727691732459 |
| 39 | 1.2811 | 1.31370613491775 | -0.0326061349177464 |
| 40 | 1.2684 | 1.30718088092288 | -0.038780880922883 |
| 41 | 1.265 | 1.29596265595879 | -0.0309626559587909 |
| 42 | 1.277 | 1.30037990849784 | -0.0233799084978392 |
| 43 | 1.2271 | 1.29400728440604 | -0.0669072844060354 |
| 44 | 1.202 | 1.28349893897842 | -0.081498938978423 |
| 45 | 1.1938 | 1.25955913781887 | -0.0657591378188728 |
| 46 | 1.2103 | 1.26873655726647 | -0.0584365572664735 |
| 47 | 1.1856 | 1.27004572127090 | -0.0844457212708983 |
| 48 | 1.1786 | 1.24374874159079 | -0.0651487415907873 |
| 49 | 1.2015 | 1.22450884892908 | -0.0230088489290772 |
| 50 | 1.2256 | 1.22409521757470 | 0.00150478242529683 |
| 51 | 1.2292 | 1.21794224079422 | 0.0112577592057818 |
| 52 | 1.2037 | 1.21380697228622 | -0.0101069722862203 |
| 53 | 1.2165 | 1.19884443672604 | 0.0176555632739608 |
| 54 | 1.2694 | 1.22540888811004 | 0.0439911118899614 |
| 55 | 1.2938 | 1.22931320161176 | 0.0644867983882446 |
| 56 | 1.3201 | 1.22924112614345 | 0.0908588738565454 |
| 57 | 1.3014 | 1.19697620887132 | 0.104423791128676 |
| 58 | 1.3119 | 1.20631296068472 | 0.105587039315285 |
| 59 | 1.3408 | 1.21853639174582 | 0.122263608254175 |
| 60 | 1.2991 | 1.18403379522748 | 0.115066204772523 |
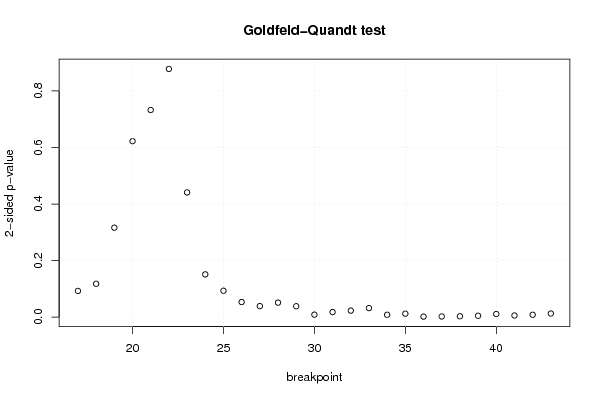
| Goldfeld-Quandt test for Heteroskedasticity | |||
| p-values | Alternative Hypothesis | ||
| breakpoint index | greater | 2-sided | less |
| 17 | 0.0462577247309380 | 0.0925154494618759 | 0.953742275269062 |
| 18 | 0.0589432929326276 | 0.117886585865255 | 0.941056707067372 |
| 19 | 0.158141076586022 | 0.316282153172044 | 0.841858923413978 |
| 20 | 0.311195381102368 | 0.622390762204735 | 0.688804618897632 |
| 21 | 0.366321090259379 | 0.732642180518759 | 0.63367890974062 |
| 22 | 0.561022133657758 | 0.877955732684484 | 0.438977866342242 |
| 23 | 0.779490597153117 | 0.441018805693765 | 0.220509402846883 |
| 24 | 0.9244278699661 | 0.151144260067801 | 0.0755721300339006 |
| 25 | 0.95339126682738 | 0.0932174663452398 | 0.0466087331726199 |
| 26 | 0.973353676376728 | 0.0532926472465446 | 0.0266463236232723 |
| 27 | 0.980536098848033 | 0.0389278023039349 | 0.0194639011519675 |
| 28 | 0.974435881061493 | 0.051128237877014 | 0.025564118938507 |
| 29 | 0.980817309842959 | 0.0383653803140823 | 0.0191826901570411 |
| 30 | 0.995725482996184 | 0.00854903400763244 | 0.00427451700381622 |
| 31 | 0.991130030705296 | 0.0177399385894082 | 0.00886996929470412 |
| 32 | 0.988610148079184 | 0.0227797038416310 | 0.0113898519208155 |
| 33 | 0.984117383938584 | 0.0317652321228326 | 0.0158826160614163 |
| 34 | 0.99588429589016 | 0.00823140821967907 | 0.00411570410983954 |
| 35 | 0.993983135274175 | 0.0120337294516490 | 0.00601686472582448 |
| 36 | 0.999239412377729 | 0.00152117524454288 | 0.000760587622271439 |
| 37 | 0.99891353887708 | 0.00217292224583884 | 0.00108646112291942 |
| 38 | 0.99858218117545 | 0.00283563764909772 | 0.00141781882454886 |
| 39 | 0.99764595975693 | 0.00470808048614025 | 0.00235404024307013 |
| 40 | 0.994570434124123 | 0.0108591317517543 | 0.00542956587587717 |
| 41 | 0.997168956905494 | 0.00566208618901259 | 0.00283104309450629 |
| 42 | 0.995897252939372 | 0.00820549412125556 | 0.00410274706062778 |
| 43 | 0.99372381767437 | 0.0125523646512592 | 0.00627618232562958 |
| Meta Analysis of Goldfeld-Quandt test for Heteroskedasticity | |||
| Description | # significant tests | % significant tests | OK/NOK |
| 1% type I error level | 8 | 0.296296296296296 | NOK |
| 5% type I error level | 16 | 0.592592592592593 | NOK |
| 10% type I error level | 20 | 0.740740740740741 | NOK |