| Multiple Linear Regression - Estimated Regression Equation |
| TotaleIndustrieleProductie[t] = + 9.66386270757074 + 0.297950401733887Investeringsgoederen[t] + 0.479360303731291Consumptiegoederen[t] + 0.57480776596739BrutoInflatie[t] + 3.14166191797486M1[t] -8.44973556391387M2[t] -2.96336432788968M3[t] -0.79174312654727M4[t] -1.03781182965360M5[t] -4.54220727709078M6[t] -1.99582303416013M7[t] -1.49535021102689M8[t] -9.69478239937884M9[t] -0.834699350408226M10[t] + 1.41278369982361M11[t] + 0.0554727893837077t + e[t] |
| Multiple Linear Regression - Ordinary Least Squares | |||||
| Variable | Parameter | S.D. | T-STAT H0: parameter = 0 | 2-tail p-value | 1-tail p-value |
| (Intercept) | 9.66386270757074 | 12.335208 | 0.7834 | 0.437567 | 0.218784 |
| Investeringsgoederen | 0.297950401733887 | 0.045435 | 6.5578 | 0 | 0 |
| Consumptiegoederen | 0.479360303731291 | 0.092236 | 5.1971 | 5e-06 | 3e-06 |
| BrutoInflatie | 0.57480776596739 | 0.99729 | 0.5764 | 0.567302 | 0.283651 |
| M1 | 3.14166191797486 | 1.966625 | 1.5975 | 0.117314 | 0.058657 |
| M2 | -8.44973556391387 | 2.070683 | -4.0807 | 0.000186 | 9.3e-05 |
| M3 | -2.96336432788968 | 1.902854 | -1.5573 | 0.126558 | 0.063279 |
| M4 | -0.79174312654727 | 1.877271 | -0.4218 | 0.675259 | 0.33763 |
| M5 | -1.03781182965360 | 1.815701 | -0.5716 | 0.570518 | 0.285259 |
| M6 | -4.54220727709078 | 1.606294 | -2.8278 | 0.00703 | 0.003515 |
| M7 | -1.99582303416013 | 1.957243 | -1.0197 | 0.31344 | 0.15672 |
| M8 | -1.49535021102689 | 1.819997 | -0.8216 | 0.415722 | 0.207861 |
| M9 | -9.69478239937884 | 1.545148 | -6.2743 | 0 | 0 |
| M10 | -0.834699350408226 | 1.565288 | -0.5333 | 0.59654 | 0.29827 |
| M11 | 1.41278369982361 | 1.516176 | 0.9318 | 0.356521 | 0.178261 |
| t | 0.0554727893837077 | 0.027974 | 1.983 | 0.053628 | 0.026814 |
| Multiple Linear Regression - Regression Statistics | |
| Multiple R | 0.97719137439449 |
| R-squared | 0.954902982190994 |
| Adjusted R-squared | 0.939528998847014 |
| F-TEST (value) | 62.1116181035114 |
| F-TEST (DF numerator) | 15 |
| F-TEST (DF denominator) | 44 |
| p-value | 0 |
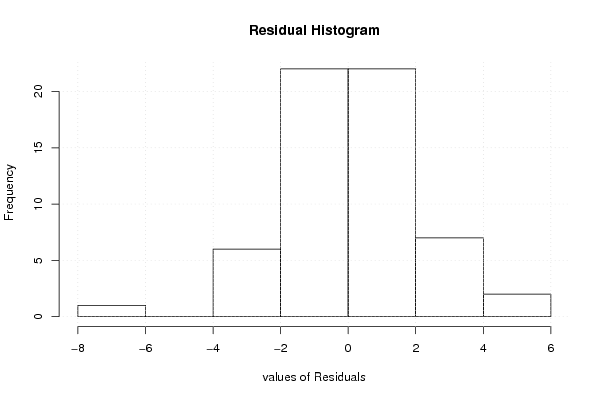
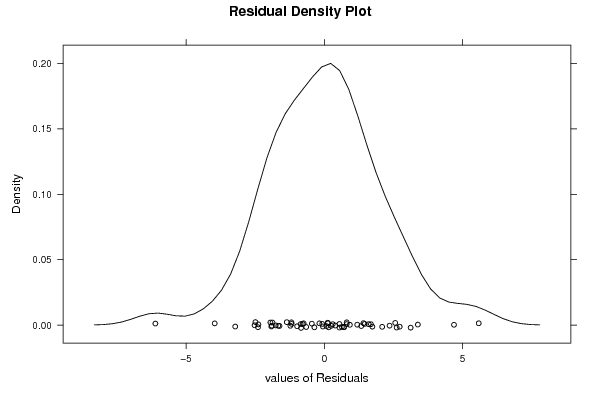
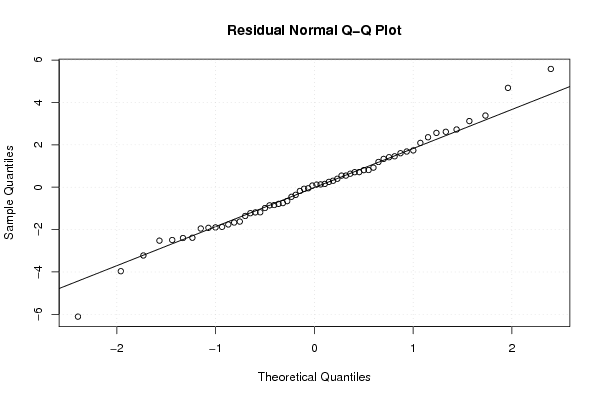
| Multiple Linear Regression - Residual Statistics | |
| Residual Standard Deviation | 2.36700732314936 |
| Sum Squared Residuals | 246.519841385079 |
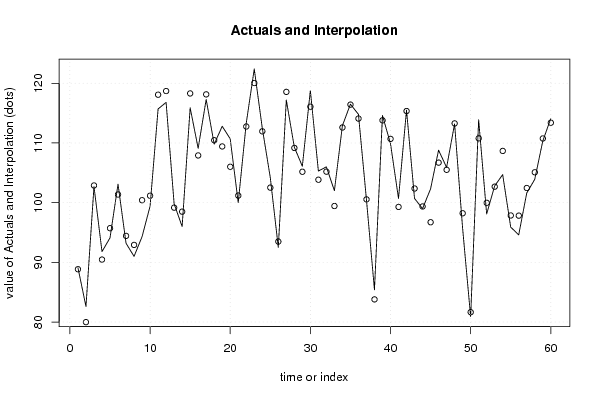
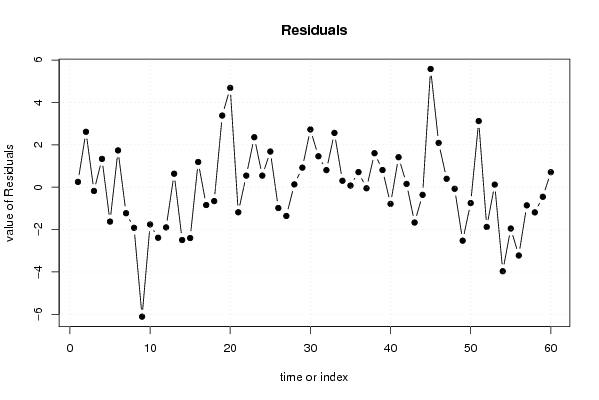
| Multiple Linear Regression - Actuals, Interpolation, and Residuals | |||
| Time or Index | Actuals | Interpolation Forecast | Residuals Prediction Error |
| 1 | 89.1 | 88.8492067381045 | 0.250793261895545 |
| 2 | 82.6 | 79.9837119684375 | 2.61628803156246 |
| 3 | 102.7 | 102.877648195483 | -0.177648195483286 |
| 4 | 91.8 | 90.4636337655886 | 1.33636623441144 |
| 5 | 94.1 | 95.7213769914532 | -1.62137699145319 |
| 6 | 103.1 | 101.362399651611 | 1.73760034838884 |
| 7 | 93.2 | 94.4266899234605 | -1.22668992346050 |
| 8 | 91 | 92.9164435445185 | -1.91644354451853 |
| 9 | 94.3 | 100.40913196471 | -6.10913196470996 |
| 10 | 99.4 | 101.157699344045 | -1.75769934404488 |
| 11 | 115.7 | 118.084159424758 | -2.38415942475831 |
| 12 | 116.8 | 118.697439686174 | -1.89743968617365 |
| 13 | 99.8 | 99.1625699141466 | 0.637430085853382 |
| 14 | 96 | 98.4913190698042 | -2.49131906980418 |
| 15 | 115.9 | 118.298000744458 | -2.39800074445802 |
| 16 | 109.1 | 107.908941515130 | 1.19105848486975 |
| 17 | 117.3 | 118.141538651329 | -0.841538651329209 |
| 18 | 109.8 | 110.455055740905 | -0.655055740904673 |
| 19 | 112.8 | 109.417215724168 | 3.38278427583211 |
| 20 | 110.7 | 106.010580022600 | 4.68941997739988 |
| 21 | 100 | 101.182737567997 | -1.18273756799672 |
| 22 | 113.3 | 112.752385709866 | 0.547614290134157 |
| 23 | 122.4 | 120.040835612185 | 2.35916438781531 |
| 24 | 112.5 | 111.951924222683 | 0.548075777316919 |
| 25 | 104.2 | 102.515625260025 | 1.68437473997492 |
| 26 | 92.5 | 93.4825307588941 | -0.982530758894103 |
| 27 | 117.2 | 118.557361414528 | -1.35736141452783 |
| 28 | 109.3 | 109.167629139259 | 0.132370860740929 |
| 29 | 106.1 | 105.175805240207 | 0.92419475979337 |
| 30 | 118.8 | 116.074854961104 | 2.72514503889555 |
| 31 | 105.3 | 103.840105805655 | 1.45989419434482 |
| 32 | 106 | 105.192033471044 | 0.807966528955923 |
| 33 | 102 | 99.435748989549 | 2.56425101045088 |
| 34 | 112.9 | 112.594980692270 | 0.305019307730453 |
| 35 | 116.5 | 116.42155528433 | 0.0784447156698831 |
| 36 | 114.8 | 114.086593302956 | 0.713406697043607 |
| 37 | 100.5 | 100.550314354885 | -0.0503143548850813 |
| 38 | 85.4 | 83.7945294614565 | 1.60547053854345 |
| 39 | 114.6 | 113.789307516428 | 0.810692483572234 |
| 40 | 109.9 | 110.685763668806 | -0.785763668805665 |
| 41 | 100.7 | 99.284136059494 | 1.41586394050610 |
| 42 | 115.5 | 115.343908737740 | 0.156091262259794 |
| 43 | 100.7 | 102.366439698516 | -1.66643969851565 |
| 44 | 99 | 99.35905268524 | -0.359052685240045 |
| 45 | 102.3 | 96.7170659231868 | 5.58293407681323 |
| 46 | 108.8 | 106.707046578659 | 2.09295342134073 |
| 47 | 105.9 | 105.501351879146 | 0.398648120854041 |
| 48 | 113.2 | 113.27395651761 | -0.0739565176100113 |
| 49 | 95.7 | 98.2222837328388 | -2.52228373283876 |
| 50 | 80.9 | 81.6479087414076 | -0.747908741407636 |
| 51 | 113.9 | 110.777682129103 | 3.12231787089691 |
| 52 | 98.1 | 99.9740319112165 | -1.87403191121646 |
| 53 | 102.8 | 102.677143057517 | 0.122856942482923 |
| 54 | 104.7 | 108.663780908640 | -3.96378090863950 |
| 55 | 95.9 | 97.8495488482008 | -1.94954884820078 |
| 56 | 94.6 | 97.8218902765972 | -3.22189027659723 |
| 57 | 101.6 | 102.455315554557 | -0.855315554557427 |
| 58 | 103.9 | 105.087887675160 | -1.18788767516046 |
| 59 | 110.3 | 110.752097799581 | -0.452097799580933 |
| 60 | 114.1 | 113.390086270577 | 0.709913729423133 |
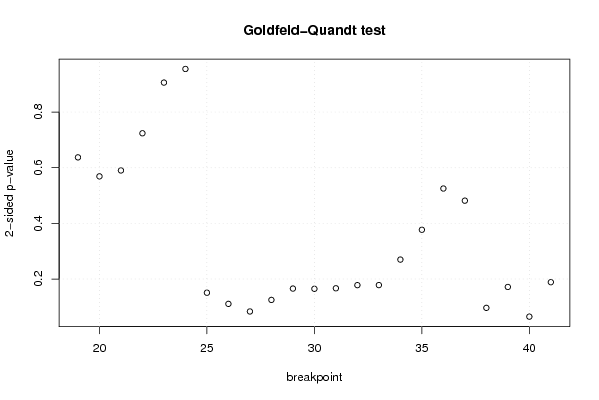
| Goldfeld-Quandt test for Heteroskedasticity | |||
| p-values | Alternative Hypothesis | ||
| breakpoint index | greater | 2-sided | less |
| 19 | 0.681391963538921 | 0.637216072922159 | 0.318608036461079 |
| 20 | 0.715493589703182 | 0.569012820593636 | 0.284506410296818 |
| 21 | 0.704911358682864 | 0.590177282634272 | 0.295088641317136 |
| 22 | 0.638104963872588 | 0.723790072254824 | 0.361895036127412 |
| 23 | 0.547012641980946 | 0.905974716038108 | 0.452987358019054 |
| 24 | 0.522504743653742 | 0.954990512692517 | 0.477495256346258 |
| 25 | 0.92466934021977 | 0.150661319560458 | 0.0753306597802289 |
| 26 | 0.944689691406915 | 0.110620617186169 | 0.0553103085930845 |
| 27 | 0.958345710292512 | 0.0833085794149764 | 0.0416542897074882 |
| 28 | 0.937574702956269 | 0.124850594087462 | 0.0624252970437309 |
| 29 | 0.917196623079453 | 0.165606753841093 | 0.0828033769205466 |
| 30 | 0.917631861765139 | 0.164736276469722 | 0.0823681382348612 |
| 31 | 0.916651711571624 | 0.166696576856753 | 0.0833482884283764 |
| 32 | 0.911073926801163 | 0.177852146397675 | 0.0889260731988373 |
| 33 | 0.910920421163925 | 0.178159157672149 | 0.0890795788360747 |
| 34 | 0.865088958563004 | 0.269822082873993 | 0.134911041436996 |
| 35 | 0.811514918510888 | 0.376970162978225 | 0.188485081489112 |
| 36 | 0.737389675304825 | 0.52522064939035 | 0.262610324695175 |
| 37 | 0.759230155682422 | 0.481539688635156 | 0.240769844317578 |
| 38 | 0.951872286252328 | 0.0962554274953438 | 0.0481277137476719 |
| 39 | 0.914326890367485 | 0.17134621926503 | 0.085673109632515 |
| 40 | 0.96766121071521 | 0.0646775785695804 | 0.0323387892847902 |
| 41 | 0.905732630027026 | 0.188534739945948 | 0.0942673699729742 |
| Meta Analysis of Goldfeld-Quandt test for Heteroskedasticity | |||
| Description | # significant tests | % significant tests | OK/NOK |
| 1% type I error level | 0 | 0 | OK |
| 5% type I error level | 0 | 0 | OK |
| 10% type I error level | 3 | 0.130434782608696 | NOK |