| Multiple Linear Regression - Estimated Regression Equation |
| Y[t] = + 3.099991115504 + 0.544364175491007X[t] + e[t] |
| Multiple Linear Regression - Ordinary Least Squares | |||||
| Variable | Parameter | S.D. | T-STAT H0: parameter = 0 | 2-tail p-value | 1-tail p-value |
| (Intercept) | 3.099991115504 | 0.380236 | 8.1528 | 0 | 0 |
| X | 0.544364175491007 | 0.043235 | 12.5907 | 0 | 0 |
| Multiple Linear Regression - Regression Statistics | |
| Multiple R | 0.853678892468338 |
| R-squared | 0.728767651445969 |
| Adjusted R-squared | 0.7241704929959 |
| F-TEST (value) | 158.525676102188 |
| F-TEST (DF numerator) | 1 |
| F-TEST (DF denominator) | 59 |
| p-value | 0 |
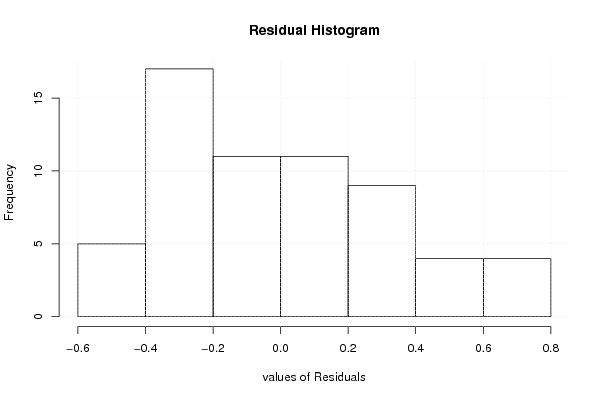
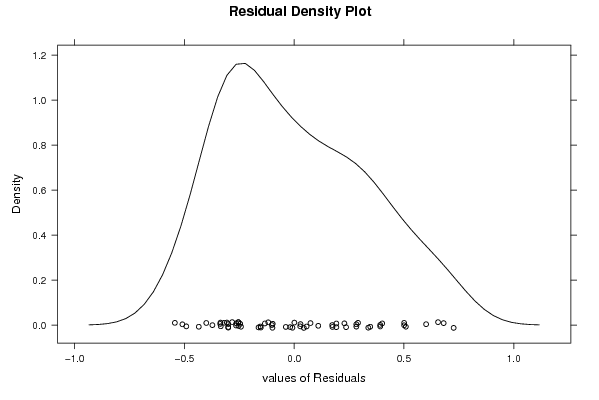
| Multiple Linear Regression - Residual Statistics | |
| Residual Standard Deviation | 0.332225836176954 |
| Sum Squared Residuals | 6.51206636718511 |
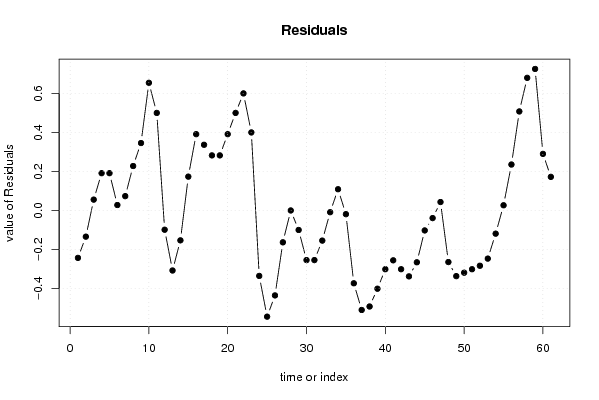
| Multiple Linear Regression - Actuals, Interpolation, and Residuals | |||
| Time or Index | Actuals | Interpolation Forecast | Residuals Prediction Error |
| 1 | 8.9 | 9.14243346345418 | -0.242433463454176 |
| 2 | 8.9 | 9.03356062835598 | -0.133560628355982 |
| 3 | 8.6 | 8.54363287041407 | 0.0563671295859263 |
| 4 | 8.3 | 8.10814153002127 | 0.191858469978734 |
| 5 | 8.3 | 8.10814153002127 | 0.191858469978734 |
| 6 | 8.3 | 8.27145078266857 | 0.0285492173314311 |
| 7 | 8.4 | 8.32588720021767 | 0.0741127997823302 |
| 8 | 8.5 | 8.27145078266857 | 0.228549217331430 |
| 9 | 8.4 | 8.05370511247217 | 0.346294887527834 |
| 10 | 8.6 | 7.94483227737397 | 0.655167722626034 |
| 11 | 8.5 | 7.99926869492307 | 0.500731305076934 |
| 12 | 8.5 | 8.59806928796317 | -0.0980692879631738 |
| 13 | 8.4 | 8.70694212306138 | -0.306942123061375 |
| 14 | 8.5 | 8.65250570551227 | -0.152505705512274 |
| 15 | 8.5 | 8.32588720021767 | 0.17411279978233 |
| 16 | 8.5 | 8.10814153002127 | 0.391858469978733 |
| 17 | 8.5 | 8.16257794757037 | 0.337422052429631 |
| 18 | 8.5 | 8.21701436511947 | 0.282985634880531 |
| 19 | 8.5 | 8.21701436511947 | 0.282985634880531 |
| 20 | 8.5 | 8.10814153002127 | 0.391858469978733 |
| 21 | 8.5 | 7.99926869492307 | 0.500731305076934 |
| 22 | 8.6 | 7.99926869492307 | 0.600731305076934 |
| 23 | 8.4 | 7.99926869492307 | 0.400731305076934 |
| 24 | 8.1 | 8.43476003531587 | -0.334760035315873 |
| 25 | 8 | 8.54363287041407 | -0.543632870414073 |
| 26 | 8 | 8.43476003531587 | -0.434760035315872 |
| 27 | 8 | 8.16257794757037 | -0.162577947570369 |
| 28 | 8 | 7.99926869492307 | 0.000731305076934089 |
| 29 | 7.9 | 7.99926869492307 | -0.0992686949230656 |
| 30 | 7.8 | 8.05370511247217 | -0.253705112472167 |
| 31 | 7.8 | 8.05370511247217 | -0.253705112472167 |
| 32 | 7.9 | 8.05370511247217 | -0.153705112472166 |
| 33 | 8.1 | 8.10814153002127 | -0.00814153002126736 |
| 34 | 8 | 7.89039585982486 | 0.109604140175135 |
| 35 | 7.6 | 7.61821377207936 | -0.0182137720793615 |
| 36 | 7.3 | 7.67265018962846 | -0.372650189628462 |
| 37 | 7 | 7.50934093698116 | -0.509340936981159 |
| 38 | 6.8 | 7.29159526678476 | -0.491595266784757 |
| 39 | 7 | 7.40046810188296 | -0.400468101882958 |
| 40 | 7.1 | 7.40046810188296 | -0.300468101882958 |
| 41 | 7.2 | 7.45490451943206 | -0.254904519432058 |
| 42 | 7.1 | 7.40046810188296 | -0.300468101882958 |
| 43 | 6.9 | 7.23715884923566 | -0.337158849235655 |
| 44 | 6.7 | 6.96497676149015 | -0.264976761490151 |
| 45 | 6.7 | 6.80166750884285 | -0.101667508842850 |
| 46 | 6.6 | 6.63835825619555 | -0.0383582561955479 |
| 47 | 6.9 | 6.85610392639195 | 0.0438960736080499 |
| 48 | 7.3 | 7.56377735453026 | -0.26377735453026 |
| 49 | 7.5 | 7.83595944227576 | -0.335959442275763 |
| 50 | 7.3 | 7.61821377207936 | -0.318213772079361 |
| 51 | 7.1 | 7.40046810188296 | -0.300468101882958 |
| 52 | 6.9 | 7.18272243168655 | -0.282722431686554 |
| 53 | 7.1 | 7.34603168433386 | -0.246031684333857 |
| 54 | 7.5 | 7.61821377207936 | -0.118213772079361 |
| 55 | 7.7 | 7.67265018962846 | 0.0273498103715385 |
| 56 | 7.8 | 7.56377735453026 | 0.23622264546974 |
| 57 | 7.8 | 7.29159526678476 | 0.508404733215243 |
| 58 | 7.7 | 7.01941317903925 | 0.680586820960748 |
| 59 | 7.8 | 7.07384959658835 | 0.726150403411646 |
| 60 | 7.8 | 7.50934093698116 | 0.290659063018841 |
| 61 | 7.9 | 7.72708660717756 | 0.172913392822438 |
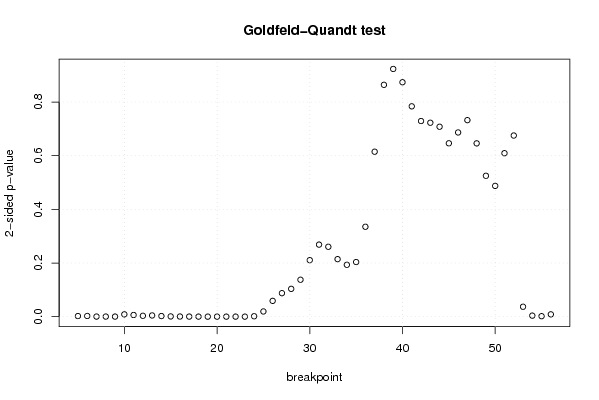
| Goldfeld-Quandt test for Heteroskedasticity | |||
| p-values | Alternative Hypothesis | ||
| breakpoint index | greater | 2-sided | less |
| 5 | 0.00113581722388712 | 0.00227163444777423 | 0.998864182776113 |
| 6 | 0.00127398965471256 | 0.00254797930942513 | 0.998726010345288 |
| 7 | 0.000178645537032669 | 0.000357291074065338 | 0.999821354462967 |
| 8 | 0.000166713909722544 | 0.000333427819445089 | 0.999833286090277 |
| 9 | 0.000133993230828706 | 0.000267986461657412 | 0.999866006769171 |
| 10 | 0.00429735544283069 | 0.00859471088566137 | 0.99570264455717 |
| 11 | 0.00313102414938009 | 0.00626204829876019 | 0.99686897585062 |
| 12 | 0.00162996269393847 | 0.00325992538787693 | 0.998370037306062 |
| 13 | 0.00228198335150269 | 0.00456396670300539 | 0.997718016648497 |
| 14 | 0.00111209263787796 | 0.00222418527575592 | 0.998887907362122 |
| 15 | 0.000445674153359218 | 0.000891348306718436 | 0.99955432584664 |
| 16 | 0.000247553578502042 | 0.000495107157004083 | 0.999752446421498 |
| 17 | 0.00012201913636438 | 0.00024403827272876 | 0.999877980863636 |
| 18 | 5.48303340620725e-05 | 0.000109660668124145 | 0.999945169665938 |
| 19 | 2.50119703961384e-05 | 5.00239407922768e-05 | 0.999974988029604 |
| 20 | 1.53430066422522e-05 | 3.06860132845045e-05 | 0.999984656993358 |
| 21 | 1.48981532684439e-05 | 2.97963065368878e-05 | 0.999985101846732 |
| 22 | 4.80286206037526e-05 | 9.60572412075051e-05 | 0.999951971379396 |
| 23 | 4.57025665403578e-05 | 9.14051330807156e-05 | 0.99995429743346 |
| 24 | 0.000740630070869017 | 0.00148126014173803 | 0.999259369929131 |
| 25 | 0.00969420723793727 | 0.0193884144758745 | 0.990305792762063 |
| 26 | 0.0294328575722987 | 0.0588657151445975 | 0.97056714242770 |
| 27 | 0.0438173536574026 | 0.0876347073148053 | 0.956182646342597 |
| 28 | 0.0518569384045606 | 0.103713876809121 | 0.94814306159544 |
| 29 | 0.0688195552953434 | 0.137639110590687 | 0.931180444704657 |
| 30 | 0.105324830318129 | 0.210649660636258 | 0.894675169681871 |
| 31 | 0.134321800583289 | 0.268643601166578 | 0.86567819941671 |
| 32 | 0.130285405094817 | 0.260570810189633 | 0.869714594905183 |
| 33 | 0.107233603513326 | 0.214467207026653 | 0.892766396486674 |
| 34 | 0.0967008675520962 | 0.193401735104192 | 0.903299132447904 |
| 35 | 0.101848810821931 | 0.203697621643862 | 0.898151189178069 |
| 36 | 0.167595805773268 | 0.335191611546535 | 0.832404194226732 |
| 37 | 0.307516403810907 | 0.615032807621814 | 0.692483596189093 |
| 38 | 0.432187864168415 | 0.86437572833683 | 0.567812135831585 |
| 39 | 0.461780405195224 | 0.923560810390448 | 0.538219594804776 |
| 40 | 0.436979164200397 | 0.873958328400793 | 0.563020835799603 |
| 41 | 0.392122423942691 | 0.784244847885382 | 0.607877576057309 |
| 42 | 0.364668749381315 | 0.72933749876263 | 0.635331250618685 |
| 43 | 0.36152644301761 | 0.72305288603522 | 0.63847355698239 |
| 44 | 0.354054743231733 | 0.708109486463467 | 0.645945256768267 |
| 45 | 0.323167423887878 | 0.646334847775757 | 0.676832576112122 |
| 46 | 0.343409139504988 | 0.686818279009977 | 0.656590860495012 |
| 47 | 0.366313134005784 | 0.732626268011567 | 0.633686865994217 |
| 48 | 0.323058624681501 | 0.646117249363002 | 0.676941375318499 |
| 49 | 0.262594281005242 | 0.525188562010485 | 0.737405718994758 |
| 50 | 0.243775071719186 | 0.487550143438373 | 0.756224928280814 |
| 51 | 0.304712675021597 | 0.609425350043193 | 0.695287324978403 |
| 52 | 0.662295422004347 | 0.675409155991305 | 0.337704577995653 |
| 53 | 0.98150343331585 | 0.0369931333683009 | 0.0184965666841504 |
| 54 | 0.998091869504788 | 0.00381626099042467 | 0.00190813049521233 |
| 55 | 0.999122191116719 | 0.00175561776656174 | 0.000877808883280871 |
| 56 | 0.995666696224416 | 0.00866660755116881 | 0.00433330377558441 |
| Meta Analysis of Goldfeld-Quandt test for Heteroskedasticity | |||
| Description | # significant tests | % significant tests | OK/NOK |
| 1% type I error level | 23 | 0.442307692307692 | NOK |
| 5% type I error level | 25 | 0.480769230769231 | NOK |
| 10% type I error level | 27 | 0.519230769230769 | NOK |