Free Statistics

of Irreproducible Research!

Author's title

Author*The author of this computation has been verified*
R Software Modulerwasp_multipleregression.wasp
Title produced by softwareMultiple Regression
Date of computationFri, 20 Nov 2009 06:11:44 -0700
Cite this page as followsStatistical Computations at FreeStatistics.org, Office for Research Development and Education, URL https://freestatistics.org/blog/index.php?v=date/2009/Nov/20/t1258722772qh4i4lrfcq2sx0v.htm/, Retrieved Fri, 19 Apr 2024 09:35:36 +0000
Statistical Computations at FreeStatistics.org, Office for Research Development and Education, URL https://freestatistics.org/blog/index.php?pk=58117, Retrieved Fri, 19 Apr 2024 09:35:36 +0000
QR Codes:

Original text written by user:
IsPrivate?No (this computation is public)
User-defined keywords
Estimated Impact135
Family? (F = Feedback message, R = changed R code, M = changed R Module, P = changed Parameters, D = changed Data)
-     [Multiple Regression] [Q1 The Seatbeltlaw] [2007-11-14 19:27:43] [8cd6641b921d30ebe00b648d1481bba0]
- RM D  [Multiple Regression] [Seatbelt] [2009-11-12 14:10:54] [b98453cac15ba1066b407e146608df68]
-    D      [Multiple Regression] [Model 4] [2009-11-20 13:11:44] [d79e31a57591875d497c91f296c77132] [Current]
Feedback Forum

Post a new message
Dataseries X:
99.06	152.2	96.92	98.2	98.54	98.71
99.65	169.4	99.06	96.92	98.2	98.54
99.82	168.6	99.65	99.06	96.92	98.2
99.99	161.1	99.82	99.65	99.06	96.92
100.33	174.1	99.99	99.82	99.65	99.06
99.31	179	100.33	99.99	99.82	99.65
101.1	190.6	99.31	100.33	99.99	99.82
101.1	190	101.1	99.31	100.33	99.99
100.93	181.6	101.1	101.1	99.31	100.33
100.85	174.8	100.93	101.1	101.1	99.31
100.93	180.5	100.85	100.93	101.1	101.1
99.6	196.8	100.93	100.85	100.93	101.1
101.88	193.8	99.6	100.93	100.85	100.93
101.81	197	101.88	99.6	100.93	100.85
102.38	216.3	101.81	101.88	99.6	100.93
102.74	221.4	102.38	101.81	101.88	99.6
102.82	217.9	102.74	102.38	101.81	101.88
101.72	229.7	102.82	102.74	102.38	101.81
103.47	227.4	101.72	102.82	102.74	102.38
102.98	204.2	103.47	101.72	102.82	102.74
102.68	196.6	102.98	103.47	101.72	102.82
102.9	198.8	102.68	102.98	103.47	101.72
103.03	207.5	102.9	102.68	102.98	103.47
101.29	190.7	103.03	102.9	102.68	102.98
103.69	201.6	101.29	103.03	102.9	102.68
103.68	210.5	103.69	101.29	103.03	102.9
104.2	223.5	103.68	103.69	101.29	103.03
104.08	223.8	104.2	103.68	103.69	101.29
104.16	231.2	104.08	104.2	103.68	103.69
103.05	244	104.16	104.08	104.2	103.68
104.66	234.7	103.05	104.16	104.08	104.2
104.46	250.2	104.66	103.05	104.16	104.08
104.95	265.7	104.46	104.66	103.05	104.16
105.85	287.6	104.95	104.46	104.66	103.05
106.23	283.3	105.85	104.95	104.46	104.66
104.86	295.4	106.23	105.85	104.95	104.46
107.44	312.3	104.86	106.23	105.85	104.95
108.23	333.8	107.44	104.86	106.23	105.85
108.45	347.7	108.23	107.44	104.86	106.23
109.39	383.2	108.45	108.23	107.44	104.86
110.15	407.1	109.39	108.45	108.23	107.44
109.13	413.6	110.15	109.39	108.45	108.23
110.28	362.7	109.13	110.15	109.39	108.45
110.17	321.9	110.28	109.13	110.15	109.39
109.99	239.4	110.17	110.28	109.13	110.15
109.26	191	109.99	110.17	110.28	109.13
109.11	159.7	109.26	109.99	110.17	110.28
107.06	163.4	109.11	109.26	109.99	110.17
109.53	157.6	107.06	109.11	109.26	109.99
108.92	166.2	109.53	107.06	109.11	109.26
109.24	176.7	108.92	109.53	107.06	109.11
109.12	198.3	109.24	108.92	109.53	107.06
109	226.2	109.12	109.24	108.92	109.53
107.23	216.2	109	109.12	109.24	108.92
109.49	235.9	107.23	109	109.12	109.24
109.04	226.9	109.49	107.23	109	109.12


Summary of computational transaction
Raw Inputview raw input (R code)
Raw Outputview raw output of R engine
Computing time6 seconds
R Server'Gwilym Jenkins' @ 72.249.127.135

\begin{tabular}{lllllllll}
\hline
Summary of computational transaction \tabularnewline
Raw Input & view raw input (R code)  \tabularnewline
Raw Output & view raw output of R engine  \tabularnewline
Computing time & 6 seconds \tabularnewline
R Server & 'Gwilym Jenkins' @ 72.249.127.135 \tabularnewline
\hline
\end{tabular}
%Source: https://freestatistics.org/blog/index.php?pk=58117&T=0

[TABLE]
[ROW][C]Summary of computational transaction[/C][/ROW]
[ROW][C]Raw Input[/C][C]view raw input (R code) [/C][/ROW]
[ROW][C]Raw Output[/C][C]view raw output of R engine [/C][/ROW]
[ROW][C]Computing time[/C][C]6 seconds[/C][/ROW]
[ROW][C]R Server[/C][C]'Gwilym Jenkins' @ 72.249.127.135[/C][/ROW]
[/TABLE]
Source: https://freestatistics.org/blog/index.php?pk=58117&T=0

Globally Unique Identifier (entire table): ba.freestatistics.org/blog/index.php?pk=58117&T=0

As an alternative you can also use a QR Code:  

The GUIDs for individual cells are displayed in the table below:

Summary of computational transaction
Raw Inputview raw input (R code)
Raw Outputview raw output of R engine
Computing time6 seconds
R Server'Gwilym Jenkins' @ 72.249.127.135


Multiple Linear Regression - Estimated Regression Equation
Y[t] = + 12.0075106155311 + 0.00706906994709151X[t] + 0.492628156335883Y1[t] + 0.141018411173Y2[t] + 0.00778650777325245Y3[t] + 0.210384272455964Y4[t] + 3.10696889836303M1[t] + 2.18939852178247M2[t] + 2.06031177005909M3[t] + 2.32501060991481M4[t] + 1.76821492983135M5[t] + 0.33342314126969M6[t] + 2.55766571757778M7[t] + 1.64749851532543M8[t] + 1.54105844819217M9[t] + 1.91751211161407M10[t] + 1.68745560545471M11[t] + 0.0151867036463499t + e[t]

\begin{tabular}{lllllllll}
\hline
Multiple Linear Regression - Estimated Regression Equation \tabularnewline
Y[t] =  +  12.0075106155311 +  0.00706906994709151X[t] +  0.492628156335883Y1[t] +  0.141018411173Y2[t] +  0.00778650777325245Y3[t] +  0.210384272455964Y4[t] +  3.10696889836303M1[t] +  2.18939852178247M2[t] +  2.06031177005909M3[t] +  2.32501060991481M4[t] +  1.76821492983135M5[t] +  0.33342314126969M6[t] +  2.55766571757778M7[t] +  1.64749851532543M8[t] +  1.54105844819217M9[t] +  1.91751211161407M10[t] +  1.68745560545471M11[t] +  0.0151867036463499t  + e[t] \tabularnewline
\hline
\end{tabular}
%Source: https://freestatistics.org/blog/index.php?pk=58117&T=1

[TABLE]
[ROW][C]Multiple Linear Regression - Estimated Regression Equation[/C][/ROW]
[ROW][C]Y[t] =  +  12.0075106155311 +  0.00706906994709151X[t] +  0.492628156335883Y1[t] +  0.141018411173Y2[t] +  0.00778650777325245Y3[t] +  0.210384272455964Y4[t] +  3.10696889836303M1[t] +  2.18939852178247M2[t] +  2.06031177005909M3[t] +  2.32501060991481M4[t] +  1.76821492983135M5[t] +  0.33342314126969M6[t] +  2.55766571757778M7[t] +  1.64749851532543M8[t] +  1.54105844819217M9[t] +  1.91751211161407M10[t] +  1.68745560545471M11[t] +  0.0151867036463499t  + e[t][/C][/ROW]
[/TABLE]
Source: https://freestatistics.org/blog/index.php?pk=58117&T=1

Globally Unique Identifier (entire table): ba.freestatistics.org/blog/index.php?pk=58117&T=1

As an alternative you can also use a QR Code:  

The GUIDs for individual cells are displayed in the table below:

Multiple Linear Regression - Estimated Regression Equation
Y[t] = + 12.0075106155311 + 0.00706906994709151X[t] + 0.492628156335883Y1[t] + 0.141018411173Y2[t] + 0.00778650777325245Y3[t] + 0.210384272455964Y4[t] + 3.10696889836303M1[t] + 2.18939852178247M2[t] + 2.06031177005909M3[t] + 2.32501060991481M4[t] + 1.76821492983135M5[t] + 0.33342314126969M6[t] + 2.55766571757778M7[t] + 1.64749851532543M8[t] + 1.54105844819217M9[t] + 1.91751211161407M10[t] + 1.68745560545471M11[t] + 0.0151867036463499t + e[t]


Multiple Linear Regression - Ordinary Least Squares
VariableParameterS.D.T-STATH0: parameter = 02-tail p-value1-tail p-value
(Intercept)12.00751061553114.4582372.69330.0104690.005234
X0.007069069947091510.0012775.53512e-061e-06
Y10.4926281563358830.1472333.34590.0018560.000928
Y20.1410184111730.1689180.83480.4090290.204514
Y30.007786507773252450.1831950.04250.966320.48316
Y40.2103842724559640.1515341.38840.1731130.086557
M13.106968898363030.3093310.044200
M22.189398521782470.3757575.82661e-060
M32.060311770059090.4016015.13029e-064e-06
M42.325010609914810.3948895.88781e-060
M51.768214929831350.1829919.662800
M60.333423141269690.1855961.79650.0803680.040184
M72.557665717577780.2743989.32100
M81.647498515325430.303225.43333e-062e-06
M91.541058448192170.2995735.14428e-064e-06
M101.917512111614070.2966056.464900
M111.687455605454710.1929418.74600
t0.01518670364634990.0103311.470.1497880.074894

\begin{tabular}{lllllllll}
\hline
Multiple Linear Regression - Ordinary Least Squares \tabularnewline
Variable & Parameter & S.D. & T-STATH0: parameter = 0 & 2-tail p-value & 1-tail p-value \tabularnewline
(Intercept) & 12.0075106155311 & 4.458237 & 2.6933 & 0.010469 & 0.005234 \tabularnewline
X & 0.00706906994709151 & 0.001277 & 5.5351 & 2e-06 & 1e-06 \tabularnewline
Y1 & 0.492628156335883 & 0.147233 & 3.3459 & 0.001856 & 0.000928 \tabularnewline
Y2 & 0.141018411173 & 0.168918 & 0.8348 & 0.409029 & 0.204514 \tabularnewline
Y3 & 0.00778650777325245 & 0.183195 & 0.0425 & 0.96632 & 0.48316 \tabularnewline
Y4 & 0.210384272455964 & 0.151534 & 1.3884 & 0.173113 & 0.086557 \tabularnewline
M1 & 3.10696889836303 & 0.30933 & 10.0442 & 0 & 0 \tabularnewline
M2 & 2.18939852178247 & 0.375757 & 5.8266 & 1e-06 & 0 \tabularnewline
M3 & 2.06031177005909 & 0.401601 & 5.1302 & 9e-06 & 4e-06 \tabularnewline
M4 & 2.32501060991481 & 0.394889 & 5.8878 & 1e-06 & 0 \tabularnewline
M5 & 1.76821492983135 & 0.182991 & 9.6628 & 0 & 0 \tabularnewline
M6 & 0.33342314126969 & 0.185596 & 1.7965 & 0.080368 & 0.040184 \tabularnewline
M7 & 2.55766571757778 & 0.274398 & 9.321 & 0 & 0 \tabularnewline
M8 & 1.64749851532543 & 0.30322 & 5.4333 & 3e-06 & 2e-06 \tabularnewline
M9 & 1.54105844819217 & 0.299573 & 5.1442 & 8e-06 & 4e-06 \tabularnewline
M10 & 1.91751211161407 & 0.296605 & 6.4649 & 0 & 0 \tabularnewline
M11 & 1.68745560545471 & 0.192941 & 8.746 & 0 & 0 \tabularnewline
t & 0.0151867036463499 & 0.010331 & 1.47 & 0.149788 & 0.074894 \tabularnewline
\hline
\end{tabular}
%Source: https://freestatistics.org/blog/index.php?pk=58117&T=2

[TABLE]
[ROW][C]Multiple Linear Regression - Ordinary Least Squares[/C][/ROW]
[ROW][C]Variable[/C][C]Parameter[/C][C]S.D.[/C][C]T-STATH0: parameter = 0[/C][C]2-tail p-value[/C][C]1-tail p-value[/C][/ROW]
[ROW][C](Intercept)[/C][C]12.0075106155311[/C][C]4.458237[/C][C]2.6933[/C][C]0.010469[/C][C]0.005234[/C][/ROW]
[ROW][C]X[/C][C]0.00706906994709151[/C][C]0.001277[/C][C]5.5351[/C][C]2e-06[/C][C]1e-06[/C][/ROW]
[ROW][C]Y1[/C][C]0.492628156335883[/C][C]0.147233[/C][C]3.3459[/C][C]0.001856[/C][C]0.000928[/C][/ROW]
[ROW][C]Y2[/C][C]0.141018411173[/C][C]0.168918[/C][C]0.8348[/C][C]0.409029[/C][C]0.204514[/C][/ROW]
[ROW][C]Y3[/C][C]0.00778650777325245[/C][C]0.183195[/C][C]0.0425[/C][C]0.96632[/C][C]0.48316[/C][/ROW]
[ROW][C]Y4[/C][C]0.210384272455964[/C][C]0.151534[/C][C]1.3884[/C][C]0.173113[/C][C]0.086557[/C][/ROW]
[ROW][C]M1[/C][C]3.10696889836303[/C][C]0.30933[/C][C]10.0442[/C][C]0[/C][C]0[/C][/ROW]
[ROW][C]M2[/C][C]2.18939852178247[/C][C]0.375757[/C][C]5.8266[/C][C]1e-06[/C][C]0[/C][/ROW]
[ROW][C]M3[/C][C]2.06031177005909[/C][C]0.401601[/C][C]5.1302[/C][C]9e-06[/C][C]4e-06[/C][/ROW]
[ROW][C]M4[/C][C]2.32501060991481[/C][C]0.394889[/C][C]5.8878[/C][C]1e-06[/C][C]0[/C][/ROW]
[ROW][C]M5[/C][C]1.76821492983135[/C][C]0.182991[/C][C]9.6628[/C][C]0[/C][C]0[/C][/ROW]
[ROW][C]M6[/C][C]0.33342314126969[/C][C]0.185596[/C][C]1.7965[/C][C]0.080368[/C][C]0.040184[/C][/ROW]
[ROW][C]M7[/C][C]2.55766571757778[/C][C]0.274398[/C][C]9.321[/C][C]0[/C][C]0[/C][/ROW]
[ROW][C]M8[/C][C]1.64749851532543[/C][C]0.30322[/C][C]5.4333[/C][C]3e-06[/C][C]2e-06[/C][/ROW]
[ROW][C]M9[/C][C]1.54105844819217[/C][C]0.299573[/C][C]5.1442[/C][C]8e-06[/C][C]4e-06[/C][/ROW]
[ROW][C]M10[/C][C]1.91751211161407[/C][C]0.296605[/C][C]6.4649[/C][C]0[/C][C]0[/C][/ROW]
[ROW][C]M11[/C][C]1.68745560545471[/C][C]0.192941[/C][C]8.746[/C][C]0[/C][C]0[/C][/ROW]
[ROW][C]t[/C][C]0.0151867036463499[/C][C]0.010331[/C][C]1.47[/C][C]0.149788[/C][C]0.074894[/C][/ROW]
[/TABLE]
Source: https://freestatistics.org/blog/index.php?pk=58117&T=2

Globally Unique Identifier (entire table): ba.freestatistics.org/blog/index.php?pk=58117&T=2

As an alternative you can also use a QR Code:  

The GUIDs for individual cells are displayed in the table below:

Multiple Linear Regression - Ordinary Least Squares
VariableParameterS.D.T-STATH0: parameter = 02-tail p-value1-tail p-value
(Intercept)12.00751061553114.4582372.69330.0104690.005234
X0.007069069947091510.0012775.53512e-061e-06
Y10.4926281563358830.1472333.34590.0018560.000928
Y20.1410184111730.1689180.83480.4090290.204514
Y30.007786507773252450.1831950.04250.966320.48316
Y40.2103842724559640.1515341.38840.1731130.086557
M13.106968898363030.3093310.044200
M22.189398521782470.3757575.82661e-060
M32.060311770059090.4016015.13029e-064e-06
M42.325010609914810.3948895.88781e-060
M51.768214929831350.1829919.662800
M60.333423141269690.1855961.79650.0803680.040184
M72.557665717577780.2743989.32100
M81.647498515325430.303225.43333e-062e-06
M91.541058448192170.2995735.14428e-064e-06
M101.917512111614070.2966056.464900
M111.687455605454710.1929418.74600
t0.01518670364634990.0103311.470.1497880.074894


Multiple Linear Regression - Regression Statistics
Multiple R0.998073681717132
R-squared0.99615107413639
Adjusted R-squared0.99442918625004
F-TEST (value)578.522609998258
F-TEST (DF numerator)17
F-TEST (DF denominator)38
p-value0
Multiple Linear Regression - Residual Statistics
Residual Standard Deviation0.267843432610432
Sum Squared Residuals2.72612396691648

\begin{tabular}{lllllllll}
\hline
Multiple Linear Regression - Regression Statistics \tabularnewline
Multiple R & 0.998073681717132 \tabularnewline
R-squared & 0.99615107413639 \tabularnewline
Adjusted R-squared & 0.99442918625004 \tabularnewline
F-TEST (value) & 578.522609998258 \tabularnewline
F-TEST (DF numerator) & 17 \tabularnewline
F-TEST (DF denominator) & 38 \tabularnewline
p-value & 0 \tabularnewline
Multiple Linear Regression - Residual Statistics \tabularnewline
Residual Standard Deviation & 0.267843432610432 \tabularnewline
Sum Squared Residuals & 2.72612396691648 \tabularnewline
\hline
\end{tabular}
%Source: https://freestatistics.org/blog/index.php?pk=58117&T=3

[TABLE]
[ROW][C]Multiple Linear Regression - Regression Statistics[/C][/ROW]
[ROW][C]Multiple R[/C][C]0.998073681717132[/C][/ROW]
[ROW][C]R-squared[/C][C]0.99615107413639[/C][/ROW]
[ROW][C]Adjusted R-squared[/C][C]0.99442918625004[/C][/ROW]
[ROW][C]F-TEST (value)[/C][C]578.522609998258[/C][/ROW]
[ROW][C]F-TEST (DF numerator)[/C][C]17[/C][/ROW]
[ROW][C]F-TEST (DF denominator)[/C][C]38[/C][/ROW]
[ROW][C]p-value[/C][C]0[/C][/ROW]
[ROW][C]Multiple Linear Regression - Residual Statistics[/C][/ROW]
[ROW][C]Residual Standard Deviation[/C][C]0.267843432610432[/C][/ROW]
[ROW][C]Sum Squared Residuals[/C][C]2.72612396691648[/C][/ROW]
[/TABLE]
Source: https://freestatistics.org/blog/index.php?pk=58117&T=3

Globally Unique Identifier (entire table): ba.freestatistics.org/blog/index.php?pk=58117&T=3

As an alternative you can also use a QR Code:  

The GUIDs for individual cells are displayed in the table below:

Multiple Linear Regression - Regression Statistics
Multiple R0.998073681717132
R-squared0.99615107413639
Adjusted R-squared0.99442918625004
F-TEST (value)578.522609998258
F-TEST (DF numerator)17
F-TEST (DF denominator)38
p-value0
Multiple Linear Regression - Residual Statistics
Residual Standard Deviation0.267843432610432
Sum Squared Residuals2.72612396691648


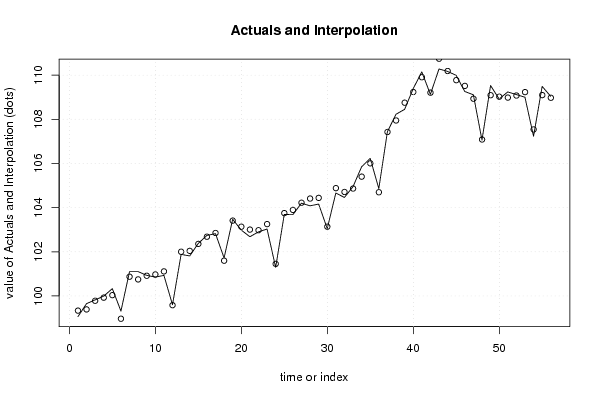
Multiple Linear Regression - Actuals, Interpolation, and Residuals
Time or IndexActualsInterpolationForecastResidualsPrediction Error
199.0699.3334215628548-0.273421562854746
299.6599.38793384230740.262066157692614
399.8299.77931116783630.0406888321636927
499.9999.92049759379550.069502406204525
5100.33100.0333228257890.296677174210958
699.3198.96527331373860.344726686261437
7101.1100.8692583780540.230741621945542
8101.1100.7464147968850.353585203114607
9100.93100.9117926165490.0182073834511236
10100.85100.970962412409-0.120962412408868
11100.93101.109590773884-0.179590773884153
1299.699.5793527855050.0206472144950217
13101.88101.999998955701-0.119998955700819
14101.81102.039666195008-0.229666195008403
15102.38102.3557118898990.0242881101007720
16102.74102.6805186058170.0594813941826108
17102.82102.851025600870-0.031025600870458
18101.72101.5947238322190.125276167781191
19103.47103.4100069303180.0599930696824191
20102.98103.134364288943-0.154364288942553
21102.68103.003046000052-0.323046000051811
22102.9102.975554541530-0.0755545415297692
23103.03103.252615406587-0.222615406587493
24101.29101.451227594614-0.161227594614316
25103.69103.750193210448-0.0601932104483822
26103.68103.894956585759-0.214956585759212
27104.2104.22027378414-0.0202737841400317
28104.08104.409655490392-0.329655490391595
29104.16104.439416215429-0.279416215429192
30103.05103.134728410320-0.0847284103202966
31104.66104.881344999872-0.221344999872108
32104.46104.707912788672-0.247912788671913
33104.95104.8629317382540.0870682617455716
34105.85105.4015785866230.4484214133772
35106.23106.0059375226140.224062477386205
36104.86104.6950581709460.164941829053714
37107.44107.4254636276260.0145363723735566
38108.23107.9451550967580.284844903241532
39108.45108.751797373162-0.301797373161609
40109.39109.2342803757960.155719624203682
41110.15109.9046594525860.245340547414266
42109.13109.205874634595-0.0758746345947503
43110.28110.743785384518-0.463785384518273
44110.17110.186749394477-0.0167493944770209
45109.99109.7722296451450.217770354855116
46109.26109.511904459439-0.251904459438562
47109.11108.9318562969150.17814370308544
48107.06107.084361448934-0.02436144893442
49109.53109.0909226433700.439077356630390
50108.92109.022288280167-0.102288280166531
51109.24108.9829057849630.257094215037176
52109.12109.0750479341990.0449520658007774
53109109.231575905326-0.231575905325573
54107.23107.539399809128-0.309399809127581
55109.49109.0956043072380.39439569276242
56109.04108.9745587310230.0654412689768803

\begin{tabular}{lllllllll}
\hline
Multiple Linear Regression - Actuals, Interpolation, and Residuals \tabularnewline
Time or Index & Actuals & InterpolationForecast & ResidualsPrediction Error \tabularnewline
1 & 99.06 & 99.3334215628548 & -0.273421562854746 \tabularnewline
2 & 99.65 & 99.3879338423074 & 0.262066157692614 \tabularnewline
3 & 99.82 & 99.7793111678363 & 0.0406888321636927 \tabularnewline
4 & 99.99 & 99.9204975937955 & 0.069502406204525 \tabularnewline
5 & 100.33 & 100.033322825789 & 0.296677174210958 \tabularnewline
6 & 99.31 & 98.9652733137386 & 0.344726686261437 \tabularnewline
7 & 101.1 & 100.869258378054 & 0.230741621945542 \tabularnewline
8 & 101.1 & 100.746414796885 & 0.353585203114607 \tabularnewline
9 & 100.93 & 100.911792616549 & 0.0182073834511236 \tabularnewline
10 & 100.85 & 100.970962412409 & -0.120962412408868 \tabularnewline
11 & 100.93 & 101.109590773884 & -0.179590773884153 \tabularnewline
12 & 99.6 & 99.579352785505 & 0.0206472144950217 \tabularnewline
13 & 101.88 & 101.999998955701 & -0.119998955700819 \tabularnewline
14 & 101.81 & 102.039666195008 & -0.229666195008403 \tabularnewline
15 & 102.38 & 102.355711889899 & 0.0242881101007720 \tabularnewline
16 & 102.74 & 102.680518605817 & 0.0594813941826108 \tabularnewline
17 & 102.82 & 102.851025600870 & -0.031025600870458 \tabularnewline
18 & 101.72 & 101.594723832219 & 0.125276167781191 \tabularnewline
19 & 103.47 & 103.410006930318 & 0.0599930696824191 \tabularnewline
20 & 102.98 & 103.134364288943 & -0.154364288942553 \tabularnewline
21 & 102.68 & 103.003046000052 & -0.323046000051811 \tabularnewline
22 & 102.9 & 102.975554541530 & -0.0755545415297692 \tabularnewline
23 & 103.03 & 103.252615406587 & -0.222615406587493 \tabularnewline
24 & 101.29 & 101.451227594614 & -0.161227594614316 \tabularnewline
25 & 103.69 & 103.750193210448 & -0.0601932104483822 \tabularnewline
26 & 103.68 & 103.894956585759 & -0.214956585759212 \tabularnewline
27 & 104.2 & 104.22027378414 & -0.0202737841400317 \tabularnewline
28 & 104.08 & 104.409655490392 & -0.329655490391595 \tabularnewline
29 & 104.16 & 104.439416215429 & -0.279416215429192 \tabularnewline
30 & 103.05 & 103.134728410320 & -0.0847284103202966 \tabularnewline
31 & 104.66 & 104.881344999872 & -0.221344999872108 \tabularnewline
32 & 104.46 & 104.707912788672 & -0.247912788671913 \tabularnewline
33 & 104.95 & 104.862931738254 & 0.0870682617455716 \tabularnewline
34 & 105.85 & 105.401578586623 & 0.4484214133772 \tabularnewline
35 & 106.23 & 106.005937522614 & 0.224062477386205 \tabularnewline
36 & 104.86 & 104.695058170946 & 0.164941829053714 \tabularnewline
37 & 107.44 & 107.425463627626 & 0.0145363723735566 \tabularnewline
38 & 108.23 & 107.945155096758 & 0.284844903241532 \tabularnewline
39 & 108.45 & 108.751797373162 & -0.301797373161609 \tabularnewline
40 & 109.39 & 109.234280375796 & 0.155719624203682 \tabularnewline
41 & 110.15 & 109.904659452586 & 0.245340547414266 \tabularnewline
42 & 109.13 & 109.205874634595 & -0.0758746345947503 \tabularnewline
43 & 110.28 & 110.743785384518 & -0.463785384518273 \tabularnewline
44 & 110.17 & 110.186749394477 & -0.0167493944770209 \tabularnewline
45 & 109.99 & 109.772229645145 & 0.217770354855116 \tabularnewline
46 & 109.26 & 109.511904459439 & -0.251904459438562 \tabularnewline
47 & 109.11 & 108.931856296915 & 0.17814370308544 \tabularnewline
48 & 107.06 & 107.084361448934 & -0.02436144893442 \tabularnewline
49 & 109.53 & 109.090922643370 & 0.439077356630390 \tabularnewline
50 & 108.92 & 109.022288280167 & -0.102288280166531 \tabularnewline
51 & 109.24 & 108.982905784963 & 0.257094215037176 \tabularnewline
52 & 109.12 & 109.075047934199 & 0.0449520658007774 \tabularnewline
53 & 109 & 109.231575905326 & -0.231575905325573 \tabularnewline
54 & 107.23 & 107.539399809128 & -0.309399809127581 \tabularnewline
55 & 109.49 & 109.095604307238 & 0.39439569276242 \tabularnewline
56 & 109.04 & 108.974558731023 & 0.0654412689768803 \tabularnewline
\hline
\end{tabular}
%Source: https://freestatistics.org/blog/index.php?pk=58117&T=4

[TABLE]
[ROW][C]Multiple Linear Regression - Actuals, Interpolation, and Residuals[/C][/ROW]
[ROW][C]Time or Index[/C][C]Actuals[/C][C]InterpolationForecast[/C][C]ResidualsPrediction Error[/C][/ROW]
[ROW][C]1[/C][C]99.06[/C][C]99.3334215628548[/C][C]-0.273421562854746[/C][/ROW]
[ROW][C]2[/C][C]99.65[/C][C]99.3879338423074[/C][C]0.262066157692614[/C][/ROW]
[ROW][C]3[/C][C]99.82[/C][C]99.7793111678363[/C][C]0.0406888321636927[/C][/ROW]
[ROW][C]4[/C][C]99.99[/C][C]99.9204975937955[/C][C]0.069502406204525[/C][/ROW]
[ROW][C]5[/C][C]100.33[/C][C]100.033322825789[/C][C]0.296677174210958[/C][/ROW]
[ROW][C]6[/C][C]99.31[/C][C]98.9652733137386[/C][C]0.344726686261437[/C][/ROW]
[ROW][C]7[/C][C]101.1[/C][C]100.869258378054[/C][C]0.230741621945542[/C][/ROW]
[ROW][C]8[/C][C]101.1[/C][C]100.746414796885[/C][C]0.353585203114607[/C][/ROW]
[ROW][C]9[/C][C]100.93[/C][C]100.911792616549[/C][C]0.0182073834511236[/C][/ROW]
[ROW][C]10[/C][C]100.85[/C][C]100.970962412409[/C][C]-0.120962412408868[/C][/ROW]
[ROW][C]11[/C][C]100.93[/C][C]101.109590773884[/C][C]-0.179590773884153[/C][/ROW]
[ROW][C]12[/C][C]99.6[/C][C]99.579352785505[/C][C]0.0206472144950217[/C][/ROW]
[ROW][C]13[/C][C]101.88[/C][C]101.999998955701[/C][C]-0.119998955700819[/C][/ROW]
[ROW][C]14[/C][C]101.81[/C][C]102.039666195008[/C][C]-0.229666195008403[/C][/ROW]
[ROW][C]15[/C][C]102.38[/C][C]102.355711889899[/C][C]0.0242881101007720[/C][/ROW]
[ROW][C]16[/C][C]102.74[/C][C]102.680518605817[/C][C]0.0594813941826108[/C][/ROW]
[ROW][C]17[/C][C]102.82[/C][C]102.851025600870[/C][C]-0.031025600870458[/C][/ROW]
[ROW][C]18[/C][C]101.72[/C][C]101.594723832219[/C][C]0.125276167781191[/C][/ROW]
[ROW][C]19[/C][C]103.47[/C][C]103.410006930318[/C][C]0.0599930696824191[/C][/ROW]
[ROW][C]20[/C][C]102.98[/C][C]103.134364288943[/C][C]-0.154364288942553[/C][/ROW]
[ROW][C]21[/C][C]102.68[/C][C]103.003046000052[/C][C]-0.323046000051811[/C][/ROW]
[ROW][C]22[/C][C]102.9[/C][C]102.975554541530[/C][C]-0.0755545415297692[/C][/ROW]
[ROW][C]23[/C][C]103.03[/C][C]103.252615406587[/C][C]-0.222615406587493[/C][/ROW]
[ROW][C]24[/C][C]101.29[/C][C]101.451227594614[/C][C]-0.161227594614316[/C][/ROW]
[ROW][C]25[/C][C]103.69[/C][C]103.750193210448[/C][C]-0.0601932104483822[/C][/ROW]
[ROW][C]26[/C][C]103.68[/C][C]103.894956585759[/C][C]-0.214956585759212[/C][/ROW]
[ROW][C]27[/C][C]104.2[/C][C]104.22027378414[/C][C]-0.0202737841400317[/C][/ROW]
[ROW][C]28[/C][C]104.08[/C][C]104.409655490392[/C][C]-0.329655490391595[/C][/ROW]
[ROW][C]29[/C][C]104.16[/C][C]104.439416215429[/C][C]-0.279416215429192[/C][/ROW]
[ROW][C]30[/C][C]103.05[/C][C]103.134728410320[/C][C]-0.0847284103202966[/C][/ROW]
[ROW][C]31[/C][C]104.66[/C][C]104.881344999872[/C][C]-0.221344999872108[/C][/ROW]
[ROW][C]32[/C][C]104.46[/C][C]104.707912788672[/C][C]-0.247912788671913[/C][/ROW]
[ROW][C]33[/C][C]104.95[/C][C]104.862931738254[/C][C]0.0870682617455716[/C][/ROW]
[ROW][C]34[/C][C]105.85[/C][C]105.401578586623[/C][C]0.4484214133772[/C][/ROW]
[ROW][C]35[/C][C]106.23[/C][C]106.005937522614[/C][C]0.224062477386205[/C][/ROW]
[ROW][C]36[/C][C]104.86[/C][C]104.695058170946[/C][C]0.164941829053714[/C][/ROW]
[ROW][C]37[/C][C]107.44[/C][C]107.425463627626[/C][C]0.0145363723735566[/C][/ROW]
[ROW][C]38[/C][C]108.23[/C][C]107.945155096758[/C][C]0.284844903241532[/C][/ROW]
[ROW][C]39[/C][C]108.45[/C][C]108.751797373162[/C][C]-0.301797373161609[/C][/ROW]
[ROW][C]40[/C][C]109.39[/C][C]109.234280375796[/C][C]0.155719624203682[/C][/ROW]
[ROW][C]41[/C][C]110.15[/C][C]109.904659452586[/C][C]0.245340547414266[/C][/ROW]
[ROW][C]42[/C][C]109.13[/C][C]109.205874634595[/C][C]-0.0758746345947503[/C][/ROW]
[ROW][C]43[/C][C]110.28[/C][C]110.743785384518[/C][C]-0.463785384518273[/C][/ROW]
[ROW][C]44[/C][C]110.17[/C][C]110.186749394477[/C][C]-0.0167493944770209[/C][/ROW]
[ROW][C]45[/C][C]109.99[/C][C]109.772229645145[/C][C]0.217770354855116[/C][/ROW]
[ROW][C]46[/C][C]109.26[/C][C]109.511904459439[/C][C]-0.251904459438562[/C][/ROW]
[ROW][C]47[/C][C]109.11[/C][C]108.931856296915[/C][C]0.17814370308544[/C][/ROW]
[ROW][C]48[/C][C]107.06[/C][C]107.084361448934[/C][C]-0.02436144893442[/C][/ROW]
[ROW][C]49[/C][C]109.53[/C][C]109.090922643370[/C][C]0.439077356630390[/C][/ROW]
[ROW][C]50[/C][C]108.92[/C][C]109.022288280167[/C][C]-0.102288280166531[/C][/ROW]
[ROW][C]51[/C][C]109.24[/C][C]108.982905784963[/C][C]0.257094215037176[/C][/ROW]
[ROW][C]52[/C][C]109.12[/C][C]109.075047934199[/C][C]0.0449520658007774[/C][/ROW]
[ROW][C]53[/C][C]109[/C][C]109.231575905326[/C][C]-0.231575905325573[/C][/ROW]
[ROW][C]54[/C][C]107.23[/C][C]107.539399809128[/C][C]-0.309399809127581[/C][/ROW]
[ROW][C]55[/C][C]109.49[/C][C]109.095604307238[/C][C]0.39439569276242[/C][/ROW]
[ROW][C]56[/C][C]109.04[/C][C]108.974558731023[/C][C]0.0654412689768803[/C][/ROW]
[/TABLE]
Source: https://freestatistics.org/blog/index.php?pk=58117&T=4

Globally Unique Identifier (entire table): ba.freestatistics.org/blog/index.php?pk=58117&T=4

As an alternative you can also use a QR Code:  

The GUIDs for individual cells are displayed in the table below:

Multiple Linear Regression - Actuals, Interpolation, and Residuals
Time or IndexActualsInterpolationForecastResidualsPrediction Error
199.0699.3334215628548-0.273421562854746
299.6599.38793384230740.262066157692614
399.8299.77931116783630.0406888321636927
499.9999.92049759379550.069502406204525
5100.33100.0333228257890.296677174210958
699.3198.96527331373860.344726686261437
7101.1100.8692583780540.230741621945542
8101.1100.7464147968850.353585203114607
9100.93100.9117926165490.0182073834511236
10100.85100.970962412409-0.120962412408868
11100.93101.109590773884-0.179590773884153
1299.699.5793527855050.0206472144950217
13101.88101.999998955701-0.119998955700819
14101.81102.039666195008-0.229666195008403
15102.38102.3557118898990.0242881101007720
16102.74102.6805186058170.0594813941826108
17102.82102.851025600870-0.031025600870458
18101.72101.5947238322190.125276167781191
19103.47103.4100069303180.0599930696824191
20102.98103.134364288943-0.154364288942553
21102.68103.003046000052-0.323046000051811
22102.9102.975554541530-0.0755545415297692
23103.03103.252615406587-0.222615406587493
24101.29101.451227594614-0.161227594614316
25103.69103.750193210448-0.0601932104483822
26103.68103.894956585759-0.214956585759212
27104.2104.22027378414-0.0202737841400317
28104.08104.409655490392-0.329655490391595
29104.16104.439416215429-0.279416215429192
30103.05103.134728410320-0.0847284103202966
31104.66104.881344999872-0.221344999872108
32104.46104.707912788672-0.247912788671913
33104.95104.8629317382540.0870682617455716
34105.85105.4015785866230.4484214133772
35106.23106.0059375226140.224062477386205
36104.86104.6950581709460.164941829053714
37107.44107.4254636276260.0145363723735566
38108.23107.9451550967580.284844903241532
39108.45108.751797373162-0.301797373161609
40109.39109.2342803757960.155719624203682
41110.15109.9046594525860.245340547414266
42109.13109.205874634595-0.0758746345947503
43110.28110.743785384518-0.463785384518273
44110.17110.186749394477-0.0167493944770209
45109.99109.7722296451450.217770354855116
46109.26109.511904459439-0.251904459438562
47109.11108.9318562969150.17814370308544
48107.06107.084361448934-0.02436144893442
49109.53109.0909226433700.439077356630390
50108.92109.022288280167-0.102288280166531
51109.24108.9829057849630.257094215037176
52109.12109.0750479341990.0449520658007774
53109109.231575905326-0.231575905325573
54107.23107.539399809128-0.309399809127581
55109.49109.0956043072380.39439569276242
56109.04108.9745587310230.0654412689768803


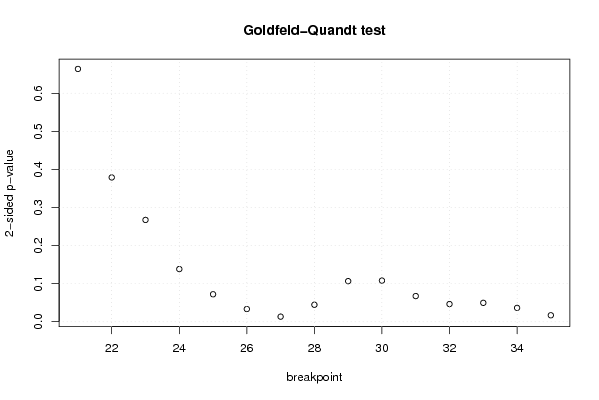
Goldfeld-Quandt test for Heteroskedasticity
p-valuesAlternative Hypothesis
breakpoint indexgreater2-sidedless
210.3319411442086230.6638822884172450.668058855791377
220.1894515028336160.3789030056672330.810548497166384
230.1336563204772190.2673126409544390.86634367952278
240.06909763654352540.1381952730870510.930902363456475
250.03600997172542130.07201994345084260.963990028274579
260.01662580854164270.03325161708328530.983374191458357
270.00661615674632560.01323231349265120.993383843253674
280.02225348507193510.04450697014387030.977746514928065
290.05326210308793110.1065242061758620.946737896912069
300.05396149014785750.1079229802957150.946038509852142
310.03363068291879750.0672613658375950.966369317081203
320.02315970649231580.04631941298463160.976840293507684
330.02475681515792290.04951363031584580.975243184842077
340.01810764614607830.03621529229215670.981892353853922
350.008435619531825310.01687123906365060.991564380468175

\begin{tabular}{lllllllll}
\hline
Goldfeld-Quandt test for Heteroskedasticity \tabularnewline
p-values & Alternative Hypothesis \tabularnewline
breakpoint index & greater & 2-sided & less \tabularnewline
21 & 0.331941144208623 & 0.663882288417245 & 0.668058855791377 \tabularnewline
22 & 0.189451502833616 & 0.378903005667233 & 0.810548497166384 \tabularnewline
23 & 0.133656320477219 & 0.267312640954439 & 0.86634367952278 \tabularnewline
24 & 0.0690976365435254 & 0.138195273087051 & 0.930902363456475 \tabularnewline
25 & 0.0360099717254213 & 0.0720199434508426 & 0.963990028274579 \tabularnewline
26 & 0.0166258085416427 & 0.0332516170832853 & 0.983374191458357 \tabularnewline
27 & 0.0066161567463256 & 0.0132323134926512 & 0.993383843253674 \tabularnewline
28 & 0.0222534850719351 & 0.0445069701438703 & 0.977746514928065 \tabularnewline
29 & 0.0532621030879311 & 0.106524206175862 & 0.946737896912069 \tabularnewline
30 & 0.0539614901478575 & 0.107922980295715 & 0.946038509852142 \tabularnewline
31 & 0.0336306829187975 & 0.067261365837595 & 0.966369317081203 \tabularnewline
32 & 0.0231597064923158 & 0.0463194129846316 & 0.976840293507684 \tabularnewline
33 & 0.0247568151579229 & 0.0495136303158458 & 0.975243184842077 \tabularnewline
34 & 0.0181076461460783 & 0.0362152922921567 & 0.981892353853922 \tabularnewline
35 & 0.00843561953182531 & 0.0168712390636506 & 0.991564380468175 \tabularnewline
\hline
\end{tabular}
%Source: https://freestatistics.org/blog/index.php?pk=58117&T=5

[TABLE]
[ROW][C]Goldfeld-Quandt test for Heteroskedasticity[/C][/ROW]
[ROW][C]p-values[/C][C]Alternative Hypothesis[/C][/ROW]
[ROW][C]breakpoint index[/C][C]greater[/C][C]2-sided[/C][C]less[/C][/ROW]
[ROW][C]21[/C][C]0.331941144208623[/C][C]0.663882288417245[/C][C]0.668058855791377[/C][/ROW]
[ROW][C]22[/C][C]0.189451502833616[/C][C]0.378903005667233[/C][C]0.810548497166384[/C][/ROW]
[ROW][C]23[/C][C]0.133656320477219[/C][C]0.267312640954439[/C][C]0.86634367952278[/C][/ROW]
[ROW][C]24[/C][C]0.0690976365435254[/C][C]0.138195273087051[/C][C]0.930902363456475[/C][/ROW]
[ROW][C]25[/C][C]0.0360099717254213[/C][C]0.0720199434508426[/C][C]0.963990028274579[/C][/ROW]
[ROW][C]26[/C][C]0.0166258085416427[/C][C]0.0332516170832853[/C][C]0.983374191458357[/C][/ROW]
[ROW][C]27[/C][C]0.0066161567463256[/C][C]0.0132323134926512[/C][C]0.993383843253674[/C][/ROW]
[ROW][C]28[/C][C]0.0222534850719351[/C][C]0.0445069701438703[/C][C]0.977746514928065[/C][/ROW]
[ROW][C]29[/C][C]0.0532621030879311[/C][C]0.106524206175862[/C][C]0.946737896912069[/C][/ROW]
[ROW][C]30[/C][C]0.0539614901478575[/C][C]0.107922980295715[/C][C]0.946038509852142[/C][/ROW]
[ROW][C]31[/C][C]0.0336306829187975[/C][C]0.067261365837595[/C][C]0.966369317081203[/C][/ROW]
[ROW][C]32[/C][C]0.0231597064923158[/C][C]0.0463194129846316[/C][C]0.976840293507684[/C][/ROW]
[ROW][C]33[/C][C]0.0247568151579229[/C][C]0.0495136303158458[/C][C]0.975243184842077[/C][/ROW]
[ROW][C]34[/C][C]0.0181076461460783[/C][C]0.0362152922921567[/C][C]0.981892353853922[/C][/ROW]
[ROW][C]35[/C][C]0.00843561953182531[/C][C]0.0168712390636506[/C][C]0.991564380468175[/C][/ROW]
[/TABLE]
Source: https://freestatistics.org/blog/index.php?pk=58117&T=5

Globally Unique Identifier (entire table): ba.freestatistics.org/blog/index.php?pk=58117&T=5

As an alternative you can also use a QR Code:  

The GUIDs for individual cells are displayed in the table below:

Goldfeld-Quandt test for Heteroskedasticity
p-valuesAlternative Hypothesis
breakpoint indexgreater2-sidedless
210.3319411442086230.6638822884172450.668058855791377
220.1894515028336160.3789030056672330.810548497166384
230.1336563204772190.2673126409544390.86634367952278
240.06909763654352540.1381952730870510.930902363456475
250.03600997172542130.07201994345084260.963990028274579
260.01662580854164270.03325161708328530.983374191458357
270.00661615674632560.01323231349265120.993383843253674
280.02225348507193510.04450697014387030.977746514928065
290.05326210308793110.1065242061758620.946737896912069
300.05396149014785750.1079229802957150.946038509852142
310.03363068291879750.0672613658375950.966369317081203
320.02315970649231580.04631941298463160.976840293507684
330.02475681515792290.04951363031584580.975243184842077
340.01810764614607830.03621529229215670.981892353853922
350.008435619531825310.01687123906365060.991564380468175


Meta Analysis of Goldfeld-Quandt test for Heteroskedasticity
Description# significant tests% significant testsOK/NOK
1% type I error level00OK
5% type I error level70.466666666666667NOK
10% type I error level90.6NOK

\begin{tabular}{lllllllll}
\hline
Meta Analysis of Goldfeld-Quandt test for Heteroskedasticity \tabularnewline
Description & # significant tests & % significant tests & OK/NOK \tabularnewline
1% type I error level & 0 & 0 & OK \tabularnewline
5% type I error level & 7 & 0.466666666666667 & NOK \tabularnewline
10% type I error level & 9 & 0.6 & NOK \tabularnewline
\hline
\end{tabular}
%Source: https://freestatistics.org/blog/index.php?pk=58117&T=6

[TABLE]
[ROW][C]Meta Analysis of Goldfeld-Quandt test for Heteroskedasticity[/C][/ROW]
[ROW][C]Description[/C][C]# significant tests[/C][C]% significant tests[/C][C]OK/NOK[/C][/ROW]
[ROW][C]1% type I error level[/C][C]0[/C][C]0[/C][C]OK[/C][/ROW]
[ROW][C]5% type I error level[/C][C]7[/C][C]0.466666666666667[/C][C]NOK[/C][/ROW]
[ROW][C]10% type I error level[/C][C]9[/C][C]0.6[/C][C]NOK[/C][/ROW]
[/TABLE]
Source: https://freestatistics.org/blog/index.php?pk=58117&T=6

Globally Unique Identifier (entire table): ba.freestatistics.org/blog/index.php?pk=58117&T=6

As an alternative you can also use a QR Code:  

The GUIDs for individual cells are displayed in the table below:

Meta Analysis of Goldfeld-Quandt test for Heteroskedasticity
Description# significant tests% significant testsOK/NOK
1% type I error level00OK
5% type I error level70.466666666666667NOK
10% type I error level90.6NOK


Parameters (Session):
par1 = 1 ; par2 = Include Monthly Dummies ; par3 = Linear Trend ;
Parameters (R input):
par1 = 1 ; par2 = Include Monthly Dummies ; par3 = Linear Trend ;
R code (references can be found in the software module):
library(lattice)
library(lmtest)
n25 <- 25 #minimum number of obs. for Goldfeld-Quandt test
par1 <- as.numeric(par1)
x <- t(y)
k <- length(x[1,])
n <- length(x[,1])
x1 <- cbind(x[,par1], x[,1:k!=par1])
mycolnames <- c(colnames(x)[par1], colnames(x)[1:k!=par1])
colnames(x1) <- mycolnames #colnames(x)[par1]
x <- x1
if (par3 == 'First Differences'){
x2 <- array(0, dim=c(n-1,k), dimnames=list(1:(n-1), paste('(1-B)',colnames(x),sep='')))
for (i in 1:n-1) {
for (j in 1:k) {
x2[i,j] <- x[i+1,j] - x[i,j]
}
}
x <- x2
}
if (par2 == 'Include Monthly Dummies'){
x2 <- array(0, dim=c(n,11), dimnames=list(1:n, paste('M', seq(1:11), sep ='')))
for (i in 1:11){
x2[seq(i,n,12),i] <- 1
}
x <- cbind(x, x2)
}
if (par2 == 'Include Quarterly Dummies'){
x2 <- array(0, dim=c(n,3), dimnames=list(1:n, paste('Q', seq(1:3), sep ='')))
for (i in 1:3){
x2[seq(i,n,4),i] <- 1
}
x <- cbind(x, x2)
}
k <- length(x[1,])
if (par3 == 'Linear Trend'){
x <- cbind(x, c(1:n))
colnames(x)[k+1] <- 't'
}
x
k <- length(x[1,])
df <- as.data.frame(x)
(mylm <- lm(df))
(mysum <- summary(mylm))
if (n > n25) {
kp3 <- k + 3
nmkm3 <- n - k - 3
gqarr <- array(NA, dim=c(nmkm3-kp3+1,3))
numgqtests <- 0
numsignificant1 <- 0
numsignificant5 <- 0
numsignificant10 <- 0
for (mypoint in kp3:nmkm3) {
j <- 0
numgqtests <- numgqtests + 1
for (myalt in c('greater', 'two.sided', 'less')) {
j <- j + 1
gqarr[mypoint-kp3+1,j] <- gqtest(mylm, point=mypoint, alternative=myalt)$p.value
}
if (gqarr[mypoint-kp3+1,2] < 0.01) numsignificant1 <- numsignificant1 + 1
if (gqarr[mypoint-kp3+1,2] < 0.05) numsignificant5 <- numsignificant5 + 1
if (gqarr[mypoint-kp3+1,2] < 0.10) numsignificant10 <- numsignificant10 + 1
}
gqarr
}
bitmap(file='test0.png')
plot(x[,1], type='l', main='Actuals and Interpolation', ylab='value of Actuals and Interpolation (dots)', xlab='time or index')
points(x[,1]-mysum$resid)
grid()
dev.off()
bitmap(file='test1.png')
plot(mysum$resid, type='b', pch=19, main='Residuals', ylab='value of Residuals', xlab='time or index')
grid()
dev.off()
bitmap(file='test2.png')
hist(mysum$resid, main='Residual Histogram', xlab='values of Residuals')
grid()
dev.off()
bitmap(file='test3.png')
densityplot(~mysum$resid,col='black',main='Residual Density Plot', xlab='values of Residuals')
dev.off()
bitmap(file='test4.png')
qqnorm(mysum$resid, main='Residual Normal Q-Q Plot')
qqline(mysum$resid)
grid()
dev.off()
(myerror <- as.ts(mysum$resid))
bitmap(file='test5.png')
dum <- cbind(lag(myerror,k=1),myerror)
dum
dum1 <- dum[2:length(myerror),]
dum1
z <- as.data.frame(dum1)
z
plot(z,main=paste('Residual Lag plot, lowess, and regression line'), ylab='values of Residuals', xlab='lagged values of Residuals')
lines(lowess(z))
abline(lm(z))
grid()
dev.off()
bitmap(file='test6.png')
acf(mysum$resid, lag.max=length(mysum$resid)/2, main='Residual Autocorrelation Function')
grid()
dev.off()
bitmap(file='test7.png')
pacf(mysum$resid, lag.max=length(mysum$resid)/2, main='Residual Partial Autocorrelation Function')
grid()
dev.off()
bitmap(file='test8.png')
opar <- par(mfrow = c(2,2), oma = c(0, 0, 1.1, 0))
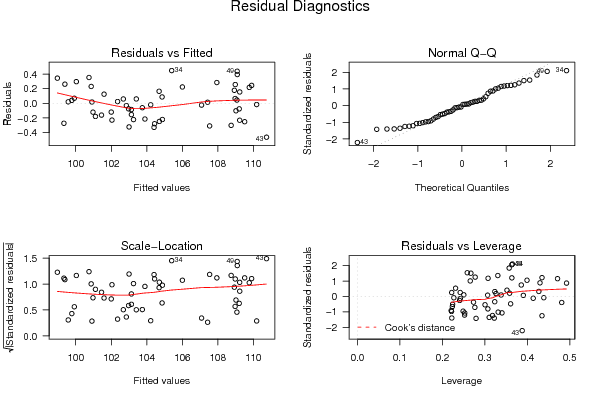
plot(mylm, las = 1, sub='Residual Diagnostics')
par(opar)
dev.off()
if (n > n25) {
bitmap(file='test9.png')
plot(kp3:nmkm3,gqarr[,2], main='Goldfeld-Quandt test',ylab='2-sided p-value',xlab='breakpoint')
grid()
dev.off()
}
load(file='createtable')
a<-table.start()
a<-table.row.start(a)
a<-table.element(a, 'Multiple Linear Regression - Estimated Regression Equation', 1, TRUE)
a<-table.row.end(a)
myeq <- colnames(x)[1]
myeq <- paste(myeq, '[t] = ', sep='')
for (i in 1:k){
if (mysum$coefficients[i,1] > 0) myeq <- paste(myeq, '+', '')
myeq <- paste(myeq, mysum$coefficients[i,1], sep=' ')
if (rownames(mysum$coefficients)[i] != '(Intercept)') {
myeq <- paste(myeq, rownames(mysum$coefficients)[i], sep='')
if (rownames(mysum$coefficients)[i] != 't') myeq <- paste(myeq, '[t]', sep='')
}
}
myeq <- paste(myeq, ' + e[t]')
a<-table.row.start(a)
a<-table.element(a, myeq)
a<-table.row.end(a)
a<-table.end(a)
table.save(a,file='mytable1.tab')
a<-table.start()
a<-table.row.start(a)
a<-table.element(a,hyperlink('ols1.htm','Multiple Linear Regression - Ordinary Least Squares',''), 6, TRUE)
a<-table.row.end(a)
a<-table.row.start(a)
a<-table.element(a,'Variable',header=TRUE)
a<-table.element(a,'Parameter',header=TRUE)
a<-table.element(a,'S.D.',header=TRUE)
a<-table.element(a,'T-STAT
H0: parameter = 0',header=TRUE)
a<-table.element(a,'2-tail p-value',header=TRUE)
a<-table.element(a,'1-tail p-value',header=TRUE)
a<-table.row.end(a)
for (i in 1:k){
a<-table.row.start(a)
a<-table.element(a,rownames(mysum$coefficients)[i],header=TRUE)
a<-table.element(a,mysum$coefficients[i,1])
a<-table.element(a, round(mysum$coefficients[i,2],6))
a<-table.element(a, round(mysum$coefficients[i,3],4))
a<-table.element(a, round(mysum$coefficients[i,4],6))
a<-table.element(a, round(mysum$coefficients[i,4]/2,6))
a<-table.row.end(a)
}
a<-table.end(a)
table.save(a,file='mytable2.tab')
a<-table.start()
a<-table.row.start(a)
a<-table.element(a, 'Multiple Linear Regression - Regression Statistics', 2, TRUE)
a<-table.row.end(a)
a<-table.row.start(a)
a<-table.element(a, 'Multiple R',1,TRUE)
a<-table.element(a, sqrt(mysum$r.squared))
a<-table.row.end(a)
a<-table.row.start(a)
a<-table.element(a, 'R-squared',1,TRUE)
a<-table.element(a, mysum$r.squared)
a<-table.row.end(a)
a<-table.row.start(a)
a<-table.element(a, 'Adjusted R-squared',1,TRUE)
a<-table.element(a, mysum$adj.r.squared)
a<-table.row.end(a)
a<-table.row.start(a)
a<-table.element(a, 'F-TEST (value)',1,TRUE)
a<-table.element(a, mysum$fstatistic[1])
a<-table.row.end(a)
a<-table.row.start(a)
a<-table.element(a, 'F-TEST (DF numerator)',1,TRUE)
a<-table.element(a, mysum$fstatistic[2])
a<-table.row.end(a)
a<-table.row.start(a)
a<-table.element(a, 'F-TEST (DF denominator)',1,TRUE)
a<-table.element(a, mysum$fstatistic[3])
a<-table.row.end(a)
a<-table.row.start(a)
a<-table.element(a, 'p-value',1,TRUE)
a<-table.element(a, 1-pf(mysum$fstatistic[1],mysum$fstatistic[2],mysum$fstatistic[3]))
a<-table.row.end(a)
a<-table.row.start(a)
a<-table.element(a, 'Multiple Linear Regression - Residual Statistics', 2, TRUE)
a<-table.row.end(a)
a<-table.row.start(a)
a<-table.element(a, 'Residual Standard Deviation',1,TRUE)
a<-table.element(a, mysum$sigma)
a<-table.row.end(a)
a<-table.row.start(a)
a<-table.element(a, 'Sum Squared Residuals',1,TRUE)
a<-table.element(a, sum(myerror*myerror))
a<-table.row.end(a)
a<-table.end(a)
table.save(a,file='mytable3.tab')
a<-table.start()
a<-table.row.start(a)
a<-table.element(a, 'Multiple Linear Regression - Actuals, Interpolation, and Residuals', 4, TRUE)
a<-table.row.end(a)
a<-table.row.start(a)
a<-table.element(a, 'Time or Index', 1, TRUE)
a<-table.element(a, 'Actuals', 1, TRUE)
a<-table.element(a, 'Interpolation
Forecast', 1, TRUE)
a<-table.element(a, 'Residuals
Prediction Error', 1, TRUE)
a<-table.row.end(a)
for (i in 1:n) {
a<-table.row.start(a)
a<-table.element(a,i, 1, TRUE)
a<-table.element(a,x[i])
a<-table.element(a,x[i]-mysum$resid[i])
a<-table.element(a,mysum$resid[i])
a<-table.row.end(a)
}
a<-table.end(a)
table.save(a,file='mytable4.tab')
if (n > n25) {
a<-table.start()
a<-table.row.start(a)
a<-table.element(a,'Goldfeld-Quandt test for Heteroskedasticity',4,TRUE)
a<-table.row.end(a)
a<-table.row.start(a)
a<-table.element(a,'p-values',header=TRUE)
a<-table.element(a,'Alternative Hypothesis',3,header=TRUE)
a<-table.row.end(a)
a<-table.row.start(a)
a<-table.element(a,'breakpoint index',header=TRUE)
a<-table.element(a,'greater',header=TRUE)
a<-table.element(a,'2-sided',header=TRUE)
a<-table.element(a,'less',header=TRUE)
a<-table.row.end(a)
for (mypoint in kp3:nmkm3) {
a<-table.row.start(a)
a<-table.element(a,mypoint,header=TRUE)
a<-table.element(a,gqarr[mypoint-kp3+1,1])
a<-table.element(a,gqarr[mypoint-kp3+1,2])
a<-table.element(a,gqarr[mypoint-kp3+1,3])
a<-table.row.end(a)
}
a<-table.end(a)
table.save(a,file='mytable5.tab')
a<-table.start()
a<-table.row.start(a)
a<-table.element(a,'Meta Analysis of Goldfeld-Quandt test for Heteroskedasticity',4,TRUE)
a<-table.row.end(a)
a<-table.row.start(a)
a<-table.element(a,'Description',header=TRUE)
a<-table.element(a,'# significant tests',header=TRUE)
a<-table.element(a,'% significant tests',header=TRUE)
a<-table.element(a,'OK/NOK',header=TRUE)
a<-table.row.end(a)
a<-table.row.start(a)
a<-table.element(a,'1% type I error level',header=TRUE)
a<-table.element(a,numsignificant1)
a<-table.element(a,numsignificant1/numgqtests)
if (numsignificant1/numgqtests < 0.01) dum <- 'OK' else dum <- 'NOK'
a<-table.element(a,dum)
a<-table.row.end(a)
a<-table.row.start(a)
a<-table.element(a,'5% type I error level',header=TRUE)
a<-table.element(a,numsignificant5)
a<-table.element(a,numsignificant5/numgqtests)
if (numsignificant5/numgqtests < 0.05) dum <- 'OK' else dum <- 'NOK'
a<-table.element(a,dum)
a<-table.row.end(a)
a<-table.row.start(a)
a<-table.element(a,'10% type I error level',header=TRUE)
a<-table.element(a,numsignificant10)
a<-table.element(a,numsignificant10/numgqtests)
if (numsignificant10/numgqtests < 0.1) dum <- 'OK' else dum <- 'NOK'
a<-table.element(a,dum)
a<-table.row.end(a)
a<-table.end(a)
table.save(a,file='mytable6.tab')
}