| Multiple Linear Regression - Estimated Regression Equation |
| Y[t] = + 12.0075106155311 + 0.00706906994709151X[t] + 0.492628156335883Y1[t] + 0.141018411173Y2[t] + 0.00778650777325245Y3[t] + 0.210384272455964Y4[t] + 3.10696889836303M1[t] + 2.18939852178247M2[t] + 2.06031177005909M3[t] + 2.32501060991481M4[t] + 1.76821492983135M5[t] + 0.33342314126969M6[t] + 2.55766571757778M7[t] + 1.64749851532543M8[t] + 1.54105844819217M9[t] + 1.91751211161407M10[t] + 1.68745560545471M11[t] + 0.0151867036463499t + e[t] |
| Multiple Linear Regression - Ordinary Least Squares | |||||
| Variable | Parameter | S.D. | T-STAT H0: parameter = 0 | 2-tail p-value | 1-tail p-value |
| (Intercept) | 12.0075106155311 | 4.458237 | 2.6933 | 0.010469 | 0.005234 |
| X | 0.00706906994709151 | 0.001277 | 5.5351 | 2e-06 | 1e-06 |
| Y1 | 0.492628156335883 | 0.147233 | 3.3459 | 0.001856 | 0.000928 |
| Y2 | 0.141018411173 | 0.168918 | 0.8348 | 0.409029 | 0.204514 |
| Y3 | 0.00778650777325245 | 0.183195 | 0.0425 | 0.96632 | 0.48316 |
| Y4 | 0.210384272455964 | 0.151534 | 1.3884 | 0.173113 | 0.086557 |
| M1 | 3.10696889836303 | 0.30933 | 10.0442 | 0 | 0 |
| M2 | 2.18939852178247 | 0.375757 | 5.8266 | 1e-06 | 0 |
| M3 | 2.06031177005909 | 0.401601 | 5.1302 | 9e-06 | 4e-06 |
| M4 | 2.32501060991481 | 0.394889 | 5.8878 | 1e-06 | 0 |
| M5 | 1.76821492983135 | 0.182991 | 9.6628 | 0 | 0 |
| M6 | 0.33342314126969 | 0.185596 | 1.7965 | 0.080368 | 0.040184 |
| M7 | 2.55766571757778 | 0.274398 | 9.321 | 0 | 0 |
| M8 | 1.64749851532543 | 0.30322 | 5.4333 | 3e-06 | 2e-06 |
| M9 | 1.54105844819217 | 0.299573 | 5.1442 | 8e-06 | 4e-06 |
| M10 | 1.91751211161407 | 0.296605 | 6.4649 | 0 | 0 |
| M11 | 1.68745560545471 | 0.192941 | 8.746 | 0 | 0 |
| t | 0.0151867036463499 | 0.010331 | 1.47 | 0.149788 | 0.074894 |
| Multiple Linear Regression - Regression Statistics | |
| Multiple R | 0.998073681717132 |
| R-squared | 0.99615107413639 |
| Adjusted R-squared | 0.99442918625004 |
| F-TEST (value) | 578.522609998258 |
| F-TEST (DF numerator) | 17 |
| F-TEST (DF denominator) | 38 |
| p-value | 0 |
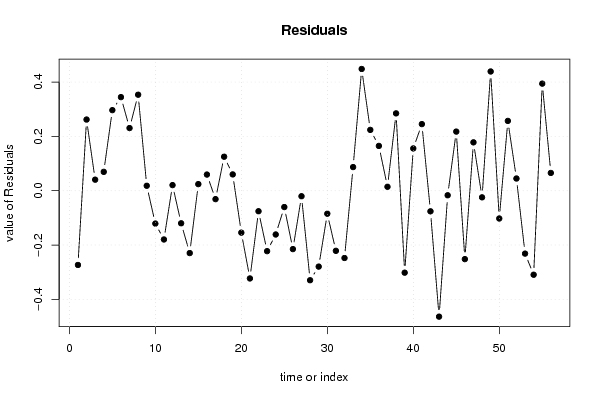
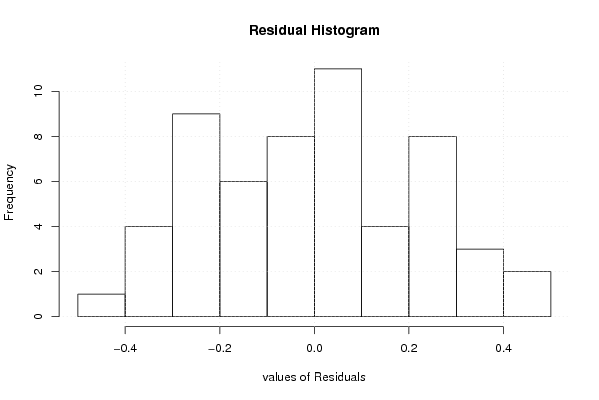
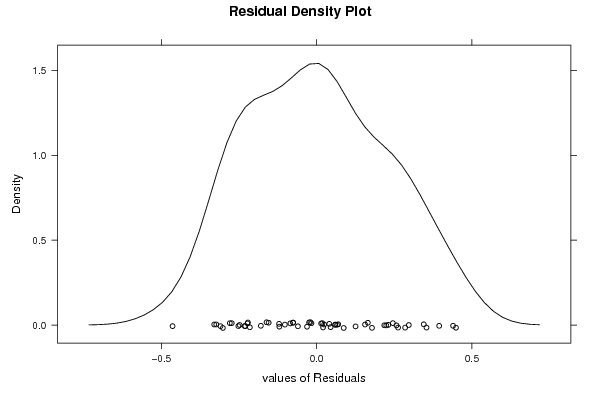
| Multiple Linear Regression - Residual Statistics | |
| Residual Standard Deviation | 0.267843432610432 |
| Sum Squared Residuals | 2.72612396691648 |
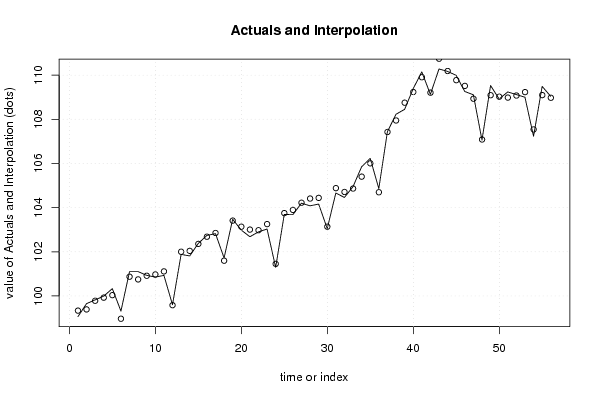
| Multiple Linear Regression - Actuals, Interpolation, and Residuals | |||
| Time or Index | Actuals | Interpolation Forecast | Residuals Prediction Error |
| 1 | 99.06 | 99.3334215628548 | -0.273421562854746 |
| 2 | 99.65 | 99.3879338423074 | 0.262066157692614 |
| 3 | 99.82 | 99.7793111678363 | 0.0406888321636927 |
| 4 | 99.99 | 99.9204975937955 | 0.069502406204525 |
| 5 | 100.33 | 100.033322825789 | 0.296677174210958 |
| 6 | 99.31 | 98.9652733137386 | 0.344726686261437 |
| 7 | 101.1 | 100.869258378054 | 0.230741621945542 |
| 8 | 101.1 | 100.746414796885 | 0.353585203114607 |
| 9 | 100.93 | 100.911792616549 | 0.0182073834511236 |
| 10 | 100.85 | 100.970962412409 | -0.120962412408868 |
| 11 | 100.93 | 101.109590773884 | -0.179590773884153 |
| 12 | 99.6 | 99.579352785505 | 0.0206472144950217 |
| 13 | 101.88 | 101.999998955701 | -0.119998955700819 |
| 14 | 101.81 | 102.039666195008 | -0.229666195008403 |
| 15 | 102.38 | 102.355711889899 | 0.0242881101007720 |
| 16 | 102.74 | 102.680518605817 | 0.0594813941826108 |
| 17 | 102.82 | 102.851025600870 | -0.031025600870458 |
| 18 | 101.72 | 101.594723832219 | 0.125276167781191 |
| 19 | 103.47 | 103.410006930318 | 0.0599930696824191 |
| 20 | 102.98 | 103.134364288943 | -0.154364288942553 |
| 21 | 102.68 | 103.003046000052 | -0.323046000051811 |
| 22 | 102.9 | 102.975554541530 | -0.0755545415297692 |
| 23 | 103.03 | 103.252615406587 | -0.222615406587493 |
| 24 | 101.29 | 101.451227594614 | -0.161227594614316 |
| 25 | 103.69 | 103.750193210448 | -0.0601932104483822 |
| 26 | 103.68 | 103.894956585759 | -0.214956585759212 |
| 27 | 104.2 | 104.22027378414 | -0.0202737841400317 |
| 28 | 104.08 | 104.409655490392 | -0.329655490391595 |
| 29 | 104.16 | 104.439416215429 | -0.279416215429192 |
| 30 | 103.05 | 103.134728410320 | -0.0847284103202966 |
| 31 | 104.66 | 104.881344999872 | -0.221344999872108 |
| 32 | 104.46 | 104.707912788672 | -0.247912788671913 |
| 33 | 104.95 | 104.862931738254 | 0.0870682617455716 |
| 34 | 105.85 | 105.401578586623 | 0.4484214133772 |
| 35 | 106.23 | 106.005937522614 | 0.224062477386205 |
| 36 | 104.86 | 104.695058170946 | 0.164941829053714 |
| 37 | 107.44 | 107.425463627626 | 0.0145363723735566 |
| 38 | 108.23 | 107.945155096758 | 0.284844903241532 |
| 39 | 108.45 | 108.751797373162 | -0.301797373161609 |
| 40 | 109.39 | 109.234280375796 | 0.155719624203682 |
| 41 | 110.15 | 109.904659452586 | 0.245340547414266 |
| 42 | 109.13 | 109.205874634595 | -0.0758746345947503 |
| 43 | 110.28 | 110.743785384518 | -0.463785384518273 |
| 44 | 110.17 | 110.186749394477 | -0.0167493944770209 |
| 45 | 109.99 | 109.772229645145 | 0.217770354855116 |
| 46 | 109.26 | 109.511904459439 | -0.251904459438562 |
| 47 | 109.11 | 108.931856296915 | 0.17814370308544 |
| 48 | 107.06 | 107.084361448934 | -0.02436144893442 |
| 49 | 109.53 | 109.090922643370 | 0.439077356630390 |
| 50 | 108.92 | 109.022288280167 | -0.102288280166531 |
| 51 | 109.24 | 108.982905784963 | 0.257094215037176 |
| 52 | 109.12 | 109.075047934199 | 0.0449520658007774 |
| 53 | 109 | 109.231575905326 | -0.231575905325573 |
| 54 | 107.23 | 107.539399809128 | -0.309399809127581 |
| 55 | 109.49 | 109.095604307238 | 0.39439569276242 |
| 56 | 109.04 | 108.974558731023 | 0.0654412689768803 |
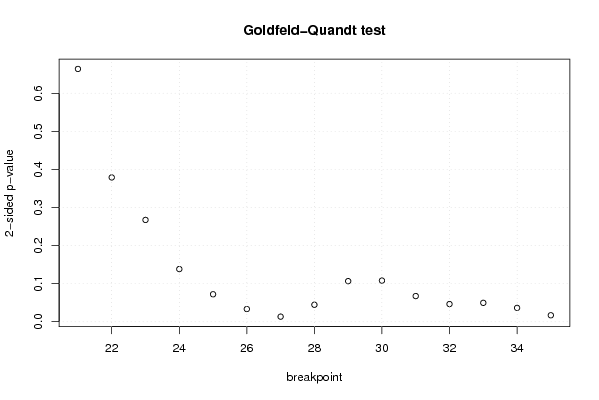
| Goldfeld-Quandt test for Heteroskedasticity | |||
| p-values | Alternative Hypothesis | ||
| breakpoint index | greater | 2-sided | less |
| 21 | 0.331941144208623 | 0.663882288417245 | 0.668058855791377 |
| 22 | 0.189451502833616 | 0.378903005667233 | 0.810548497166384 |
| 23 | 0.133656320477219 | 0.267312640954439 | 0.86634367952278 |
| 24 | 0.0690976365435254 | 0.138195273087051 | 0.930902363456475 |
| 25 | 0.0360099717254213 | 0.0720199434508426 | 0.963990028274579 |
| 26 | 0.0166258085416427 | 0.0332516170832853 | 0.983374191458357 |
| 27 | 0.0066161567463256 | 0.0132323134926512 | 0.993383843253674 |
| 28 | 0.0222534850719351 | 0.0445069701438703 | 0.977746514928065 |
| 29 | 0.0532621030879311 | 0.106524206175862 | 0.946737896912069 |
| 30 | 0.0539614901478575 | 0.107922980295715 | 0.946038509852142 |
| 31 | 0.0336306829187975 | 0.067261365837595 | 0.966369317081203 |
| 32 | 0.0231597064923158 | 0.0463194129846316 | 0.976840293507684 |
| 33 | 0.0247568151579229 | 0.0495136303158458 | 0.975243184842077 |
| 34 | 0.0181076461460783 | 0.0362152922921567 | 0.981892353853922 |
| 35 | 0.00843561953182531 | 0.0168712390636506 | 0.991564380468175 |
| Meta Analysis of Goldfeld-Quandt test for Heteroskedasticity | |||
| Description | # significant tests | % significant tests | OK/NOK |
| 1% type I error level | 0 | 0 | OK |
| 5% type I error level | 7 | 0.466666666666667 | NOK |
| 10% type I error level | 9 | 0.6 | NOK |