| Multiple Linear Regression - Estimated Regression Equation |
| Y[t] = -0.058305651363869 + 0.137027387478230X[t] + 1.10866834203965Y1[t] -0.249101268939407Y2[t] + 0.287991683589359Y3[t] -0.279080454525577Y4[t] + 0.320790312672266M1[t] + 0.116328593481165M2[t] + 0.110447908369543M3[t] -0.0673342499160004M4[t] + 0.0821570543575485M5[t] + 0.120058718766382M6[t] -0.0130182686618101M7[t] + 0.157207676289636M8[t] + 0.0393839845475236M9[t] + 0.163883815589508M10[t] + 0.218443697121927M11[t] -0.00386587778519627t + e[t] |
| Multiple Linear Regression - Ordinary Least Squares | |||||
| Variable | Parameter | S.D. | T-STAT H0: parameter = 0 | 2-tail p-value | 1-tail p-value |
| (Intercept) | -0.058305651363869 | 0.637778 | -0.0914 | 0.927639 | 0.46382 |
| X | 0.137027387478230 | 0.293994 | 0.4661 | 0.643812 | 0.321906 |
| Y1 | 1.10866834203965 | 0.160608 | 6.903 | 0 | 0 |
| Y2 | -0.249101268939407 | 0.238615 | -1.0439 | 0.303107 | 0.151553 |
| Y3 | 0.287991683589359 | 0.239553 | 1.2022 | 0.236723 | 0.118362 |
| Y4 | -0.279080454525577 | 0.191233 | -1.4594 | 0.15268 | 0.07634 |
| M1 | 0.320790312672266 | 0.331669 | 0.9672 | 0.33956 | 0.16978 |
| M2 | 0.116328593481165 | 0.331561 | 0.3509 | 0.727638 | 0.363819 |
| M3 | 0.110447908369543 | 0.333414 | 0.3313 | 0.742265 | 0.371133 |
| M4 | -0.0673342499160004 | 0.336104 | -0.2003 | 0.842285 | 0.421142 |
| M5 | 0.0821570543575485 | 0.337721 | 0.2433 | 0.809106 | 0.404553 |
| M6 | 0.120058718766382 | 0.335577 | 0.3578 | 0.722497 | 0.361248 |
| M7 | -0.0130182686618101 | 0.334112 | -0.039 | 0.969123 | 0.484562 |
| M8 | 0.157207676289636 | 0.339228 | 0.4634 | 0.645701 | 0.322851 |
| M9 | 0.0393839845475236 | 0.350849 | 0.1123 | 0.911213 | 0.455607 |
| M10 | 0.163883815589508 | 0.350576 | 0.4675 | 0.642833 | 0.321417 |
| M11 | 0.218443697121927 | 0.348888 | 0.6261 | 0.534983 | 0.267491 |
| t | -0.00386587778519627 | 0.017938 | -0.2155 | 0.830519 | 0.415259 |
| Multiple Linear Regression - Regression Statistics | |
| Multiple R | 0.934763527130169 |
| R-squared | 0.873782851652834 |
| Adjusted R-squared | 0.817317285286997 |
| F-TEST (value) | 15.4746141390249 |
| F-TEST (DF numerator) | 17 |
| F-TEST (DF denominator) | 38 |
| p-value | 3.91486842943323e-12 |
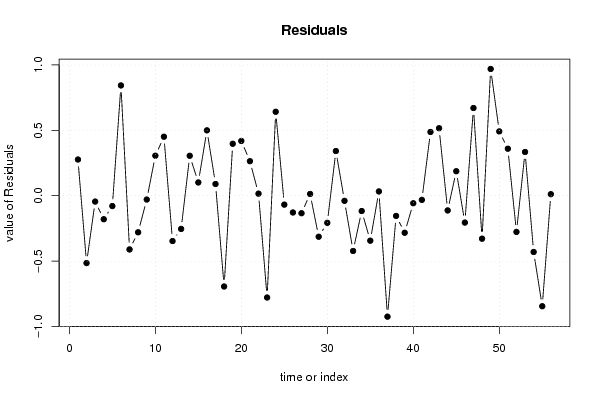
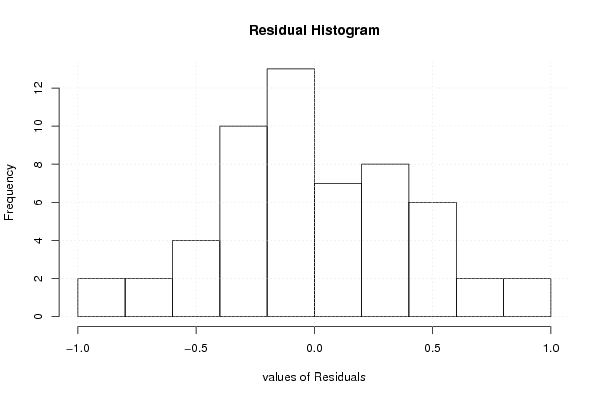
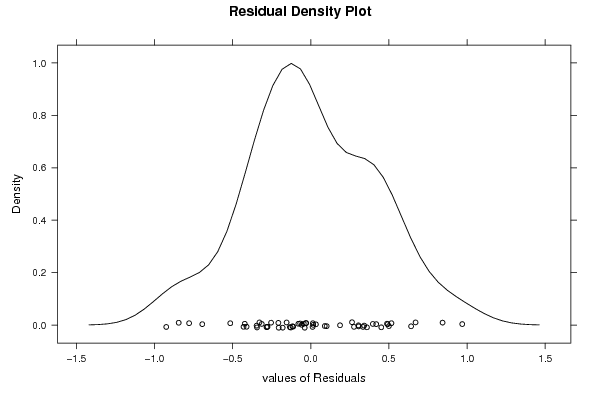
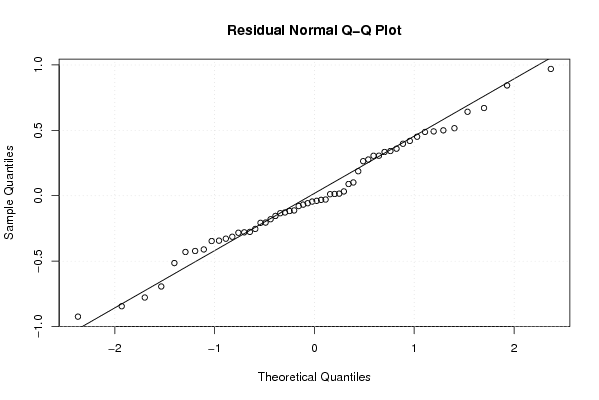
| Multiple Linear Regression - Residual Statistics | |
| Residual Standard Deviation | 0.492305597910813 |
| Sum Squared Residuals | 9.20986246590427 |
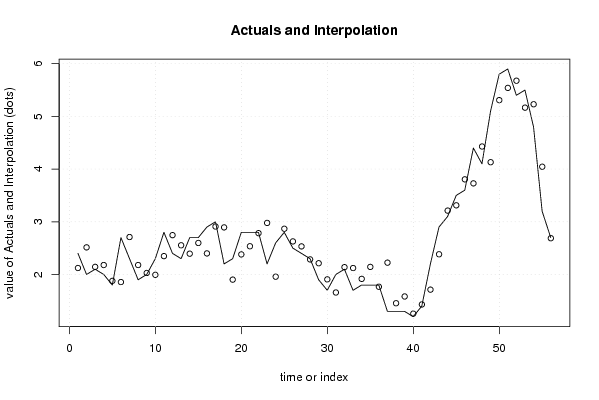
| Multiple Linear Regression - Actuals, Interpolation, and Residuals | |||
| Time or Index | Actuals | Interpolation Forecast | Residuals Prediction Error |
| 1 | 2.4 | 2.12318585497908 | 0.276814145020917 |
| 2 | 2 | 2.51477296336021 | -0.514772963360206 |
| 3 | 2.1 | 2.14459844480761 | -0.044598444807606 |
| 4 | 2 | 2.17969561086124 | -0.179695610861243 |
| 5 | 1.8 | 1.87899108464804 | -0.078991084648042 |
| 6 | 2.7 | 1.85663467992686 | 0.843365320073144 |
| 7 | 2.3 | 2.71060636252554 | -0.410606362525543 |
| 8 | 1.9 | 2.17961765956515 | -0.279617659565151 |
| 9 | 2 | 2.02910986693328 | -0.0291098669332829 |
| 10 | 2.3 | 1.99388207946104 | 0.306117920538964 |
| 11 | 2.8 | 2.3487019673007 | 0.451298032699298 |
| 12 | 2.4 | 2.74642753290075 | -0.346427532900748 |
| 13 | 2.3 | 2.55382345612650 | -0.253823456126503 |
| 14 | 2.7 | 2.39454123795901 | 0.305458762040989 |
| 15 | 2.7 | 2.59843523807346 | 0.101564761926538 |
| 16 | 2.9 | 2.39997970787825 | 0.500020292121745 |
| 17 | 3 | 2.91044352166284 | 0.0895564783371611 |
| 18 | 2.2 | 2.89389370689233 | -0.693893706892329 |
| 19 | 2.3 | 1.90270437787115 | 0.39729562212885 |
| 20 | 2.8 | 2.38097112321714 | 0.419028876782861 |
| 21 | 2.8 | 2.5358853009908 | 0.264114699009200 |
| 22 | 2.8 | 2.78403215175728 | 0.0159678482427183 |
| 23 | 2.2 | 2.97821942934227 | -0.778219429342273 |
| 24 | 2.6 | 1.95801999132248 | 0.64198000867752 |
| 25 | 2.8 | 2.86787252438906 | -0.0678725243890555 |
| 26 | 2.5 | 2.62802691233826 | -0.128026912338263 |
| 27 | 2.4 | 2.53357755181536 | -0.133577551815362 |
| 28 | 2.3 | 2.2864241468762 | 0.013575853123798 |
| 29 | 1.9 | 2.21347118719608 | -0.313471187196083 |
| 30 | 1.7 | 1.90716938776784 | -0.207169387767836 |
| 31 | 2 | 1.65820442981416 | 0.34179557018584 |
| 32 | 2.1 | 2.13888045964395 | -0.0388804596439531 |
| 33 | 1.7 | 2.12243420135375 | -0.422434201353752 |
| 34 | 1.8 | 1.91690428688266 | -0.116904286882661 |
| 35 | 1.8 | 2.14373477253261 | -0.34373477253261 |
| 36 | 1.8 | 1.76711309059107 | 0.0328869094089332 |
| 37 | 1.3 | 2.22446887564730 | -0.924468875647303 |
| 38 | 1.3 | 1.45445317032036 | -0.154453170320357 |
| 39 | 1.3 | 1.58295998064106 | -0.282959980641065 |
| 40 | 1.2 | 1.25731610277565 | -0.0573161027756455 |
| 41 | 1.4 | 1.43161492232282 | -0.0316149223228211 |
| 42 | 2.2 | 1.71229450424833 | 0.487705495751671 |
| 43 | 2.9 | 2.38366689051985 | 0.516333109480153 |
| 44 | 3.1 | 3.21232016413276 | -0.112320164132756 |
| 45 | 3.5 | 3.31257063072217 | 0.187429369277835 |
| 46 | 3.6 | 3.80518148189902 | -0.205181481899022 |
| 47 | 4.4 | 3.72934383082442 | 0.670656169175584 |
| 48 | 4.1 | 4.4284393851857 | -0.328439385185703 |
| 49 | 5.1 | 4.13064928885805 | 0.969350711141945 |
| 50 | 5.8 | 5.30820571602216 | 0.491794283977837 |
| 51 | 5.9 | 5.5404287846625 | 0.359571215337495 |
| 52 | 5.4 | 5.67658443160866 | -0.276584431608655 |
| 53 | 5.5 | 5.16547928417022 | 0.334520715829784 |
| 54 | 4.8 | 5.23000772116465 | -0.43000772116465 |
| 55 | 3.2 | 4.0448179392693 | -0.8448179392693 |
| 56 | 2.7 | 2.688210593441 | 0.0117894065589985 |
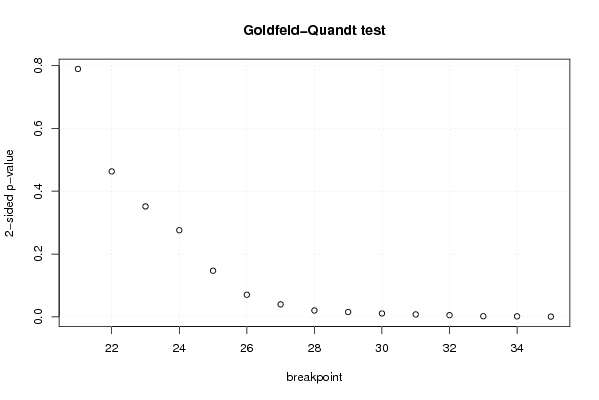
| Goldfeld-Quandt test for Heteroskedasticity | |||
| p-values | Alternative Hypothesis | ||
| breakpoint index | greater | 2-sided | less |
| 21 | 0.394726276482117 | 0.789452552964234 | 0.605273723517883 |
| 22 | 0.231530789110347 | 0.463061578220695 | 0.768469210889653 |
| 23 | 0.175845990151245 | 0.351691980302489 | 0.824154009848755 |
| 24 | 0.137901630530378 | 0.275803261060757 | 0.862098369469622 |
| 25 | 0.0734290404129046 | 0.146858080825809 | 0.926570959587095 |
| 26 | 0.0351912754960505 | 0.0703825509921009 | 0.96480872450395 |
| 27 | 0.0198384985295879 | 0.0396769970591758 | 0.980161501470412 |
| 28 | 0.0101129584916064 | 0.0202259169832129 | 0.989887041508394 |
| 29 | 0.00768260017233324 | 0.0153652003446665 | 0.992317399827667 |
| 30 | 0.00537244374315765 | 0.0107448874863153 | 0.994627556256842 |
| 31 | 0.00386407373757688 | 0.00772814747515377 | 0.996135926262423 |
| 32 | 0.00260733673932073 | 0.00521467347864147 | 0.99739266326068 |
| 33 | 0.000971801885163583 | 0.00194360377032717 | 0.999028198114836 |
| 34 | 0.000801982765038818 | 0.00160396553007764 | 0.99919801723496 |
| 35 | 0.000287089853091043 | 0.000574179706182085 | 0.999712910146909 |
| Meta Analysis of Goldfeld-Quandt test for Heteroskedasticity | |||
| Description | # significant tests | % significant tests | OK/NOK |
| 1% type I error level | 5 | 0.333333333333333 | NOK |
| 5% type I error level | 9 | 0.6 | NOK |
| 10% type I error level | 10 | 0.666666666666667 | NOK |